Unleashing the Power of Big Data and Distributed Computing: A Comprehensive Guide

Today’s data-driven world requires organisations worldwide to effectively manage massive amounts of information. Technologies like Big Data and Distributed Computing are essential for processing, analysing, and drawing meaningful conclusions from massive datasets.

Consider enrolling in a renowned data science course in India if you want the skills and information necessary to succeed in this fast-paced business and are interested in entering the exciting subject of data science.

Let’s explore the exciting world of distributed computing and big data!

Understanding the Challenges of Traditional Data Processing

Volume, Velocity, Variety, and Veracity of Big Data

  • Volume: Traditional data includes small to medium-sized datasets, easily manageable with conventional processing methods. In contrast, big data involves vast datasets requiring specialised technologies due to their sheer size.
  • Variety: Traditional data is structured and organised in tables, columns, and rows. In contrast, big data can be structured, unstructured, or semi-structured, incorporating various data types like text, images, tvideos, and more.
  • Velocity: Traditional data is static and updated periodically. On the other hand, big data is dynamic and updated in real-time or near real-time, requiring efficient and continuous processing.
  • Veracity: Veracity in Big Data refers to data accuracy and reliability. Ensuring trustworthy data is crucial for making informed decisions and avoiding erroneous insights.

A career in data science requires proficiency in handling both traditional and big data, employing cutting-edge tools and techniques to extract meaningful insights and support informed decision-making.

Scalability and Performance Issues

In data science training, understanding the challenges of data scalability and performance in traditional systems is vital. Traditional methods need help to handle large data volumes effectively, and their performance deteriorates as data size increases.

Learning modern Big Data technologies and distributed computing frameworks is essential to overcome these challenges.

Cost of Data Storage and Processing

Data storage and processing costs depend on data volume, chosen technology, cloud provider (if used), and data management needs. Cloud solutions offer flexibility with pay-as-you-go models, while traditional on-premises setups may involve upfront expenses.

What is Distributed Computing?

Definition and Concepts

Distributed computing is a model that distributes software components across multiple computers or nodes. Despite their dispersed locations, these components operate cohesively as a unified system to enhance efficiency and performance.

By leveraging distributed computing, performance, resilience, and scalability can be significantly improved. Consequently, it has become a prevalent computing model in the design of databases and applications.

Aspiring data analysts can benefit from data analytics certification courses that delve into this essential topic, equipping them with valuable skills for handling large-scale data processing and analysis in real-world scenarios.

Distributed Systems Architecture

The architectural model in distributed computing refers to the overall system design and structure, organising components for interactions and desired functionalities.

It offers an overview of development, preparation, and operations, crucial for cost-efficient usage and improved scalability.

Critical aspects of the model include client-server, peer-to-peer, layered, and microservices models.

Distributed Data Storage and Processing

As a developer, a distributed data store is where you manage application data, metrics, logs, etc. Examples include MongoDB, AWS S3, and Google Cloud Spanner.

Distributed data stores come as cloud-managed services or self-deployed products. You can even build your own, either from scratch or on existing data stores. Flexibility in data storage and retrieval is essential for developers.

Distributed processing divides complex tasks among multiple machines or nodes for seamless output. It’s widely used in cloud computing, blockchain farms, MMOs, and post-production software for efficient rendering and coordination.

Distributed File Systems (e.g., Hadoop Distributed File System – HDFS)

HDFS ensures reliable storage of massive data sets and high-bandwidth streaming to user applications. Thousands of servers in large clusters handle storage and computation, enabling scalable growth and cost-effectiveness.

Big Data Technologies in Data Science and Analytics
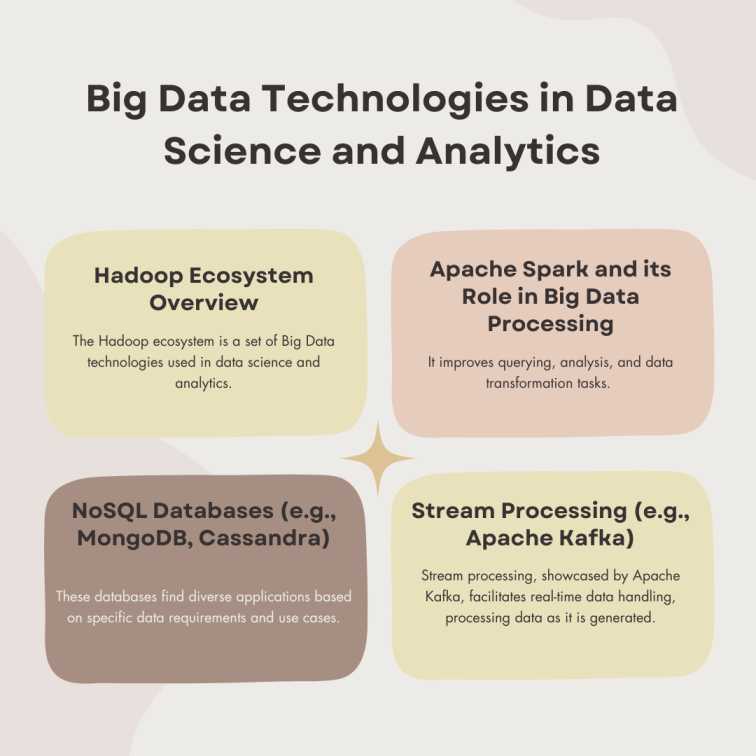
Big Data Technologies in Data Science and Analytics

Hadoop Ecosystem Overview

The Hadoop ecosystem is a set of Big Data technologies used in data science and analytics. It includes components like HDFS for distributed storage, MapReduce and Spark for data processing, Hive and Pig for querying and HBase for real-time access. 

Tools like Sqoop, Flume, Kafka, and Oozie enhance data handling and analysis capabilities. Together, they enable scalable and efficient data processing and analysis.

Apache Spark and its Role in Big Data Processing

Apache Spark, a versatile data handling and processing engine, empowers data scientists in various scenarios. It improves querying, analysis, and data transformation tasks. 

Spark excels at interactive queries on large datasets, processing streaming data from sensors, and performing machine learning tasks.

Typical Apache Spark use cases in a data science course include:

  • Real-time stream processing: Spark enables real-time analysis of data streams, such as identifying fraudulent transactions in financial data.
  • Machine learning: Spark’s in-memory data storage facilitates quicker querying, making it ideal for training ML algorithms.
  • Interactive analytics: Data scientists can explore data interactively by asking questions, fostering quick and responsive data analysis.
  • Data integration: Spark is increasingly used in ETL processes to pull, clean, and standardise data from diverse sources, reducing time and cost.

Aspiring data scientists benefit from learning Apache Spark in data science courses to leverage its powerful capabilities for diverse data-related tasks.

NoSQL Databases (e.g., MongoDB, Cassandra)

MongoDB and Cassandra are NoSQL databases tailored for extensive data storage and processing.

MongoDB’s document-oriented approach allows flexibility with JSON-like documents, while Cassandra’s decentralised nature ensures high availability and scalability.

These databases find diverse applications based on specific data requirements and use cases.

Stream Processing (e.g., Apache Kafka)

Stream processing, showcased by Apache Kafka, facilitates real-time data handling, processing data as it is generated. It empowers real-time analytics, event-driven apps, and immediate responses to streaming data.

With high throughput and fault tolerance, Apache Kafka is a widely used distributed streaming platform for diverse real-time data applications and use cases.

Extract, Transform, Load (ETL) for Big Data

Data Ingestion from Various Sources

Data ingestion involves moving data from various sources, but in real-world scenarios, businesses face challenges with multiple units, diverse applications, file types, and systems.

Data Transformation and Cleansing

Data transformation involves converting data from one format to another, often from the format of the source system to the desired format. It is crucial for various data integration and management tasks, such as wrangling and warehousing.

Methods for data transformation include integration, filtering, scrubbing, discretisation, duplicate removal, attribute construction, and normalisation.

Data cleansing, also called data cleaning, identifies and corrects corrupt, incomplete, improperly formatted, or duplicated data within a dataset.

Data Loading into Distributed Systems

Data loading into distributed systems involves transferring and storing data from various sources in a distributed computing environment. It includes extraction, transformation, partitioning, and data loading for efficient processing and storage on interconnected nodes.

Data Pipelines and Workflow Orchestration

Data pipelines and workflow orchestration involve designing and managing interconnected data processing steps to move data smoothly from source to destination. Workflow orchestration tools schedule and execute these pipelines efficiently, ensuring seamless data flow throughout the entire process.

Big Data Analytics and Insights

Batch Processing vs. Real-Time Processing

Batch Data Processing Real-Time Data Processing
No specific response time Predictable Response Time
Completion time depends on system speed and data volume Output provided accurately and timely
Collects all data before processing Simple and efficient procedure
Data processing involves multiple stages Two main processing stages: input to output

In data analytics courses, real-time data processing is favoured over batch processing for its predictable response time, accurate outputs, and efficient procedure.

MapReduce Paradigm

The MapReduce paradigm processes extensive data sets massively parallelly. It aims to simplify data analysis and transformation, freeing developers to focus on algorithms rather than data management. The model facilitates the straightforward implementation of data-parallel algorithms.

In the MapReduce model, two phases, namely map and reduce, are executed through functions specified by programmers. These functions work with key/value pairs as input and output. Like commercial transactions, keys and values can be simple or complex data types.

Data Analysis with Apache Spark

Data analysis with Apache Spark involves using the distributed computing framework to process large-scale datasets. It includes data ingestion, transformation, and analysis using Spark’s APIs.

Spark’s in-memory processing and parallel computing capabilities make it efficient for various analyses such as machine learning and real-time stream processing.

Data Exploration and Visualisation

Data exploration involves understanding dataset characteristics through summary statistics and visualisations like histograms and scatter plots.

Data visualisation presents data visually using charts and graphs, aiding in data comprehension and effectively communicating insights.

Utilising Big Data for Machine Learning and Predictive Analytics

Big Data enhances machine learning and predictive analytics by providing extensive, diverse datasets for more accurate models and deeper insights.

Large-Scale Data for Model Training

Big Data enables training machine learning models on vast datasets, improving model performance and generalisation.

Scalable Machine Learning Algorithms

Machine learning algorithms for scalability handle Big Data efficiently, allowing faster and parallelised computations.

Real-Time Predictions with Big Data

Big Data technologies enable real-time predictions, allowing immediate responses and decision-making based on streaming data.

Personalisation and Recommendation Systems

Big Data supports personalised user experiences and recommendation systems by analysing vast amounts of data to provide tailored suggestions and content.

Big Data in Natural Language Processing (NLP) and Text Analytics

Big Data enhances NLP and text analytics by handling large volumes of textual data and enabling more comprehensive language processing.

Handling Large Textual Data

Big Data technologies manage large textual datasets efficiently, ensuring scalability and high-performance processing.

Distributed Text Processing Techniques

Distributed computing techniques process text data across multiple nodes, enabling parallel processing and faster analysis.

Sentiment Analysis at Scale

Big Data enables sentiment analysis on vast amounts of text data, providing insights into public opinion and customer feedback.

Topic Modeling and Text Clustering

Big Data facilitates topic modelling and clustering text data, enabling the discovery of hidden patterns and categorising documents based on their content.

Big Data for Time Series Analysis and Forecasting

Big Data plays a crucial role in time series analysis and forecasting by handling vast volumes of time-stamped data. Time series data represents observations recorded over time, such as stock prices, sensor readings, website traffic, and weather data.

Big Data technologies enable efficient storage, processing, and analysis of time series data at scale.

Time Series Data in Distributed Systems

In distributed systems, time series data is stored and managed across multiple nodes or servers rather than centralised on a single machine. This approach efficiently handles large-scale time-stamped data, providing scalability and fault tolerance.

Distributed Time Series Analysis Techniques

Distributed time series analysis techniques involve parallel processing capabilities in distributed systems to analyse time series data concurrently. It allows for faster and more comprehensive analysis of time-stamped data, including tasks like trend detection, seasonality identification, and anomaly detection.

Real-Time Forecasting with Big Data

Big Data technologies enable real-time forecasting by processing streaming time series data as it arrives. It facilitates immediate predictions and insights, allowing businesses to quickly respond to changing trends and make real-time data-driven decisions.

Big Data and Business Intelligence (BI)

Distributed BI Platforms and Tools

Distributed BI platforms and tools are designed to operate on distributed computing infrastructures, enabling efficient processing and analysis of large-scale datasets.

These platforms leverage distributed processing frameworks like Apache Spark to handle big data workloads and support real-time analytics.

Big Data Visualisation

Big Data visualisation focuses on representing large and complex datasets in a visually appealing and understandable manner. Visualisation tools like Tableau, Power BI, and D3.js enable businesses to explore and present insights from massive datasets.

Dashboards and Real-Time Reporting

Dashboards and real-time reporting provide dynamic, interactive data views, allowing users to monitor critical metrics and KPIs in real-time.

Data Security and Privacy in Distributed Systems

Data security and privacy in distributed systems require encryption, access control, data masking, and monitoring. Firewalls, network security, and secure data exchange protocols protect data in transit.

Encryption and Data Protection

Encryption transforms sensitive data into unreadable ciphertext, safeguarding access with decryption keys. This vital layer protects against unauthorised entry, ensuring data confidentiality and integrity during transit and storage.

Role-Based Access Control (RBAC)

RBAC is an access control system that links users to defined roles. Each role has specific permissions, restricting data access and actions based on users’ assigned roles.

Data Anonymisation Techniques

Data anonymisation involves modifying or removing personally identifiable information (PII) from datasets to protect individuals’ privacy. Anonymisation is crucial for ensuring compliance with data protection regulations and safeguarding user privacy.

GDPR Compliance in Big Data Environments

GDPR Compliance in Big Data Environments is crucial to avoid penalties for accidental data disclosure. Businesses must adopt methods to identify privacy threats during data manipulation, ensuring data protection and building trust.

GDPR compliances include:

  • Obtaining consent.
  • Implementing robust data protection measures.
  • Enabling individuals’ rights, such as data access and erasure.

Cloud Computing and Big Data

Cloud computing and Big Data are closely linked, as the cloud offers essential infrastructure and resources for managing vast datasets. With flexibility and cost-effectiveness, cloud platforms excel at handling the demanding needs of Big Data workloads.

Cloud-Based Big Data Solutions

Numerous sectors, such as banking, healthcare, media, entertainment, education, and manufacturing, have achieved impressive outcomes with their big data migration to the cloud.

Cloud-powered big data solutions provide scalability, cost-effectiveness, data agility, flexibility, security, innovation, and resilience, fueling business advancement and achievement.

Cost Benefits of Cloud Infrastructure

Cloud infrastructure offers cost benefits as organisations can pay for resources on demand, allowing them to scale up or down as needed. It eliminates the need for substantial upfront capital expenditures on hardware and data centres.

Cloud Security Considerations

Cloud security is a critical aspect when dealing with sensitive data. Cloud providers implement robust security measures, including data encryption, access controls, and compliance certifications.

Hybrid Cloud Approaches in Data Science and Analytics

Forward-thinking companies adopt a cloud-first approach, prioritising a unified cloud data analytics platform that integrates data lakes, warehouses, and diverse data sources.

Embracing cloud and on-premises solutions in a cohesive ecosystem offers flexibility and maximises data access.

Case Studies and Real-World Applications

Big Data Success Stories in Data Science and Analytics

Netflix: Netflix uses Big Data analytics to analyse user behaviour and preferences, providing recommendations for personalised content. Their recommendation algorithm helps increase user engagement and retention.

Uber: Uber uses Big Data to optimise ride routes, predict demand, and set dynamic pricing. Real-time data analysis enables efficient ride allocation and reduces wait times for customers.

Use Cases for Distributed Computing in Various Industries

Amazon

In 2001, Amazon significantly transitioned from its monolithic architecture to Amazon Web Servers (AWS), establishing itself as a pioneer in adopting microservices.

This strategic move enabled Amazon to embrace a “continuous development” approach, facilitating incremental enhancements to its website’s functionality.

Consequently, new features, which previously required weeks for deployment, were swiftly made available to customers within days or even hours.

SoundCloud

In 2012, SoundCloud shifted to a distributed architecture, empowering teams to build Scala, Clojure, and JRuby apps. This move from a monolithic Rails system allowed the running of numerous services, driving innovation.

The microservices strategy provided autonomy, breaking the backend into focused, decoupled services. Adopting a backend-for-frontend pattern overcame challenges with the microservice API infrastructure.

Lessons Learned and Best Practices

Big Data and Distributed Computing are essential for the processing and analysing of massive datasets. They offer scalability, performance, and real-time capabilities. Embracing modern technologies and understanding data challenges are crucial to success.

Data security, privacy, and hybrid cloud solutions are essential considerations. Successful use cases like Netflix and Uber provide valuable insights for organisations.

Conclusion

Data science and analytics have undergone a paradigm shift as a result of the convergence of Big Data and Distributed Computing. By overcoming traditional limits, these cutting-edge technologies have fundamentally altered how we process and evaluate enormous datasets.

The Postgraduate Programme in Data Science and Analytics at Imarticus Learning is an excellent option for aspiring data professionals looking for a data scientist course with a placement assistance.

Graduates can handle real-world data difficulties thanks to practical experience and industry-focused projects. The data science online course with job assistance offered by Imarticus Learning presents a fantastic chance for a fulfilling and prosperous career in data analytics at a time when the need for qualified data scientists and analysts is on the rise.

Visit Imarticus Learning for more information on your preferred data analyst course!

3 Ways Big Data Can Influence Decision-Making for Organizations!

An enterprise or any organization collects a massive amount of data daily while performing its operations. This data can be in the form of customer information while making purchases, vouchers,s, and bills by manufacturers, viewership on the online portals, etc.

For an upward movement in the market, it is significant that this big data does not lie untreated in the systems of the company instead it should be worked upon and put to good use to increase the efficiency of the company.

To screen and filter the big data, data analysts are hired to convert that data into a useful piece of information. It may be likely to occur to you that how big data influences an organization’s functioning. There are some decisions that are largely based on big data.

Influence of Big Data on Decision Making of an Organization

In the following three ways, big data creates an impact on the decision-making and the overall performance of a company.

  1. Promotional enhancement through real-time data

Whenever you shop from a branded store, you start receiving emails about their offers which sometimes claim that some deals are exclusively for you. Do you ever wonder how they send personalized emails to every customer based on their interests and their shopping histories?

Big Data CareerThese all are some promotional activities which the companies do by making use of big data. Big data influences the decision-making of the promotional activities of a company.

By doing this, customers may feel informed through the brand and it is sometimes the biggest and the most important step towards creating customer loyalty and long-term relationships.

  1. Expanding Operations Without Spending Too Much

To initiate a promotional activity or a campaign to attract customers, some companies spend a hefty amount of money which may or may not turn out to be 100 percent successful. However, by making effective use of big data these expenses can be avoided. If you already know which customer tends to buy within a specific price range, personalized promotions through the internet become easy.

Big Data Career

Moreover, wasteful expenditure can be avoided to a great extent. Real-time data can prove to be beneficial in determining some major issues in a particular product or service.

Companies can appoint data analysts who can screen the real-time data and make necessary changes as and when required.

  1. Speeding the Action

Whenever a company launches any product in the market, it is always hard for the company to anticipate the response it may get. Supposedly, the customers have questions or certain queries about the product, taking some time to answer them might affect the overall image of the company as well as the product.

Big data helps to tackle this problem in real-time. Queries can be handled in seconds than wasting several minutes and replacements can be made in fewer days as compared to the time it used to take earlier. Big data has brought about a paradigm shift in decision making which has made customer dealing and answering queries a much simpler task.

Conclusion

With edge-to-edge competition in the market, it is significant for any organization that it makes effective use of big data in its favor.

Big Data Career

With the proper use of big data, companies can foresee and predict the future market for their products and services as well. The points mentioned above have presented a lucid picture of how important big data has become lately.

Big Data CareerA big data career can prove to be beneficial and is considered among the most demanded career options.

For big data training, you must check out the courses and professional assistance being offered by Imarticus learning.

Big Data Engineer Salary: How Much Can You Earn as a Big Data Engineer?

Who is a Data Engineer?

As businesses across the globe are enthusiastically adapting the data-driven strategies to optimize their decisions, the demand of highly skilled Data Engineers has increased manifold. A skilled person who is able to convert the raw data into a self-explanatory form to analyze the trends by developing requisite algorithms is a Data Engineer.

The entire task of Data Mining, maintaining and extracting trends from different data sets in an organization is completed by a team of Data Engineers. Ultimately, the Data Engineers provide reliable infrastructure to maintain big data.

Skills required to be a Data Engineer

A Data Engineer must have deep understanding of SQL, Extract Transform Load, Apache Hadoop, in depth knowledge of Python, Java, Scala, Kafka, hive, storm and many more.

Big Data EngineerEnterprises now a days prefer the employees with the experience of working on the cloud platforms like Amazon Web Services etc. Sound knowledge of Data warehousing and Data modelling is also given a lot of preference these days.

The required skills and preferences may affect the salary of an Data Engineer by 10%-15%.

A Data Engineer deals in Big Data, the person should be proficient in the documentation skills and must also be good in his/her verbal and Non-verbal communication skills.

How to Become a Data Engineer?

Applied Mathematicians, Engineers, People holding Bachelor’s degree in Computer Sciences or related IT field find it easier to become a Data Engineer. The aspiring candidates then go for a Big Data certification course to have in depth understanding of required technological skills to be a Data Engineer.

Roles and Responsibilities of a Data Engineer

The generic tasks that a Data Engineer has to perform include:

  • Aggregation and Analysis of given data sets
  • Development of Dashboards and reports
  • Development of tools for business professionals
  • Providing improved techniques to access the Big Data

Three main domains in which a Data Engineer works are: Generalist, Pipeline centric, Database-Centric Generalists are the Data Engineers who processes, manages and analyses the data.

Big Data EngineerPipe-line centric Data Engineers work in coherence with Data Scientists to utilize their collected Data. Database-centric Data Engineers manages the Data-flow and database analytics.

Along with the technical skills, a Data Engineers must have some soft skills as well to communicate their analysis. Some of the key responsibilities are:

  • Acquisition of Data
  • To match their development constantly with the business requirements
  • Consistent improvement in the data reliability, efficiency and Data Quality
  • Development of predictive and prescriptive modelling

The key responsibilities vary from organization to organization.

Data Engineer: Employers and Salaries

Some of the top companies where Data Engineers are highly paid are:

  • com Inc
  • Tata Consultancy Services Limited
  • IBM Private Limited
  • General Electric (GE) Co
  • Hewlett-Packard
  • Facebook

Factors affecting Salaries of Data Engineers 

Experience:

Average Experience as a Data Engineer Average Pay-Scale based only on Experience
Entry level ₹400,000 approx.
1-4 years ₹739,916 based on 317 salaries
5-9 years ₹1,227,921 based on 179 salaries
10-19 years ₹1,525,827 based on 49 salaries

Job Location:

The Data Engineers working in the prime locations like Gurgaon (Haryana) earns 27.3% more average salary, in Hyderabad (Andhra Pradesh) 13.7% more average salary, in Bangalore (Karnataka) 12.5% more average salary than in locations across the nation.

The average salary of a Data Engineer in Mumbai, New Delhi and Chennai are relatively lesser than average salary across the nation.

Guide To Using Advanced Analytics And AI In Business Applications!

AI-Possibility to Reality

The widespread advancement in the field of AI helped organizations to manage the employees and customers in a better way.

For example, the chatbots, meant to serve the purpose of handling the customer’s inquiries and complaints are a source of relief for the employees as well as customers who need not to wait for long for the response from a company. To understand the AI in businesses in detail we must familiarize ourselves with the basic terminology related to it.

Artificial Intelligence

AI is a concept which demonstrates the ability of a machine to think and execute the tasks in a smarter way as humans, using much complex logic in a single frame. Human intelligence forms the fundamental basis to facilitate the design of an AI. The different abilities of humans such as perceiving, reasoning, problem-solving, etc. use analytical skills. A machine when trained to use these skills can work with accuracy and no fatigue.

AI Augmentation

The way the human brain is trained using different stimuli, AI is also trained using historic data. To understand in detail, what happens to the historic data, we must understand different analytics from business perspective. Descriptive Analytics (What happened?) (maximum manual intervention), Diagnostic Analytics (Why did it happen?)(Significant manual intervention), Predictive Analytics (What could happen?)(Correcting the mistakes manually), Prescriptive Analytics (What should we do?), Cognitive Analytics (Cause something to happen)(Fully automated)

Moving beyond these analytics, advanced analytics helps to add knowledge and gives a progressive nature to the AI to make decisions in a holistic way.

Big Data

To train the AI to work in a specific field Big data plays very important role. Big Data is described by the 5 V model.

  1. Volume-describes the big size of the data
  2. Velocity-describes the speed at which the data is created, basically the mathematical ratio of quantity and duration of data creation.
  3. Variety-describes the various heads under which data is created
  4. Veracity-describes the accuracy of the data, in other words, it tells if the data is reliable or not.
  5. Value-Transferable nature of data in the useful form

Machine learning and predictive analytics

Technically Machine learning and predictive analytics share similar fundamental structures of complex algorithms with the same objectives of forecasting. The underlying difference between the two is the amount of data involved and human intervention.

Predictive analytics make use of different sets of algorithms to evaluate the viability of the results. It means, because of its probabilistic nature it helps in forecasting the problems along with the prediction of the possible solutions to the problems. One of the applications of Big Data lies in the Fin-tech industry, which helps the organizations to predict if the future bad debt. To get such predictions, it is very important to train the AI with a large amount of data.

On the other hand, in Machine learning, one cannot observe the evolving nature of the data and system adaptations with the new data. ML just focuses on data availability and forecast.

In predictive analytics, human intervention is required to train the AI, but this is not the case of ML.

Methods and techniques for getting the best out of given data

Advanced statistical and Mathematical techniques such as Bayesian theory, Probability distributions, Normal curves, etc. help to extract best out of a given set of data by defining the unique algorithms in coherence with the human expertise and experience. Such algorithms help in the automation of the quality and optimized decision making in business, which in turn results in more focus on profit-making.

What Are the Characteristics of Big Data?

Big data is the next big wave that is shaping the corporate sector today. Big data gives an idea about the size of data but there are various aspects associated with it. It is also driven by various other factors apart from the size of data such as the sources of data, various formats in which it is available, chunking and extraction, etc.

Big data has managed to find space in all sectors of the market – technology, retail, telecommunications or any other broadly recognized field. It makes use of the available data to derive conclusions.

Need for Big Data

Organizations have huge data resources in an unstructured format. Mostly this data is stored in various devices and is never brought to any use. Data can prove to be a mega resource for the growth of any company as it can equip the company with numerous insights thus acting as the steering wheel of the company. Traditional tools such as Excel are not that efficient in extracting information and putting it to any relevant use. Big data comes into the picture here.

When you have a huge amount of data, it needs to be sorted and then classified under various heads so that the important fields can be easily recognized and brought to use. This space is getting bigger with every passing minute as we are becoming more and more data-oriented.

The volume of data is huge. With the increase in the number of internet users, more data and information are coming into circulation and this has given rise to the value data holds today. This data is produced through various channels like search engines, social media networks, business informatics, etc. It makes use of various tools to summarize information.

Learning Big Data and Hadoop can pave a great career path for someone who wants to have a career in data analytics.

Characteristics of Big Data

 The 4 Vs of Big Data characterize big data. Data needs to be classified and organized for better understanding. The 4 Vs of Big Data are:

  1. Volume
  2. Velocity
  3. Variety
  4. Veracity

These characteristics form the essence of Big Data. It gives insights on how the data should be dealt with and how can the insights from that data can be put to good use.

  1. Volume: Volume defines the size of the data which in today’s time is exploding and increasing exponentially. To be precise, this defines the quantity of data available for the extraction of information. Based on the volume of data, various tools are applied for the segregation of information.
  2. Velocity: Velocity refers to the speed in which the data is processed. The speed of data processing plays a very important role in Big data as a lot of data has to be analyzed and insights have to be drawn within a stipulated time frame, thus making the velocity of data an important feature of Big Data.
  3. Variety: Variety refers to the various types of data from which the relevant information has to be extracted. It is important as data collected from different sources are diverse in many aspects. Big Data makes use of various tools to integrate the diversified data and draw insights for the business.
  4. Veracity: Veracity refers to data accuracy and its relevance with the business information we require or the business decision that has to be made. Veracity helps in the identification of relevant information and hence saves a lot of time.

Conclusion

Big Data today has various dimensions and has opened a new world for data harvesting and extraction. With the help of the Big Data Analytics course, one could gain expertise and in-depth insight into the field.

How A Big Data Can Be Used In Retail Banking?


Like in all successful business ventures, the field of banking is no exception. Big Data drives decisions. The successful use of such large-volume data-based applications already exists and is hugely popular too. Retail banks are big data-driven with nearly all its processes being already supported by such data to deliver business value to their customers.

Their advantages and competitive value is data fueled and depends on the insights provided by the most effective use of such data. It is surprising that in spite of having had access to such large databases for over a decade now, Retail Banking is yet to exploit the numerous benefits uses of big data in retail-banking can bring in.

A data analyst Retail Bankingintern or freshman makes a handsome payout package and the range of the salary depends on the skill-set, certification, and experience. The skills required can vary depending on the employer and industry. As they climb the ladder the promotions depend on continuous skill up-gradation, managerial and leadership skills. Hence, soft-skills and personality development are also important attributes.

Big Data transformation benefits:

With the move by customers to digital transactions many banks did invest substantial efforts in dedicated teams, advanced analytics, appointing data officers, and upgrading their infrastructure. The early adapters are the survivors and have evolved more competitive as new-age banks offering customer-need based services based on Big Data insights. There are many areas where banks are yet to ramp up their use of big data to reap benefits according to the Boston Consulting Group’s reports.

The three main abilities that are leading transformations are: 

  • Data: Multi-source multi-system huge volumes of data petabytes being available which include high definitions of detail and features.
  • Models and ML: The models are now more insightful thanks to the evolution of better ML software which enables decisions and predictions that are data-driven.
  • Software technology: The hardware-software clustering technique in software like Hadoop has proven to be big-data centric and allowing use of complex databases non-structured and structured in a cost-effective manner.

There are at least six areas in Retail Banking which focused and coordinated big-data programs can lead to substantial value for banks in the form of increased revenues and bigger profits.

IMPROVING CURRENT PRACTICES WITH POINT ANALYTICS: Applications of big data analytics for individual needs can be simple and yet powerful with the point analytics method.

TRANSFORMING CORE PROCESSES WITH PLATFORM ANALYTICS: Big data and point analytics can be used to improve customer risk assessment and for effectively tapping the marketing potential measures analyzed.

TRANSFORMING CORE PROCESSES WITH PLATFORM ANALYTICS: Big data applications can transform the collection process with step-by-step optimization to bring in a 40 percent savings in terms of writing off bad debts, with effective use of mining outdated customer information, their predispositions, and newer behavioral models.

BOOSTING IT PERFORMANCE: Big-data IT technologies should have need-based linear scaling to reduce costs. Data-intensive models, mining omnichannel customer experience, balancing data warehouse workloads and effective leveraging of data can help.

CREATING NEW REVENUE STREAMS: 

A European bank used new architecture, hybrid data-warehousing combining banking tech and big-data by clustering the Hadoop commodity servers. Budget savings were 30 percent with all functionalities!

GETTING THE MOST FROM BIG DATA: 

This involves these basic steps of infra and people management detailed below: 

Assess the present situation: Banks needs to bring in newer innovative applications as a differentiator from the competition where all organizational levels collaborate to contribute to the use and needs-based model.

Be Agile: The agile requirements of communication, collaboration, and contribution across all processes will help big data transform them.

Critical capability cultivation: If not implemented the cultivation of critical capabilities can hinder the big data transformation of processes. Limiting the capability to the vision essentials is recommended in all domains of big data capabilities.

The three domains of Big data capabilities that Retail Banking should question itself about are: 

  • The usage of data
  • The engine driving the data
  • The ecosystem of the data

Retail banks should necessarily explore and act on these domains effectively by using smaller discrete programs to take their strategy to execution.

Conclusion:

BIG business for all banks comes from effectively exploring Big Data. Such large institutions who cash in early will stay ahead of the other banks by adapting technology into the very fabric of their banks for its many benefits.

The future holds great promise for development in the field of Retail Banking and to make a high-paid scope-filled career even without experience. Start your Big Data Analytics Course at Imarticus Learning and take advantage of their assured placements and certification. All the best with your career in big data and retail banking!

For more details, you can also contact us through the Live Chat Support system or can even visit one of our training centers based in – Mumbai, Thane, Pune, Chennai, Banglore, Hyderabad, Delhi, Gurgaon, and Ahmedabad.

10 Most Popular Analytics Tools In Business

The increasing importance and demand for data analytics have opened up new potential in the market. Each year, new tools and programming languages are being launched aimed at easing up the process of analyzing and visualizing the data.

While many such advanced business intelligence tools come up in paid versions, there are great free and open-source data analytics courses and tools available in the market too. Read on to find out about the 10 best and most popular data analytics tool for business right now.

1. R Programming
R is the most popular programming language cum tool widely used by experts for the purpose of data analytics and visualization. The tool is free and open-source in nature and allows the users to alter its code set for clearing bugs and updating the software on their own.
2. PYTHON
Python is an open-source and free OOP based scripting language popular in the data analytics market since the start of the 90s. Python supports both structured and functional programming methods and is very easy to learn and operate upon. Python is expert in handling text-based data.
3. Tableau Public
Tableau Public is another free software and business intelligence tool which is capable of connecting all kinds of data source be it Excel-based data, Data Warehouse or web-based data. Tableau creates maps, graphs and dashboards with real-time updates presenting on the web. The data can be shared over social networks too.
4. SAS
Sas is a leading analytics tool and programming language specifically developed for the purpose of interacting with and manipulating data by the SAS institute in 1966 with updates presented during the 80s and 90s. Data present in SAS can be accessed, analyzed and managed easily from any sources and is capable of predicting behaviors of customers and prospects along with recommending optimized communication models.
5. Excel
One of the most popular and underrated data analytics and visualization tool in the market, Excel was developed by Microsoft as part of their MS Office and is one of the most widely used tools in the industry. All kinds of data analytics tools still require Excel to work in some kind of way and it is very easy to be learnt and operated.
6. KNIME
KNIME is a leading open source and integrated analytics tool developed by a team of software engineers from the University of Konstanz in January 2004. KNIME allows the users to analyze and model the data through visual programming integrating components of data mining and machine learning via its modular data pipelining concept.
7. Apache Spark
Developed in 2006 by the Berkeley’s AMP Lab of University of California, Apache is a fast large-scale data processing, analysis, and visualization tool capable of executing applications around 100 times faster in memory and 10 times faster on disk. It is popular for data pipelining and machine learning models development allowing it to double up as business intelligence tool.
8. RapidMiner
RapidMiner is another powerful data analytics tool which can double up as business intelligence tool owing to its capability to perform predictive analysis, behavioral analysis, data mining, etc. The tool can incorporate with any other data source types such as Excel, Microsoft SQL, ACCESS, Oracle, Ingres, IBM SPSS, Dbase, etc.
9. Google Analytics
A freemium and widely recommended product for data analytics, Google Analytics is a perfect offering from Google for the Small and Medium-scale enterprises who don’t possess the technical knowledge or the means to gather that knowledge in the present course.
10. Splunk
Splunk is an analytics tool mostly directed to searching and analyzing machine-generated data. The tool pulls up all text-based log data and provides the means to search through it for gathering any relevant or required data.

What Are The Benefits Of Bringing Big Data Analytics Education?

Education, human behavior and interpersonal interactions have always held our interest as topics for research and discussion. Such data analysis can draw out many insights that can be beneficially used to improve the ways we work. learn and analyze issues around us. Did you know that the big data industry is projected to touch a total value of 28 million USD very soon? No wonder the educational field is looking to exploit the many benefits of a big data course in the educational field and analyzing the results to tweak the outcomes.

The very first step in this process is to set up the functional database and its analysis process. In the field of education, this would imply building a community website. Why? Data analyzed so far shows that if students needed information 93 percent of the time they looked online for it.

The popularity of libraries of information available by doing a simple Google search or Googling as students call it is the most popular method for not just students but parents looking for educational institutions for their wards as well! It is a given that online presence helps prospective students and their parents find you.

But, can we also use the digital platform to educate students?  Here are at least three ways to benefit from big data analytics and exploiting a big data course of benefits for your educational institution.

1. Assessing student performance:

Improving student performance and assessing their performances can be efficiently leveraged by big data and its analytics. Individualized learning modules can help find knowledge gaps and personalize the learning materials to fill in the gaps. By so adjusting the learning rate no student in a class is way ahead or too far back on the learning curve. Since learning styles, rates and methods may vary over each student, adaptive learning scores by understanding and identifying the gap in learning and taking corrective action before it is too late.

A differentiated style of learning deals with the most effective style to help the student learn. Adaptive learning curates the learning exercises matching them to the student’s needs and knowledge gaps. Competency-based AI and Big Data Analytics Course-based tests aid the students to gauge their learning levels and progress from thereon.

Using all these three types of learning AI can test how well the students can adapt their learning to applications of it and thus promote the progress of students based on individual interests. Traditional methods like exams, project work and assignments and exams can be used as data trails to help monitor learning activities and performances. The behavioral analysis attained can help provide personalized feedback to each student.

2. Personalizing educational programs:

Big data can help in customizing and personalizing learning materials and individualized programs for students using both on and offline resources. Blended experiences improve performances, generate more learning interest and help improve the performances of students. Students can learn at their own pace and style and even discover areas where they excel at applying their learning to applications. The classroom can effectively be turned into a nursery for budding professionals, entrepreneurs, gamers and businessmen who are well-initiated in exploiting benefits offered by skilling themselves in a big data course.

3. Learn from the results and improve the dropout rates:

Big data analytics can help us learn and predict the lacunae in learning and thus prevent dropouts. Corrective measures can easily be applied if unusual behavioral patterns are caught early. Personalization of these measures through suggestions from big data analytics can help target the source of the problem and resolve the issue or gaps in learning. Big data analytics’ behavioral analysis can also help in career counseling, providing information on various programs and courses at various institutions so students can choose their careers wisely.

Parting notes:
The class sizes keep increasing with compulsory education and teachers are often facing many challenges in giving attention and help to the large numbers of students. A big challenge like this has been simplified by incorporating computer programs that allow each student to follow his own pace and learning curve. The technological advancements in the last decade and especially in education has seen many applications that are data-driven and can be processed for use as learning materials to base your future decisions on.

Rather than concentrate on just building a good educational website from scratch one can use simple website solutions from online builders. The time saved is best used on implementing processes for reporting and better analysis. Do you want to learn how to use Big Data analytics in education? Reach out and do a big data course at the Imarticus Learning Institute to emerge career-ready.

5 Ways to Understand the Importance of Big Data

Modern times handle Big-data and the amount of data just keeps growing by the moment. Today enterprises not only use the data generated by them but also cull the data from internet services, audio clips, video s, social posts, blogs and other sources.

Understanding Importance Of Big Data

Big data analytics deals with data primarily and the predictions or forecasts from analyzing databases that help with informed decision making in all processes related to business. All of us generate data and the volume of data has now become incredibly large. Keeping pace with the generation of data has been the need for cutting edge tools to clean, format, group, store and draw inferences from databases not only our own but across verticals and fields. Some of the interesting fields spawned and co-existing with the use of big data analytics are in machine learning, artificial intelligence, virtual reality, and robotics.

In modern times the value of Big Data, its forecasts and insights are invaluable to companies. However, it is not easy to clean the data, match and format the various types of data, prepare the data to be available in an easily understandable form and then use the data for analytics. It requires discipline, patience, lots of practice and asking the right question to the right database to be able to produce those predictive insights.

Importance of Big Data is so encompassing in a world ruled and constantly generating large amounts of data every moment that analysts, engineers, scientists and others making a career in the Big Data field is sure to have an unending scope. The more the data, the better the evolving technologies get and so also follows the demand for personnel who can understand and handle it.

Yet, the 4 V parameters can be used to understand Big data. They are
• Variety – This defines the type of data source and whether it is generated by a machine or people.
• Volume – This parameter has moved from Gigabytes to terra bytes and beyond and denotes the amount of data generated. The sources have increased as also the speeds of data generation. The definition of volume should be very large Big Big Data many times over by now.
• Velocity – This parameter defines the generational speed of data. This grows by the moment and entails huge volumes.
• Veracity – This parameter defines the data quality and at times is out of the analyst’s control.
Technology has also evolved and has taught us that it is not sufficient to just gather data but use it effectively to improve organizational performance. Big-Data has immense applications across all industrial verticals, in personal and industrial scenarios and has successfully advanced not just organizational productivity but the economy as a whole. This development in data and its technology-enabled predictive analytics to make use of forecasts and gainful insights to improve the various processes and applications.

The Three Stages of Data

All data may not be in the same format and may be in different formats and made available from various sources. Labelled data is very different from real-time unlabeled data. Thus all data passes through three stages which are performed as loops and repeated many times in a fraction of a second.
• Managing the data: Here the data is extracted from various sources and the relevant data is extracted from it.
• Analyze and perform data analytics on it: In this stage, ML algorithms are applied and data processed to gain foresight, insights and make predictions.
• Make the correct decision with data: The all-important stage of applying the data to a relevant decision-making process is executed to provide the desired outcome. When the results are not the desired outcome the process is automatically repeated to narrow the differences between output and the desired result.
With traditional tools, one can work with relatively smaller databases that are less than a terabyte size-wise. However, modern data tends to be unstructured and comes in the form of videos, audio clips, blog posts, reviews, and more which are challenging to clean, organize and include huge volumes of data. The tools and techniques involved in the capture, storage and cleaning of data need necessarily to be updated. One also would need faster software that can compare databases across platforms, operating systems, programming languages and such complexities of technology.

The Five Organizational Benefits of Big Data

Big Data brings in great process benefits to the enterprise. The top five are

  •  Understand market trends: Using big data, enterprises are enabled to forecast market trends, predict customer preferences, evaluate product effectiveness, customer preferences, and gain foresight into customer behaviour. The insights can help understand purchasing patterns, when to and which product to launch and suggest to clients product preferences based on buying patterns. Such prior information helps bring in effective planning, management and leverages the Big Data analytics to fend off competition.
  •  Understand customer needs better: Through effective analysis of big-data the company can plan better for customer satisfaction and thus make alterations needed to ensure loyalty and customer trust. Better customer experience definitely impacts growth. Complaint resolution, 24×7 customer service, interactive websites and consistent gathering of feedback from the customer are some of the new measures that have made big-data analytics very popular and helpful to companies.
  • Work on bettering company reputation: Sentiments and their analysis can help correct false rumours, better service customer needs and maintain company image through online presence which eventually helps the company reputation using Big Data tools that can analyze emotions both negative and positive.
  • Promotes cost-saving measures: Though the initial costs of deploying Big Data analytics are high, the returns and gainful insights more than pay for themselves. This also enables constant monitoring, better risk-management and the IT infrastructure personnel can be freed up. This translates into reduced personnel required. Besides this, the tools in Big Data can be used to store data more effectively. Thus the costs are outweighed by the savings.
  •  Makes data available: Modern tools in Big Data can in actual-time present required portions of data anytime in a structured and easily readable format.

If you are keen to take up data analytics as a career then doing Big data training with a reputed institute like Imarticus is certainly advantageous to you. The courses augment your knowledge, bring you up to speed with the latest tools and technologies and even include real-time, live projects that enable the transformation of theory into confidence-based practical applications of learning in the data analytics field. Why wait?

Top 7 Reasons to Convince You To Take on that Data Analytics Job


It’s more than just a buzzword, it’s a revolution– data analytics is here and here to stay. For four years in a row, data analytics was ranked the best job in the U.S. alone by Glassdoor in 2019. The data fever is catching on in other parts of the world too, as global economies become more interdependent and related.

More and more companies and industries are embracing data analytics, not least because it’s a science that delivers valuable insights applicable across all plans including business and marketing.

If you’re still hesitating about whether to go for a career in data analytics, allow these top 7 reasons to convince you:

#1: It’s in demand

Data analytics is one of the most in-demand jobs in the world today. This is because all industries need data-driven insights to make even changes, be it to pick a marketing option during A/B testing or rolling out new products. Data analytics is a high-skills, high-stakes job, which is why companies are ready to hire those willing to think creatively and derive data-based solutions to business problems.

#2: It’s easy to start

Educational institutions and course providers have sat up and taken notice of the demand for data analysts, leading them to introduce related training courses. Regardless of whether you’re a fresher or a professional in the tech field, data analytics training can help you start from scratch and build a portfolio of projects to showcase your skills These courses also provide tutorials in essential data analytics software such as Hadoop, Sisense and IBM Watson.

#3: There are plenty of job roles

Within the data analytics field, there are job roles that span academic divisions and aren’t restricted to engineering or software alone. Data scientists, systems analysts and data engineers will benefit from a background in the aforementioned academic fields. However, statisticians and digital marketing executives can look into roles such as quantitative analysts, data analytics consultants and digital marketing managers to put their skills to good use.

#4: The pay is good

The average salary in the data analytics field is US$122,000– a testament to how in-demand the profession is and how in dire need companies are of skilled employees. The figures vary depending on the role and job description but suffice to say that the pay is often much better than other technical jobs that people still seem to hover to by default. It’s also dependent on what industry you will work for, in what capacity and towards which goals.

#5: Growth opportunities abound

Technology is a dynamic field and with new changes come the chance to upskill, pick up new software and contribute to futuristic projects. Data analytics professionals can find themselves growing through roles and projects, oftentimes being tasked to lead a team or be the sole owner of a large-scale project.

#6: Industries are interwoven

With other tech fields, you might be restricted in your tasks or limited to a company. In data analytics, however, you get to pick and choose the fields you want, whether pure tech or even retail. Data analytics is in use across most industries so, once you find your niche, you’re ready to start dabbling in the industry of your choice.

#7: Influences decision-making

If you’ve ever wanted to be part of the larger organizational or business structure and contribute positively, chances are data analytics might be the niche for you. The insights that emerge from analyses of data can power strategies and create new business plans. This way, your contribution leads to progress on an organizational scale and your work can make or break a business.

Data analytics gives you the opportunity to become a more active stakeholder and contributor to any business regardless of the industry, so take the leap today.