Business analytics lets us transform raw data into actionable insights, driving informed decision-making across all levels of an organisation. While often confused with Business Intelligence (BI) and data analytics, business analytics takes things a step further.
BI focuses on historical data visualisation and reporting, while data analytics encompasses a broader range of techniques for analysing data. The process of business analytics, however, leverages these insights to answer specific business questions and solve real-world problems. Let us learn about the process of business analytics in detail.
The Growing Importance of Business Analytics in Today’s World
In today’s data-rich world, every business decision can be enhanced by business analytics. From optimising marketing campaigns to streamlining operations and managing risks, business analytics empowers businesses to gain a competitive edge and thrive in a dynamic marketplace.
For instance, think of a retail company struggling with declining sales. Traditional methods might involve hunches and guesswork. The process of business analytics, however, empowers them to analyse customer purchase history, identify buying trends, and optimise product offerings. They might discover a hidden demand for a specific product category they were not previously catering to. By leveraging the process of business analytics, they can make data-driven decisions to adjust inventory, personalise marketing campaigns, and ultimately boost sales.
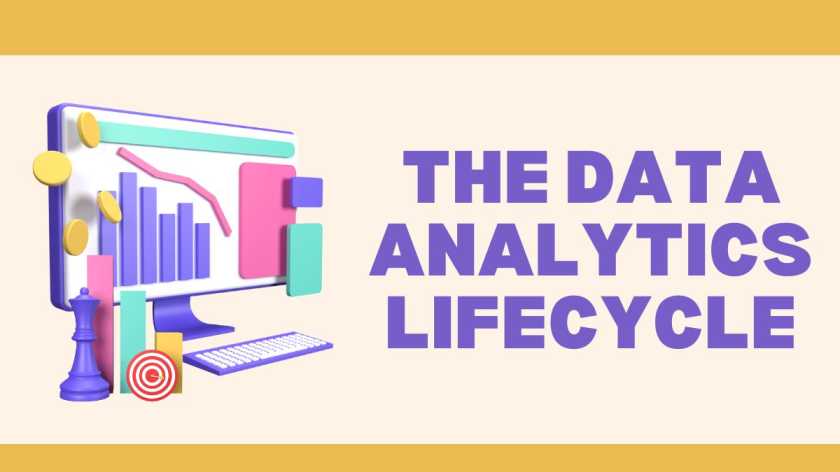
The Process of Business Analytics in Detail
The business analytics life cycle is a structured approach that ensures businesses extract maximum value from their data. Here is a breakdown of the key stages:
Stage 1: Defining Business Needs and Goals
This first stage of the business analytics life cycle sets the foundation for your business analytics journey. Here, you identify the specific challenges or opportunities you are trying to address. Are you looking to improve customer retention, optimise marketing campaigns, or streamline internal processes? Clearly defined goals ensure your business analytics initiatives are aligned with your overall business strategy.
Stage 2: Data Collection and Exploration
Data is the fuel for business analytics. This stage involves identifying relevant data sources, both internal (sales figures, customer data) and external (industry reports, market trends). Techniques like data mining and web scraping can be used to gather the necessary information. However, data quality is paramount. Techniques for cleaning and preparing data, such as handling missing values and removing duplicates, ensure the accuracy of your analysis.
Stage 3: Data Analysis and Modeling
Now it is time to unlock the secrets hidden within your data. This stage of the business analytics life cycle involves applying various data analysis techniques. Descriptive analytics helps you understand what happened (e.g., average customer lifetime value). Predictive analytics goes a step further, using statistical models to forecast future trends (e.g., predicting customer churn). Prescriptive analytics takes it to the next level, suggesting optimal actions on the data (e.g., recommending targeted marketing campaigns to retain at-risk customers).
Common statistical methods like correlation analysis and regression modelling are used as core data analytics steps in business analytics.
Stage 4: Data Visualisation and Communication
Data can be overwhelming. This stage focuses on transforming complex data insights into clear and concise visualisations. Charts, graphs, and interactive dashboards tailored for your audience (technical or non-technical) are key tools for effective communication. Remember, a well-designed visualisation can speak a thousand words, enabling stakeholders to easily grasp the story your data tells.
Stage 5: Decision-Making and Outcome Measurement
The ultimate goal of business analytics is to translate insights into actionable decisions. This stage of the business analytics life cycle involves leveraging the knowledge gained from data analysis to make informed choices that drive business growth. It is also crucial to establish metrics to track the effectiveness of your business analytics initiatives. Did your data-driven decision to personalise marketing campaigns lead to an increase in conversions? Measuring outcomes allows you to continuously refine your business analytics approach and maximise its impact.
If you wish to become an expert in the process of business analytics, you can enrol in the postgraduate business analytics course by Imarticus Learning and XLRI to become an expert in this field.
Advanced business analytics Techniques in the Process of Business Analytics
The core business analytics techniques are a powerful foundation, but the real magic happens when you delve deeper. Here are some cutting-edge approaches that unlock even greater potential from your data:
Graph Analytics
Think of a complex web of connections, like social media interactions or financial transactions. Graph analytics allows you to analyse these relationships within intricate data networks. It is perfect for tasks like identifying influential users in social media campaigns, detecting fraudulent activity in financial systems, or understanding how different departments within a company collaborate.
Natural Language Processing (NLP)
The world is awash with unstructured text data such as customer reviews, social media posts and emails. NLP empowers you to extract valuable insights from this goldmine of information. By using advanced algorithms, NLP can analyse sentiment (positive, negative, neutral opinions), identify key topics, and even generate summaries of large text datasets. Imagine gaining a deeper understanding of customer satisfaction through social media analysis or uncovering emerging market trends from online news articles.
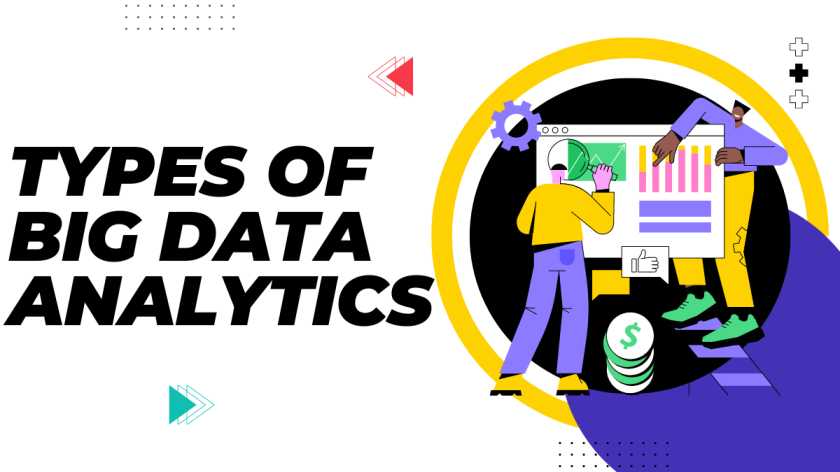
Big Data and AI
The ever-growing volume, variety, and velocity of data, known as big data, requires advanced tools for analysis. Here is where big data analytics and Artificial Intelligence (AI) come into play. Big data analytics helps store, process, and manage massive datasets, while AI techniques like machine learning leverage these datasets to identify patterns and make predictions. This powerful combination fuels applications like personalised product recommendations on past purchase history or dynamic pricing strategies that adjust to real-time market conditions.
These are just a few examples. Emerging techniques like sentiment analysis, which gauges the emotional tone of text data, and time series forecasting, which helps predict future trends on historical patterns, further expand the business analytics toolkit. By embracing these advanced approaches, businesses unlock deeper insights, solve complex problems, and gain a significant competitive edge.
Choosing the Right Business Analytics Tool for the Job
With a vast array of business analytics techniques available, selecting the right tool is crucial for maximising your data’s potential. Here are some key factors to consider:
- Business Problem: Are you trying to understand historical sales data (descriptive analytics) or predict future customer churn (predictive analytics)? The problem you are trying to solve will guide your choice of technique.
- Data Type: Not all data is created equal. Structured data (like sales figures) requires different tools compared to unstructured text data (like customer reviews) which might benefit from NLP. Additionally, real-time data streams necessitate tools designed for continuous analysis.
- Available Resources: Consider your computational power, technical expertise within your team, and budget constraints. Some advanced techniques require specialised software and significant processing power, while others might be accessible through user-friendly cloud-business platforms.
Here is a simplified framework to get you started:
- Define Your Business Problem and Data Type.
- Identify Techniques Aligned with Your Needs (descriptive, predictive, etc.)
- Evaluate Available Resources (skills, budget, software).
- Choose the Tool that Best Fits Your Requirements.
Remember, there is no one-size-fits-all solution. By understanding these factors and utilising this framework, you can select the business analytics tool that unlocks the most valuable insights from your data.
Wrapping Up
Remember, the key to unlocking the true potential of business analytics lies in selecting the right technique for the job, considering your business problem, data type, and available resources. By leveraging this diverse toolkit, you can transform raw data into actionable intelligence that fuels informed decision-making across all levels of your organisation.
Do not be afraid to experiment. Explore different business analytics techniques, embrace emerging trends, and empower your teams to harness the power of data. The potential for innovation and growth through business analytics is limitless. So, start your data-driven journey today and unlock the hidden potential within your organisation’s most valuable asset, its data.
Enrol in the Postgraduate Certificate in Business Analytics offered by Imarticus in collaboration with XLRI to become an expert in the process of business analytics. This business analytics course will teach you everything you need to know to utilise data for high-level business problems and strategic decision-making.
Frequently Asked Questions
- What is the difference between business analytics, BI, and data analytics?
They are all data-focused disciplines, but with nuances:
- Business Analytics: Uses data to answer specific business questions and solve real-world problems. It goes beyond reporting (BI) and incorporates analysis and modelling to make data-driven decisions.
- Business Intelligence (BI): Focuses on historical data visualisation and reporting, providing insights into past performance.
- Data analytics: A broader umbrella term encompassing various techniques to analyse data, including those used in business analytics.
- Why is data quality so important in business analytics?
Imagine building a house on a shaky foundation. Inaccurate or incomplete data can lead to misleading results and poor decision-making. Business analytics relies on clean, high-quality data to ensure the insights it generates are reliable and actionable.
- What are some cool, advanced business analytics techniques?
The world of business analytics is constantly evolving. Here are a few exciting examples:
- Graph Analytics: Untangles complex data networks, useful for tasks such as fraud detection or understanding customer relationships.
- Natural Language Processing (NLP): Extracts insights from text data like customer reviews or social media posts, helping you understand customer sentiment and trends.
- Big Data and AI: Analyse massive datasets and leverage machine learning to make predictions and personalise experiences (e.g., product recommendations).
- How can I get started with business analytics in my business?
Start by defining your business goals and identifying the challenges you want to address. Then, explore beginner-friendly business analytics techniques and tools. There are many online resources and courses available to equip you with the foundational knowledge. Do not be afraid to experiment and learn from the data you have.