Top 10 Advanced Excel Functions Every Analyst Should Know

If you have met any financial analyst, you might have heard them either swear by Excel or tell you how much time they spend on that software. Excel has evolved itself to be the go-to tool for analysts as it’s one of the best ones out there to handle large data sets, perform calculations (however complex they might be) and to even help with data visualisation. But many of us Excel novices may not think beyond the simple SUM or AVERAGE functions, Excel, however, is much more powerful than that. It can offer a whole range of advanced functions so that you can get deep insights and have lower errors.

You might be someone who just knows the basic Excel functions but are also aware of how powerful Excel is and the advance functions of Excel. 

If you want to get a deep dive into Excel skills, a financial analysis course could put you on the right track. But for now, let’s take a look at the top 10 advance functions of Excel.

Watch:  Data Scientist vs Data Analyst – Which Is Right For You? (2025) I Imarticus Learning

1. VLOOKUP and HLOOKUP

Let’s say you want to find a corresponding value in another column and you are dealing with a large dataset, what do you do? You can try to go for the VLOOKUP function. The function helps you look at a value of a vertical column and return a corresponding value from another column. Similarly, HLOOKUP works horizontally, looking through rows instead of columns.

These advanced excel functions will really help out when you are working on datasets. Here’s how VLOOKUP can be implemented:

VLOOKUP(lookup_value, table_array, col_index_num, [range_lookup])

2. INDEX and MATCH

VLOOKUP is useful, but it has limitations. For example, you will be only able to search the first column. In such a situation, INDEX and MATCH, can help, which, in combination offer more flexibility.

  • INDEX provides the cell value from a specific row and column.
  • MATCH locates the value’s position in a row or column.

Here’s how to use them together:

INDEX(array, MATCH(lookup_value, lookup_array, 0))

3. SUMIFS and COUNTIFS

Let’s say you don’t want a total sum, but a sum or count value based on certain conditions, In such a situation, SUMIFS and COUNTIFS help a lot. SUMIF and COUNTIF functions can aid you by setting up multiple conditions to refine your analysis.

Here’s the SUMIFS formula:

SUMIFS(sum_range, criteria_range1, criteria1, [criteria_range2, criteria2], …)

4. IF with AND / OR

The IF function is quite a popular one is excel, but if you combine it with AND or OR, it becomes more powerful and can now handle multiple conditions.

Here’s a formula using IF clubbed with AND:

=IF(AND(C2>=C4,C2<=C5),C6,C7)

This checks if the value in C2 is between the values in C4 and C5. If true, it returns C6; otherwise, it returns C7.

5. OFFSET with AVERAGE or SUM

The OFFSET function is another basic function, but when in combination, this becomes one of the advance functions in Excel. When you combine this function with advanced SUM function in Excel or the AVERAGE function, it lets you return a range of cells that’s a specified number of rows and columns.

Here’s the formula:

=SUM(B4:OFFSET(B4,0,E2-1))

By adjusting the value in E2, the number of cells included in the sum changes automatically.

6. CHOOSE

The CHOOSE function is a masterful decision-making tool  in financial models. The function lets you choose a value from several options. For example, let’s say you have  different revenue growth assumptions for the next year, then when you use the function CHOOSE you return the value of the selected assumption.

Here’s the formula:

=CHOOSE(choice, option1, option2, option3)


7. XNPV and XIRR

Since we started with how analysts still like Excel, we should know one of the crucial functions that they use, which is XNPV and XIRR. These functions help working with cash flow data and are largely used in fields like investment banking, FP&A, or equity research. When you are using these functions, you can apply specific dates to each individual cash flow, and as a result address any issue where cash flows don’t always occur at equal time intervals.

With XNPV and XIRR, you are also capable of calculating the present value or internal rate of return for irregular cash flows. This wouldn’t be possible if you are also sticking to using Excel’s basic functions.

Here’s the formula for XNPV:

=XNPV(discount_rate, cash_flows, dates)

8. SUMIF and COUNTIF

While you have read about SUMIFs, there is also another tool for a more specific role – which is the SUMIF function. If you want to add cells using a specific condition, then this function would be your go-to one. On the other hand, let’s say, you don’t want the sum but rather are looking to count the number of cells but based on a specific condition. In such a situation, COUNTIF should be the function to go for.. These functions are helpful for quickly summing or counting cells based on a single criterion.

Here’s the formula for COUNTIF:

=COUNTIF(D5:D12,”>=21″)

9. PMT

The PMT function is a great way of making periodic-based calculations, that is let’s say, calculating periodic payment for a loan, based on a fixed interest rate and loan term. 

Here’s the formula:

=PMT(rate, nper, pv, [fv], [type])

10. INDIRECT

The INDIRECT function is a great tool that can be used if you want to create dynamic references. With this function you can  reference a cell or range based on a text string. What that does is, it makes your formulas more flexible and adaptable to changes in the spreadsheet.

Here’s the formula:

=INDIRECT(ref_text, [a1])


Watch: Excel Tutorial | Beginner to Advanced – Part 1 I Imarticus Learning

Conclusion

Mastering the advance functions of Excel is actually essential for any analyst. Since you will be dealing with large datasets, you need to have flexible models. As an analyst, one of your goals would be to automate repetitive tasks so that you can focus more on strategic elements. If you want to get the most out of Excel and then you should try to get a professional certificate from Imarticus Learning and apply them in financial modelling and analysis.

FAQs

1. What are the most essential advanced Excel functions for analysts?
If you want to go for financial analysis, there are some functions like VLOOKUP, INDEX/MATCH, SUMIFS, and PMT which are extremely important.

2. How does SUMIFS differ from SUMIF?
As a analyst, you might often use SUMIFS. This function is used so that you can also use multiple criteria while using it. On the other hand, SUMIF is limited to one condition.

3. What makes INDEX/MATCH more versatile than VLOOKUP?
Since specific data in large data sets can be difficult to track, INDEX/MATCH is one of the functions that will help you search any column. On the contrary, VLOOKUP aids you with the first column.

4. How do I handle errors in Excel?
If you want to replace error messages, you can do so with the IFERROR function to replace error messages with a custom value.

5. What is the OFFSET function used for?
OFFSET is an important tool for you to use as an analyst as it will help you  to create dynamic ranges. By creating these dynamic ranges, you make your formulas more flexible.

Understanding Python Objects: A Comprehensive Guide

If you’ve ever written even a single line of Python code, you’ve already worked with a Python object: whether you realized it or not.

Objects lie at the heart of Python programming, and give it the ability to be not only elegant in nature, but flexible in design. Right from data to functions to classes – Python considers them all as objects. 

But what does that exactly mean? And how does that affect how you work with the programming language? 

In this guide, let’s help you figure out exactly that. 

This will also serve as an important foundation before you embark on any data science course

What is a Python Object?

A very straightforward and yet powerful feature that is at the heart of the Python design is that everything is an object in Python. However, when you ask what is object in Python, then by very simple means it can be interpreted as follows:

A Python object is a container that bundles two essential components:

  • State: This refers to the data the object holds, often called attributes.
  • Behavior: These are the actions the object can perform, known as methods.

So, creating a variable in Python automatically creates an instance of a class. And that is precisely what a Python object is! 

Take this simple line of code:

x = 5

On the surface, it looks like x is just holding a number. But under the hood, x is a fully-formed Python object of the built-in int class. That means it comes with several built-in methods and properties you can use. For example:

print(x.bit_length())  # Output: 3

In this case., bit_length is a method of int class. The approach is to determine the number of bits necessary to effectively present the number in its form of binary representation. You can observe the fact how even the lowest-level entities of the world of programming, i.e. the variables, turn out to be the objects in Python under the hood.

This leads us to an important conceptual answer to the question, “Is Python object oriented?”

Let’s take a closer look at that question – is Python object oriented? 

Watch:#49 Python Tutorial for Beginners | Class and Object

Is Python Object-Oriented?

The simple answer is – yes, Python is object-oriented. 

The complex answer is – it’s object-oriented in its own unique, flexible way. Unlike some strictly object-oriented languages like Java or C++, Python supports multiple paradigms. These include procedural, functional, and object-oriented programming (OOP).

Because of this, it’s safe to say that Python is object-oriented, but not only that! 

What makes Python especially powerful is that OOP is built into its core. Here’s how:

  • You define and work with you own classes and objects.
  • You can reuse existing classes and use their code using inheritance. 
  • Your Python objects are capable of being private and hiding their internal state from the global environment through encapsulation. 
  • Your Python objects can have varied behaviors as per your context and the class they’re being used with, even if they share the same method name..

Here’s a quick OOP example:

class Car:

    def __init__(self, brand):

        self.brand = brand

    def drive(self):

        print(f”{self.brand} is driving!”)

my_car = Car(“Toyota”)

my_car.drive()  # Output: Toyota is driving!

In this case, my_car is a Python object of class Car. You’ve just built a mini data model using object-oriented principles!

Why Are Python Objects Important?

Python objects are important because they quite literally form the backbone of the language and everything you do based on it. 

  • All things are objects: Integers, lists, functions, modules, classes themselves are all objects.
  • Efficiency in memory: All objects are accessed through references, rather than through copies, which speeds up and makes memory efficient.
  • Customizability: through classes, you can specify the exact types of objects you wish to deal with, making it possible to write reusable, modular programs.

So, no matter your field of work. As long as you’re operating on Python, you are working with Python objects to manage complexity with ease! 


Watch: OOPs in Python | Understanding OOPs Concepts

Object Lifecycle in Python

Every object in Python has a lifecycle:

  1. Creation: when created out of a class.
  2. Usage: the calling of methods or accessing data.
  3. Destruction: the object is no longer being referred to and is cleaned-up by the garbage collector of Python.

Here’s a quick summary of the types of objects available in Python. 

TypeDescriptionExamplesUse Cases
Built-in ObjectsPredefined types provided by Python. Ready to use with built-in functionality.int, float, bool, str, list, dict, setArithmetic, text manipulation, data storage, iteration
User-defined ObjectsCustom objects created using class. Reflect complex or real-world structures.class Account, class ReportGeneratorModeling financial systems, data structures, AI models

Understanding this cycle helps you manage memory and debugging more effectively, especially when building larger applications.

Final Thoughts

The real power of Python appears when you begin doing more than writing scripts; you have to think in objects. Knowing the nature, behaviour, usage, as well as development of Python objects will not only better your skills as a coder, it will open the door to the world of highly proficient fields of work such as data analytics, automation, and financial analysis.

If you’re looking to expand your understanding and knowledge of Python, and see work on its real-world applications, check out the Postgraduate Financial Analysis Program. This state-of-the-art data science course, developed by Imarticus, provides you with the appropriate theoretical and practical knowledge to get going in the world of data science! 

Frequently Asked Questions (FAQs)

1. What is a Python object and how is it different from a variable?

In Python, an object is an instance of a class which has attributes (data) and functions (methods). A variable is simply just a pointer of an object.

2. Is Python object-oriented or something else?

Python is object-oriented at its core, but differs from traditional object-oriented programming languages. Python is more flexible than them, in that it also supports alternative paradigms like procedural and functional. 

3. Are functions and classes also Python objects?

True, everything is an object in Python, even functions and even classes themselves. It is possible to pass them as arguments, or even in other functions by defining them.

4. How do I know which Python object I’m working with?

You can call the inbuilt function type() along with the object name to get the type of the object. So, type (41) will return class int, and so on. 

5. Why is understanding Python objects important in data science?

Data in Python is nearly always organized as an object – such as DataFrame in Pandas or Array in NumPy. An understanding of how Python works behind its objects enables you to create better, faster, and readable code.

Getting Started with Python: Installation and Setup

With Python everywhere, from Netflix recommendation systems to fraud detection systems in finance, it’s a tool that is fueling our tech-heavy world. It stands out in science, automation, and artificial intelligence; among other fields.

One particular reason for Python being liked across the spectrum is its easy to learn, uncomplicated syntax. Regardless of whether you want to analyze market trends, optimize business processes, or just explore coding a bit, Python is the best place to start.

On that note, before you get started writing your first Python program, there is the one most important preparation – getting Python installed and configured correctly on your system.

Not sure how to install Python? 

Let’s help you out! 

In this guide, we’ll walk you through exactly how to install Python on Windows, macOS, and Ubuntu, without any prerequisites. 

And if you’re planning to apply your skills in finance, analytics, or tech, you’re in luck because several state-of-the-art data science courses are designed to teach Python with hands-on, industry-relevant projects.

Let’s get your Python environment up and running!

How to Install Python on Windows

Here’s how you can install Python on Windows quickly and without any hassle:

  • Head to python.org/downloads
  • Download the latest Python 3.x release.
  • Run the installer, and don’t forget to check the box that says:

      “Add Python to PATH”
  • Choose “Install Now” and let it finish.

Alternatively, you could also use the MIcrosoft Store to install Python. This is a simpler method for personal devices, and ensures automatic updates for your Python installation. Just search for “Python” in the Store, install, and confirm with the following code on powershell. If python installation has been successful, you’ll see the version number:

python –version

Once you’ve installed Python on Windows, the next thing is to get an IDE, which is basically the environment on which you run your Python scripts. For starters, you can begin with visual code, using the following steps: 

  1. Install Visual Studio Code (VS Code):
  2. Add Python Support to VS Code:
    • Open VS Code
    • Go to Extensions (Ctrl+Shift+X)
    • Search for Python
    • Install the official extension by Microsoft
  3. Pick Your Python Interpreter:
    • Press Ctrl+Shift+P to open the Command Palette
    • Type “Python: Select Interpreter”
    • Choose the one labeled with the version you just installed

Finally, you have the Python installation and IDE set up completed in Windows. To verify this, run a basic program.  Open the terminal in VS Code (Ctrl + backtick or View > Terminal) and type:

python

You should see the Python prompt (>>>). Now try typing:

print(“Hello, Python!”)

You’ll see the string printed back on the console! You did it. You’re officially writing Python on Windows!

Now, let’s see how we can install Python in macOS.

Watch: Installing Python | Python Programming | Tutorials on Python – Imarticus. 

How to Install Python in Mac (macOS)

Installing Python on macOS is just as simple as how to install Python in Windows, but with a few mac-specific steps:

1. Start by check if Python is already installed. macOS often comes with Python 2.x pre-installed. For that, open terminal and type:

python3 –version

If you see a 3.x version, you may already have it.

2. Install Homebrew (If Needed)
If you want better control over versions, first install Homebrew.

3. Install Python via Homebrew
Once Homebrew is set up, type:

brew install python

4. Verify It Works

python3 –version

If you get the Python version printed, congratulations—you now have Python running on your Mac.

Now, let’s understand how to install Python in Ubuntu. 

How to Install Python Ubuntu (Linux)

Your Ubuntu OS comes preinstalled with Python. However, you need to ensure you have the altes installation in place. For that:. 

1. Update the List of Available Packages

Press Ctrl + Alt + T to get your Terminal on. Then, run the following command to refresh your package list. 

sudo apt update

This command fetches updates for your package manager without installing them yet.

2. Upgrade Existing Packages

Run the following command to upgrade your existing software:

sudo apt upgrade

This will bring all installed packages on your system up to date, reducing compatibility issues during the Python installation.

3. Install Python in Ubuntu

Now, you’re ready to install Python. Change the version number as per your requirement, in the example we’ve used version 3.10: 

sudo apt install python3.10

This way, you’ll quickly and seamlessly download and install the specified Python version on your. To check whether it has been done successfully, type:

python3.10 –version

You should now see a message displaying the installed version of Python.

With that, you have successfully learnt how to install Python on Ubuntu, along with installing Python on Mac and Windows. 

Watch: PYTHON for Beginners: Learn Python Programming from Scratch (Step-by-Step) | Module 01

Conclusion 

The installation process for Python is complete so now you can start learning its functions. But where should you begin?

Python serves as the perfect partner for people who want to analyze financial trends or forecast markets or begin a career in data science. It is essential to select a program which delivers Python education through practical real-world financial analysis applications in the industry.

This data science course teaches Python fundamentals through Python fundamentals and their application in finance-focused learning environments. Developed by Imarticus Learning, the course is for people who want to eventually build a solid career in data science and analytics, starting from the very foundations. 

Frequently Asked Questions (FAQs)

1. What’s the quickest way to install Python in Windows?

Go to python.org and get the latest Windows installer. Don’t forget to check the “Add Python to PATH” radio button while installing. 

2. I have a Mac. How do I install Python without breaking the system version?

macOS usually comes with an older version of Python (usually Python 2.x) already installed. It’s wise to not clobber the system version, so install Python on Mac using Homebrew. Once you have Homebrew installed, you can simply run brew install python in Terminal. 

3. I am using Ubuntu. Is Python installed, or do I need to install it myself?

A majority of Ubuntu systems have Python installed in them. Nevertheless, in order to make sure that you have got the latest version installed, open the Terminal and type in sudo apt update and then sudo apt install python3.

5. Is Python reinstallation necessary if you change from Windows to Mac or Ubuntu?

Yes, Python installations are platform-specific. So, if you change OS, you will need to figure out how to re-install Python again. 

Mastering XGBoost: A Comprehensive Guide for Beginners

Have you ever felt lost staring at endless rows of data? 

Perhaps you’ve tried different algorithms but found yourself wondering, what is XGBoost, and how exactly can it help you? 

You are not alone. Predictive modelling details can be overbearing to the uninitiated venturing into data science. Fortunately, though, there’s a clear way ahead. 

This post provides an introduction to the XGBoost algorithm, simplifying the concept so you can confidently build your first predictive powerhouse.

Why XGBoost Emerged

A few years back, Kaggle competitions began witnessing a seismic shift. Algorithms once dominating leaderboards, like Random Forest and Support Vector Machines, gave way to a newcomer: the XGBoost algorithm. 

XGBoost (eXtreme Gradient Boosting) is an open-source library designed for gradient boosting tasks.

Its aim is to provide a scalable, portable, and distributed gradient boosting framework (GBM, GBRT, GBDT). You are able to run XGBoost on one machine as well as across distributed systems. It can also integrate well with major processing frameworks, namely Apache Hadoop, Apache Spark, Apache Flink, and Dask.

Developed by Tianqi Chen in 2014, XGBoost rapidly gained fame for two reasons: remarkable speed and accuracy. During a recent data science course, participants using XGBoost models saw predictive accuracy climb to 89%, versus traditional models hovering around 74%.

But what triggered this rapid adoption? The short answer: performance. XGBoost cleverly manages large datasets and effectively handles complex non-linear relationships without slowing down.

What is XGBoost Exactly?

XGBoost stands for “Extreme Gradient Boosting,” which applies Gradient Boosting to create a machine learning library. 

  • It belongs to the broad category of ensemble learning, where various models team up to form a better and improved model.
  • XGBoost creates multiple trees in succession, trying to improve upon the mistakes of the preceding trees, which is where the concept of boosting comes in.
  • It has built-in parallel processing, which allows it to handle and analyze big data very fast.
  • It is possible to customise different parameters in the algorithm to control how the model works on your given problem.
what is xgboost

Technical Breakdown:

  • Gradient Boosting: Builds sequential trees, learning from predecessor errors.
  • Parallelisation: XGBoost cleverly processes data in parallel, reducing computation times.
  • Regularisation: Prevents overfitting, enhancing prediction reliability.

In a recent retail project, we replaced a logistic regression model with an XGBoost model.

The result? 

Conversion prediction accuracy jumped from 72% to 85% within just two weeks.

How to Implement XGBoost (Step-by-Step)

Here’s your step-by-step action plan to get started quickly:

Step 1: Installation
Open your Python console and type:

pip install xgboost

Step 2: Data Preparation
Organise data clearly. Missing values? 

XGBoost handles them gracefully, but clean datasets still yield better results.

Step 3: Train Your First XGBoost Model

Start by preparing your dataset and splitting it into training and test sets. Then, use the XGBClassifier( ) from the XGBoost library to train your first model and evaluate its performance.

Step 4: Evaluate and Tune
Adjust hyperparameters using grid-search methods to boost accuracy further.

Why Should You Choose XGBoost?

If efficiency and accuracy matter to your career in data science, choosing XGBoost is simple logic. Companies—especially tech giants like Netflix and Uber—rely heavily on the XGBoost algorithm because results matter. Learning XGBoost now places you significantly ahead of peers relying on older models.

Extreme gradient boosting (XGBoost) is a feature selection method to identify key variables from high-dimensional time-series data while removing redundant ones. After isolating the most relevant features, we input them into a deep long short-term memory (LSTM) network to forecast stock prices.

Because the LSTM model handles sequential inputs, it effectively captured the temporal dependencies in the dataset and leveraged future context for improved predictions. Its layered structure allowed it to absorb more of the stochastic behaviour found in fluctuating stock prices, leading to more robust and realistic forecasting.

Why Data Scientists Prefer XGBoost

For anyone working in data science, XGBoost stands out due to its ideal combination of prediction performance and processing speed.

This claim isn’t just theoretical—benchmarking studies have consistently backed it. When trained and tuned well, XGBoost models can outperform other machine learning algorithms, especially when speed and accuracy are both critical.

Running complex XGBoost models on CPUs can be painfully slow. A single training session could take hours, particularly when building thousands of decision trees and testing dozens of hyperparameter sets.

  • It speeds up common data prep tasks using a DataFrame interface, much like Pandas or scikit-learn.
  • You can process, train, and even deploy models end-to-end, without costly data transfers between CPU and GPU.
  • RAPIDS supports multi-GPU and multi-node setups, making it ideal for working with very large datasets.

XGBoost + RAPIDS: A Powerful Combination

The RAPIDS team collaborates closely with the developers of XGBoost, ensuring that seamless GPU acceleration is now built-in. 

This integration allows:

  • Faster model training
  • Improved accuracy
  • Better scalability across larger datasets

Thanks to GoAI interface standards, XGBoost can now import data directly from cuDF, cuPy, Numba, and even PyTorch—all without memory copies.

Using the Dask API, you can easily scale up to multiple GPUs or nodes, while the RAPIDS Memory Manager (RMM) ensures all processes share a single high-speed memory pool efficiently.

How GPU-Accelerated XGBoost Works

When using GPU acceleration, XGBoost performs:

  • Parallel prefix sum scans to evaluate all possible splits in your data
  • Parallel radix sort to optimise data partitioning
  • Level-wise decision tree construction, enabling it to process the entire dataset in parallel
  • This method dramatically speeds up each boosting iteration while maintaining high prediction accuracy.

Scaling with Spark and GPU-Accelerated XGBoost

NVIDIA also addressed the needs of large-scale enterprises by enabling XGBoost integration with Apache Spark. 

The Spark-XGBoost release introduced distributed training and inference across Spark nodes, offering:

  • Faster data pre-processing for massive datasets
  • The ability to handle larger datasets in GPU memory
  • Quicker model training and hyperparameter tuning

Whether you’re operating in the cloud or on-premise, GPU-accelerated XGBoost with Spark brings serious performance gains.

Quick Comparison: XGBoost vs Traditional Models

AspectXGBoostRandom Forest
SpeedFastModerate
AccuracyHigh (89-92%)Moderate (70-80%)
ScalabilityExcellentLimited
Complexity HandlingStrongAverage

Postgraduate Programme in Data Science and Analytics with Job Assurance by Imarticus Learning

Prove yourself as a highly valuable asset to your company in the current job market by studying the Postgraduate Programme in Data Science and Analytics, a carefully designed programme by Imarticus Learning that provides you with important skills demanded of today’s data specialists. 

Whether you are a new graduate or an early career professional with a technical background, this full course provides precisely the knowledge and practical experience required to become successful as a data scientist or data analyst. 

The programme provides a strong course schedule including lessons in Python, SQL, Power BI, Tableau, and hands-on learning with practical analytics techniques, which makes you ready for the real world.

A postgraduate programme in data science and analytics ensures a job after graduating, and you will belong to our established network of more than 500 leading companies seeking data professionals, with doors wide open to at least 10 interview slots.

Students receive live sessions and hands-on training from experienced faculty, providing them with applicable industry-aligned experience to thrive in different roles in the data science space from the beginning itself.

 Enrol now in the Imarticus Learning Postgraduate Programme in Data Science and Analytics and secure your dream job today!

FAQ

What is XGBoost?
XGBoost stands for Extreme Gradient Boosting, an efficient machine learning library for classification & regression tasks.

Is the XGBoost algorithm difficult for beginners?
Yes, it is initially challenging, but approachable with structured guidance.

Can XGBoost handle missing data?
Yes, it effectively manages missing values.

Why is the XGBoost model popular in data science courses?
High accuracy and straightforward implementation make it ideal for beginners.

How does XGBoost avoid overfitting?
XGBoost uses regularisation parameters and early stopping techniques.

Does learning XGBoost require advanced programming skills?
Basic Python proficiency is sufficient to start mastering XGBoost.

Is XGBoost compatible with Python and R?
Absolutely, it integrates seamlessly with both languages.

    Quantitative Data Analysis: The Skill Every PGDM in Fintech Students Must Master

    Are you still missing, or are you actually measuring?

    Do tables full of data or dashboards packed with numbers confuse or stress you out? You’re not alone. Many PGDM students majoring in fintech struggle to make sense of data. Even though you learn how to use certain tools, you may not always know how to use them effectively.

    Employers do not want people who are familiar with regression; they want applicants who can explain, “This is what the data says, and this is what we are going to do next.”

    When you find yourself wondering how to really be different in the world of fintech, then you need to know: The days when you can get by without the skill of quantitative data analysis are gone; it is now part and parcel of your success.

    Why Fintech Needs Quantitative Data Analysis, Not Just Theories

    The fintech industry runs on data, user behaviour, risk profiles, fraud detection, trading patterns, and market trends. That’s why PGDM in Fintech students must know how to apply quantitative data analysis methods and draw conclusions that impact business.

    Quantitative research applies mathematics and statistics to fields like economics and marketing. Unlike qualitative data, which focuses on ‘why’ and ‘how,’ quantitative data analysis tells you ‘what’ and ‘how much.’ The difference? It’s the difference between opinion and action.

    Your career in fintech depends on how well you bridge this gap.

    The Real-World Use of Quantitative Data in Fintech

    Experts expect the data analytics market in India to reach a projected revenue of US$21,286.4 million by 2030. Between 2025 and 2030, the market is likely to grow at a compound annual rate of 35.8%.

    Whether you’re joining a startup or a global bank, you’ll encounter massive amounts of financial data. You may be looking at credit scores, transaction histories, or investment behaviour. Without proper data analysis, all of that remains just noise.

    Here’s how firms actually use quantitative data analysis:

    • Build loan approval models using regression.
    • Forecast currency fluctuations with time-series data.
    • Identify fraud using outlier detection methods.
    • Test product changes using A/B testing.

    And this is where qualitative and quantitative data analysis often complement each other. You might use surveys to get feedback (qualitative), but validate impact using numbers (quantitative).

    Why PGDM in Fintech: Students Must Prioritise Data Skills

    You’re studying fintech because you want to lead in this space, right?

    Then it’s not enough to understand tech platforms and finance models. You need to bring in quantitative data analysis methods that show measurable results. They need people who know how to take a dataset and say, “This trend needs our attention.” And that kind of skill doesn’t come from last-minute learning.

    So yes, mastering quantitative data analysis isn’t just about passing exams. It’s about building confidence, credibility, and job readiness.

    Methods That Matter: What You Should Really Focus On

    Let’s be honest: Not every data method is relevant to fintech. Some are more helpful than others.

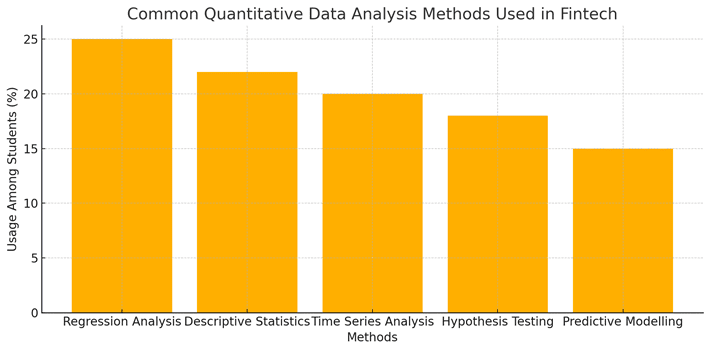
    Below is a visual breakdown:

    quantitative data analysis​

    As you can see, regression analysis and descriptive statistics are widely used, especially in roles like credit risk, analytics, and investment modelling. Hypothesis testing and time-series techniques are equally crucial for back-testing strategies and forecasting.

    Traditional vs Fintech-Oriented Data Analysis

    Here’s a quick comparison to show how your learning should evolve:

    Skill AreaTraditional Business CoursesPGDM in Fintech Approach
    Data FocusHistorical reports and basic insightsReal-time analytics and predictive models
    Tools UsedExcel, PowerPointPython, R, Tableau, SQL, APIs
    Learning StyleTheory-based lecturesCase studies, real-time simulations
    Decision-MakingGut-feel, senior leadership-drivenData-first, model-driven
    ApplicationGeneral strategyFinancial products, customer journeys, and fraud systems

    If you want to succeed in a PGDM in Fintech, start thinking in models, not just in marks.

    Common Mistakes Students Make with Quantitative Analysis

    Let’s call them out:

    1. Only learning tools like Excel or Python without understanding when to use what.
    2. Thinking that qualitative and quantitative data analysis are completely separate (they’re not).
    3. Memorising formulas instead of practising real use cases.
    4. Ignoring industry-specific datasets like market feeds, customer data, or financial statements.
    5. Relying too much on software outputs without interpreting the logic behind them.

    Fintech companies hire thinkers, not just tool users.

    How PGDM in Fintech at Imarticus Learning Helps

    If you’re looking for a course that not only teaches fintech but also focuses on mastering data, the PGDM in Fintech from Imarticus Learning in partnership with ISBR is worth your time.

    This two-year, full-time programme offers far more than just lectures.

    It includes:

    • A Fintech Workshop by PwC Academy, with practical sessions led by domain experts.
    • A curriculum designed around emerging fintech trends, including blockchain, cybersecurity, and data science.
    • Case-based learning, where you solve actual financial problems using real datasets.
    • Internship opportunities with top companies, this is not theory. It’s in-office, real-world work.
    • Expert-led learning where faculty members bring current industry practices into the classroom.

    The PGDM in Fintech by Imarticus Learning make you job-ready in both skills and confidence.

    Apply for the PGDM in Fintech by Imarticus Learning and build your career with hands-on data experience.

    FAQ

    1. What is quantitative data analysis in fintech?
    It’s the practice of using mathematical and statistical methods to examine financial data and make informed decisions.

    2. How are qualitative and quantitative data analysis different in PGDM in Fintech?
    Qualitative research helps understand opinions, while quantitative research measures trends and results. Fintech uses both, often in combination.

    3. Which quantitative data analysis methods are most used in fintech?
    Common ones include regression, time series, hypothesis testing, and predictive modelling.

    4. Is data analysis part of the PGDM in Fintech syllabus?
    Yes. At Imarticus Learning, it’s a major part of the curriculum with hands-on casework and tools.

    5. Can I learn quantitative data analysis without a tech background?
    Yes, with the right training and focus, students from all backgrounds can pick it up.

    6. Do employers expect PGDM in Fintech grads to know data modelling?
    Yes. In fact, strong modelling skills often increase placement chances and packages.

    7. How does Imarticus Learning help in applying data analysis practically?
    With case-based learning, PwC-led workshops, and real internships, students don’t just learn, they apply.

    The Final Words

    At the end of the day, tools change. But the way you solve problems stays. That’s why quantitative data analysis is something every PGDM in Fintech student must learn and practise till it becomes second nature. It’s not just about job interviews. It’s about making better decisions every single day in your career.

    If you can’t measure, you can’t improve. So start now, practise, apply, reflect, and you’ll build skills that no one can take away.

    Python Data Types: An Introduction

    Are you confused about why your Python code keeps throwing type errors? Or why do some variables behave unpredictably while others don’t change at all? The real issue lies in not fully understanding Python data types.

    Whether you’re just starting out or diving into a data science course, skipping the basics can cost hours of debugging. This post explains what are data types in python, explains mutability, and helps you use each type the right way so your programs run smoothly and efficiently.

    What are Data Types in Python?

    Python is a programming language that you can easily use for many different tasks.

    If you mess this part up, your program might crash, behave unexpectedly, or just slow you down.

    Why you need to know this:

    ·         You can prevent errors by choosing the right type.

    ·         It helps improve your code efficiency.

    ·         Data types make debugging faster.

    ·         Crucial for interviews, especially if you’re applying after a data science course.

    ·         You must understand them to master control flow, loops, or even basic functions.

    Understanding Python’s Built-In Data Types

    Python became popular because it is simple to use and easy to read. That’s why both beginners and experienced people like using it.

    Even in 2025, this is one big reason people choose Python. In data science, people come from many backgrounds. Some are good with numbers, and others know coding well. Python makes it easier for anyone to start learning and building things without much trouble.

    Python offers several built-in data types grouped into categories:

    1. Numeric Types

    int: For integers (e.g., 1, 500)

    float: For decimals (e.g., 10.5, 3.14)

    complex: For complex numbers (e.g., 4 + 3j)

    All of these are immutable data types in python, meaning their value cannot be changed after assignment.

    2. Text Type

    str: For text or string values (e.g., ‘hello,’ “world”)

    Again, strings are immutable. Even if you change a character, python creates a new string object behind the scenes.

    3. Boolean Type

    Bool: Can be either True or False. Often used in condition checks and logical operations.

    Mutable vs Immutable Data Types in Python

    Let’s clarify something: many beginners struggle with mutability.

    In simple terms:

    Ø Immutable means you can’t change the value once it’s set.

    Ø Mutable data types in python mean you can change the contents without creating a new object.

    Here’s a breakdown:

    Python Data Types: Mutable vs Immutable

    Data TypeCan You Change It? (Mutability)What It’s Usually Used For
    intNo (Immutable)Storing whole numbers like age, count, or price
    floatNo (Immutable)Dealing with decimal values, such as weight or salary
    strNo (Immutable)Handling text, names, messages, or any string data
    tupleNo (Immutable)Storing a fixed set of items like coordinates or settings
    listYes (Mutable)Holding a collection of items that may change, like a to-do list
    setYes (Mutable)Keeping unique items without duplicates, like tags or categories
    dictYes (Mutable)Pairing keys with values, like name and phone number in a contact list

    This comparison will help you avoid mistakes like modifying immutable types or incorrectly assuming you can change them, like lists or dictionaries.

    The Different Collection Data Types

    1. List – Mutable and Ordered

    A list is like a shopping list.

    You can add, remove, or change items.

    my_list = [1, 2, 3]

    my_list.append(4)  # This changes the original list

    Used when your data will change. Lists are mutable data types in python.

    2. Tuple – Immutable and Ordered

    Tuples are similar to lists but fixed.

    my_tuple = (1, 2, 3)

    Useful for data that shouldn’t be changed, like coordinates.

    3. Set – Mutable and Unordered

    Sets store unique values. Great for removing duplicates.

    my_set = {1, 2, 2, 3}

    print(my_set)  # Output: {1, 2, 3}

    4. Dictionary – Mutable and Key-Value Based

    Dictionaries are like real-life dictionaries. They pair a word (key) with a definition (value).

    my_dict = {“name”: “Rahul”, “age”: 25}

    my_dict[“age”] = 26

    Very useful in data science course work for structuring data.

    How Python Treats Mutability

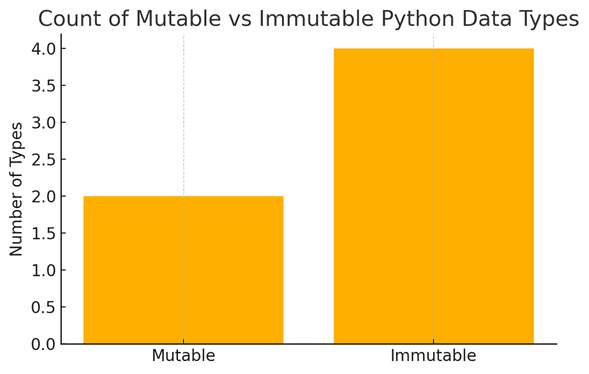
    We visualised the number of common mutable vs. immutable types. This helps you mentally group what’s safe to modify and what’s not. Check the chart for clarity.

    python data types

    Type Conversion in Python

    You’ll often need to convert one data type into another:

    ·         str() to convert to string

    ·         int() to convert to integer

    ·         float() for decimal numbers

    ·         list() or tuple() for collection types

    Why is this important? 

    Because mismatched types lead to TypeErrors. You must know which conversions are safe.

    Real-world Example: Why Data Types Matter in Data Science

    In your data science course, imagine you’re working with a CSV file. If the “age” column comes in as strings (‘25’, ‘30’), you can’t calculate averages. You’ll have to convert it to integers or floats.

    Not knowing what data types are in python can lead to major headaches in data preprocessing. That’s why companies expect you to master this first.

    Small Errors That Cost Big in Python

    •  Assigning a mutable object as a default argument in a function.
    • Trying to change an element in a tuple.
    • Using a string method on a list.

    These things seem small but often cause major runtime errors. So be cautious, especially when handling immutable data types in python.

    Build a Real Career with the Postgraduate Programme in Data Science and Analytics

    If you’re serious about getting into data science but feel overwhelmed by where to start, the Postgraduate Programme in Data Science and Analytics by Imarticus Learning might be just what you need. This course is for graduates and working professionals who want a job-ready skill set, not just another certificate.

    You’ll learn Python, SQL, Tableau, and Power BI and how to apply them in actual business scenarios. What sets this course apart? It’s not just theory. You’ll work on real projects, take part in hackathons, and get support with interviews from over 500 hiring partners.

    Even if you have no programming background, the course starts from the basics and guides you step by step.

    The Postgraduate Programme in Data Science & Analytics by Imarticus Learning also includes live training, career mentoring, and guaranteed interview opportunities so you don’t just learn, you move forward.

    Apply now and start learning with real impact!

    FAQs

    1. What is the role of data types in a data science course?
    Understanding Python data types is foundational in any data science course, especially when working with datasets, transformations, and type-safe operations.

    2. How do Python data types affect memory usage?
    Mutable types can use more memory if altered frequently. Knowing when to use immutable types helps optimise performance.

    3. Which data types in python are immutable?

    Immutable data types in python include int, float, str, and tuple. You can not change their values after the assignment.

    4. Which data types in python are mutable?

    The list, dictionary, and set are mutable. You can easily modify their content once you create them.

    5. Can you convert one Python data type into another?

    Yes, using type casting like int(), str(), or list(), you can convert between compatible data types in python.

    6. Is a string mutable or immutable in python?

    A string is immutable. You cannot change a specific character in a string.

    7. Why do I get TypeError in Python?

    TypeErrors usually happen when you try to perform an operation not supported by the data type used, like adding a string to an integer.

    Excel for Data Analytics Course: Master Fundamentals & Advanced Techniques

    Table of Contents

    • Why Excel is Essential for Data Analytics
    • What You’ll Learn in a Data Analytics Course
    • Excel for Data Analysis: Key Concepts
    • Advanced Excel Techniques for Data Analytics
    • Data Visualization in Excel: Bringing Data to Life
    • Excel Formulas for Data Analytics: Essential Functions
    • Best Excel Course for Data Analysts: How to Choose?
    • Excel Data Cleaning and Transformation: Preparing Data for Analysis
    • Career Prospects After Mastering Excel for Data Analytics
    • FAQs

    Why Excel is Crucial for Data Analytics

    Just ponder: you have at your hands a gigantic dataset; your boss wants the analysis done before the end of the day. Panic, or open Excel with confidence that you know how to play and display data? If you choose the latter, congratulations! You’re on your way to the data craft.

    What caused data analysis tremors in this wonderful world nowadays are modern tools like Python, R, and SQL while Excel was still the way!? All the way from startups to Fortune 500 companies, Excel is among professionals worldwide. And Excel is being used for such things as analyzing and reporting data, as well as making a decision or reporting decisions. A course in structured data analytics that focuses on Excel may offer you the right depth of knowledge for a growth-filled career in data analysis.

    What You’ll Learn in a Data Analytics Course

    A properly designed data analytics course will equip you with Excel analytics expertise. Here’s a summary of major skills you’ll acquire:

    • Excel Fundamentals & Navigation – Master spreadsheet organisation, functions, and shortcuts to work effectively.
    • Data Cleaning & Transformation – Process dirty data effectively, maintaining accuracy in analysis.
    • Advanced Excel Skills – Master PivotTables, Power Query, and macros for powerful data manipulation.
    • Data Visualization using Excel – Design engaging charts and dashboards to effectively present insights.
    • Statistical Analysis & Forecasting – Utilise Excel functions to perform predictive modelling and trend analysis.
    • Excel Automation using VBA – Discover how to automate routine tasks, making workflow more efficient.
    • Scenario Planning & What-If Analysis – Develop decision-making abilities leveraging Excel’s innovative forecasting capabilities.

    A complete data analytics course provides students with both theoretical and practical knowledge, making them job-ready in the competitive analytics market.

    Excel for Data Analysis: Key Concepts

    Excel is full of features that make it a powerful tool for data analytics. Let’s discuss some of the basic concepts:

    ConceptDescription
    Data CleaningRemoving duplicates, handling missing values, and transforming data
    Sorting & FilteringOrganizing large datasets efficiently
    PivotTablesSummarizing and analyzing large data quickly
    Conditional FormattingHighlighting important insights visually
    Power QueryAutomating data imports and transformations

    Expert Excel Skills for Data Analysis

    After you’re comfortable with the fundamentals, it’s time to explore more advanced Excel skills that can turbocharge your data analytics. These expert skills enable analysts to work with larger data sets, increase precision, and boost decision-making.

    • Power Pivot for Data Modelling – Work with giant data sets without breaking a sweat, creating relational models.
    • Macros & VBA Automation – Automate recurring tasks and craft custom Excel functions.
    • What-If Analysis & Scenario Planning – Model various business scenarios to enable data-driven decisions.
    • Data Validation & Dynamic Named Ranges – Enhance data integrity and structure workflows.
    • Power Query for ETL Processes – Extract, transform, and load data from various sources.
    • Array Formulas & Dynamic Arrays – Increase calculation speed and easily manipulate complex datasets.
    • Goal Seek & Solver – Maximise business strategies by determining the optimal solutions to specified constraints.

    These Excel power skills enable data analysts to make informed insights, process automation, and make effective inputs to business intelligence and decision-making.

    Data Visualization in Excel: Making Data Pop

    Numbers can tell a tale, but visualization makes it persuasive. Data visualization in Excel allows raw numbers to be translated into insightful observations to make findings communication-friendly.

    • Bar & Column Charts – Easily compare values for varying categories.
    • Pie Charts – Display proportions and patterns of distribution in a simple-to-interpret format.
    • Scatter Plots & Trend Lines – Reveal relationships between variables and monitor changes over time.
    • Heat Maps & Conditional Formatting – Dynamically highlight patterns and anomalies in datasets.
    • Dashboards with PivotTables & Slicers – Display multiple interactive insights in one view.
    • Waterfall & Funnel Charts – Break down financial data and customer conversion metrics.
    • Histogram & Pareto Charts – Understand frequency distributions and prioritise business strategies.

    Data visualization in Excel allows analysts to translate complex data into actionable insights, helping businesses make informed decisions based on trends and patterns.

    Excel Formulas for Data Analytics: Essential Functions

    Excel offers a wide range of functions crucial for data analysis. Here are some must-know Excel formulas for data analytics:

    FunctionUsage
    VLOOKUP & HLOOKUPSearch for values in datasets
    INDEX & MATCHMore powerful alternative to VLOOKUP
    IF & Nested IFPerform logical tests
    SUMIF & COUNTIFSummarize data based on conditions
    TEXT & DATE FunctionsManipulate text and dates effectively

    Top Excel Course for Data Analysts: How to Decide?

    With so many options out there, it can be confusing to choose the best Excel course for data analysts. The course should not only teach theoretical knowledge but also offer practical learning sessions. Here’s what to look for:

    • Comprehensive Curriculum – Covers both Excel fundamentals and advanced techniques.
    • Hands-on Projects & Case Studies – Practical experience enhances learning retention.
    • Industry Recognition & Certification – Accredited programs add credibility to your resume.
    • Flexible Learning Options – Choose from self-paced, online, or instructor-led courses.
    • Real-World Applications – Ensure the course includes business case studies and scenario-based learning.
    • Instructor Expertise – Learn from industry professionals with practical experience.
    • Post-Course Support – Career guidance, forums, and community discussions available at long-term value.

    The most effective Excel course for data analysts must map onto your career ambitions, with skills that are directly transferable to actual data challenges.

    Excel Data Cleaning and Transformation: Preparing Data for Analysis

    Before analyzing data, it’s essential to clean and organise it correctly. Excel data cleaning and transformation methods provide accuracy, consistency, and reliability of data, which is necessary for valuable insights.

    • Eliminating duplicates and dealing with missing values – Provides data accuracy and redundancy elimination.
    • Splitting and merging columns using Text-to-Columns & CONCATENATE – Organises data effectively.
    • Converting data types (numbers, dates, text) – Avoids calculation errors and inconsistencies.
    • Use of Power Query for automated data transformation – Streamlines cleaning and reshaping big datasets.
    • Use of Find & Replace for bulk edits – Rapidly standardises datasets.
    • Use of Trim, Proper & Clean functions – Eliminates unnecessary spaces, corrects text alignment, and corrects errors.
    • Standardising date formats & text case – Enhances readability and report consistency.

    A properly executed Excel data transformation and cleaning process ensures that datasets are ready for analysis, making insights more actionable and reliable.

    Career Opportunities After Excel Learning for Data Analytics

    Learning Excel can lead to promising career opportunities in various industries such as finance, healthcare, e-commerce, and consulting. Some of the jobs where Excel for data analytics is in great demand are:

    • Data Analyst – Gather, process, and analyze data to deliver actionable insights.
    • Business Intelligence Analyst – Create dashboards and reports that support business decisions.
    • Financial Analyst – Perform budgeting, forecasting, and financial modelling in Excel.
    • Marketing Analyst – Study consumer behaviour and report on campaign efficacy.
    • Operations Analyst – Streamline supply chain processes and logistics.
    • Sales Analyst – Monitor sales trends and analyze areas for expansion.
    • HR Analytics Specialist – Apply analytics to optimize workforce management and worker engagement.

    The ability of a professional to be analytical can be enhanced by the completion of a data analytics course with a focus on Excel and, therefore, they can become a valuable applicant or asset in today’s data-sensitive market.

    FAQs

    1. Is Excel still an important tool for data analytics?

     Yes! Excel is still an essential tool for data analysis used globally across companies.

    2. Why is learning advanced Excel skills important?

     Advanced Excel skills increase efficiency, automate processes, and enhance data analysis capabilities.

    3. In what ways does data visualization in Microsoft Excel contribute to decision making? 

     By such visuals, complex data becomes easily interpretable; business entities can thus identify and track trends and patterns immediately.

    4. Can one create dashboards on Excel? 

     Certainly! It comprises terrific tools like PivotTables, Slicers, and integration with Power BI to create dashboards that are interactively usable. 

    5. Is an Excel-based data analytics course important for career development? 

     Definitely! Excel is highly in-demand across finance, marketing, business intelligence, and beyond. 

    6. How do Excel formulas for data analytics simplify processing data? 

     Such functions, including SUMIF, VLOOKUP, and INDEX-MATCH, allow for easy data extraction, aggregation, and analysis. 

    7. Best online platforms for the best Excel course for data analysts. 

    Some of the best platforms include Imarticus Learning, which indeed has very well-reputed data analytics courses from industry experts.

    8. How does cleaning and transforming data in Excel influence analysis?

    Clean data provides the right insights without errors, improving decision-making.

    9. Is coding required to be an expert at Excel for data analysis?

     No, built-in features in Excel enable data analysis without coding.

    10. How do I practice Excel for data analytics?

    High-authority sources like Microsoft Learn, Kaggle, and DataCamp offer excellent learning materials. 

    Key Takeaways

    • Excel is still a potent tool for data analytics in industries.
    • Advanced Excel skills enhance efficiency and automate procedures.
    • Data visualization in Excel aids in presenting insights effectively.
    • Excel data transformation and data cleaning are essential for the right analysis.
    • Selecting the top Excel course for data analysts can speed up your career advancement.

    Conclusion

    For someone aspiring for data analytics careers, there must be mastery of Excel because everything – from cleaning and analysing data to presenting it using insightful visualisations – is considered a very important part of an analyst’s toolbox. So take a data analytics course today to start on the road to a brilliant career in analytics!

    Why You Should Consider an HR Analytics Course: Benefits and Insights

    In today’s data-driven world- businesses rely on analytics for better decision-making, and human resource management is no exception. Companies are increasingly leveraging HR data to improve hiring, performance management&employee engagement. This is where an HR analytics course can give you a competitive edge.

    If you’re…considering a career in HR or looking to upskill- enrolling in an HR analytics certification can unlock numerous opportunities. Let’s explore the benefits… key insights, &why an HR analytics course is a must-have for HR professionals.


    What is an HR Analytics Course?

    An HR analytics course generally equips professionals with the- skills to analyse and interpret HR data to make informed business decisions. It covers various techniques such as:

     ✅ HR data collection & management
    Statistical analysis using Excel & Python
    Predictive modelling & machine learning
    HR metrics for employee engagement & retention

    A well-structured HR data analysis course blends traditional HRM practices with analytics, helping professionals transform HR into a data-driven function.


    Why HR Professionals Need HR Analytics Skills

    1. Data-Driven Decision Making-

    Gone are the days when HR decisions were based on instincts. Today HR teams use data analytics for HR to predict employee turnover, measure performance, &optimise recruitment strategies.

    For instance, using predictive analytics, companies can identify employees who may leave within six months based on engagement scores and feedback analysis. This allows HR teams to intervene and improve retention rates.

    2. Enhanced Recruitment and Talent Management-

    With an advanced HR analytics course, professionals learn to:

    • Analyse candidate data to improve hiring accuracy
    • Use AI-powered screening tools to shortlist talent
    • Evaluate performance trends to match employees with the right roles

    A case study by LinkedIn found that companies using HR analytics reduced hiring time by 60% and cut hiring costs by 40%.

    3. Performance Management and Employee Engagement-

    HR analytics tools help in identifying employee productivity trends and predicting disengagement risks. By analysing data from surveys, performance scores, and attendance, companies can implement strategies to improve employee engagement.

    Want to understand more about why human resources are crucial for business success? Check out this article on the importance of HR.


    Key Benefits of an HR Analytics Course

    BenefitImpact on HR Professionals
    Better Decision MakingData-driven insights for strategic HR decisions
    Improved Hiring ProcessesAI-based recruitment strategies reduce time-to-hire
    Enhanced Employee RetentionPredict attrition and take preventive actions
    Higher Salary PotentialCertified professionals earn 30-40% more
    Future-Proof CareerStay ahead in the digital transformation of HR

    What Will You Learn in an HR Analytics Certification?

    A well-structured HR analytics certification covers:
    HR metrics & dashboards using Excel & Power BI
    Python programming for HR analytics
    Statistical methods & predictive analytics
    Machine learning applications in HR

    A great example is the Professional Certificate in HR Management and Analytics by IIT Roorkee, which combines HR expertise with modern analytics tools.

    Looking for different HRM models that shape today’s workforce strategies? Here’s a great blog on HRM models.


    How an HR Data Analysis Course Helps in Career Growth

    Enrolling in an HR data analysis course helps you gain:

    • Expertise in tools like Excel, Python, and Power BI
    •  Hands-on training with real-world HR case studies
    • Access to job portals & career mentoring

    A certified HR analyst can work in roles such as:

    • HR Data Scientist – Using machine learning for HR insights
    • HR Business Partner – Aligning HR strategy with business goals
    • HR Consultant – Advising firms on data-driven HR strategies

    Check out this YouTube video for deeper insights into HR analytics applications.


    Why Choose an Advanced HR Analytics Course?

    An advanced HR analytics course is ideal for:

    •  HR professionals looking to move into analytics-driven roles
    •  Business leaders seeking to enhance workforce efficiency
    • Data analysts who want to specialise in HR analytics

    Key features of an advanced HR analytics course include:

    • Live training from industry experts & IIT faculty
    • Hands-on projects with 8+ real-world case studies
    • Exclusive campus immersion at IIT Roorkee

    Learn more about how strategic HR models shape the future of HR analytics in this insightful article.


    Is an HR Analytics Certification Worth It?

    Absolutely! Companies today are willing to pay a premium for HR professionals skilled in data analytics for HR. Some statistics:

    • HR analysts with analytics skills earn 30-50% more than traditional HR roles
    •  95% of HR executives say data-driven decision-making is the future of HR
    • Demand for HR data scientists has increased by 70% in the last 5 years

    With an HR analytics certification, you stand out in the job market and gain the ability to drive real business impact.


    FAQs

    1. What is an HR analytics course, and how does it benefit HR professionals?

    An HR analytics course trains professionals to use data-driven techniques for HR decision-making, helping them optimise recruitment, performance management, and employee engagement.

    2. How is an HR analytics certification different from a traditional HR course?

    An HR analytics certification focuses on data analytics for HR, teaching tools like Excel, Python, and machine learning to analyse workforce trends, while a traditional HR course primarily covers HR policies and administration.

    3. Who should consider enrolling in an advanced HR analytics course?

    An advanced HR analytics course is ideal for HR professionals, business leaders, and data analysts looking to gain expertise in HR data analysis, predictive modelling, and workforce strategy optimisation.

    4. What skills will I gain from an HR data analysis course?

    A well-structured HR data analysis course covers HR metrics, predictive analytics, machine learning applications, data visualisation, and statistical methods using industry-relevant tools.

    5. How does data analytics for HR improve talent management?

    Using data analytics for HR, companies can predict employee turnover, improve recruitment strategies, and enhance workforce productivity by analysing performance trends and engagement levels.

    6. Do I need a technical background for an HR analytics certification?

    No, most HR analytics certification programs are designed for HR professionals with no prior coding experience, offering step-by-step training in tools like Excel, Power BI, and Python.

    7. How does an advanced HR analytics course impact career growth?

    Completing an advanced HR analytics course can significantly increase job opportunities and salary potential, as companies actively seek HR professionals with data-driven decision-making skills.

    8. What are the career prospects after completing an HR data analysis course?

    Graduates of an HR data analysis course can pursue roles such as HR Analyst, HR Data Scientist, HR Business Partner, and HR Consultant, working with data-driven HR strategies to enhance workforce efficiency.


    Conclusion: Future-Proof Your Career with an HR Analytics Course

    The world of HR is evolving rapidly, and data-driven decision-making is at the heart of this transformation. Whether you’re an HR professional, a business leader, or a data enthusiast, an HR analytics course can boost your career, increase earning potential, and provide future-ready skills.

    If you’re ready to take the next step, consider enrolling in a certified HR data analysis course that offers:

    •  Industry-recognised certification
    • Hands-on projects & real-world analytics training
    • Career support with job portals & resume mentoring

    The future of HR is data-driven, and the best way to stay ahead is to upskill with an HR analytics certification.

    Everything About Data Science Course Fees and Duration

    Introduction

    Data science is among the best-paying and most sought-after professions today. Organisations in various industries—finance, healthcare, e-commerce, and AI development—are looking for data experts to assist them in making sense of large volumes of data.

    With the increasing demand, many professionals are keen on making a switch to data science, but one big question mark is:

    How expensive is a data science course, and how long does it last?

    The cost of data science courses depends on the course type, institution, and learning mode. Whether you opt for a degree, certification, or online training, this handbook gives you an in-depth comparison of costs, duration, and career effect to enable you to make the best choice.

    Why Investing in a Data Science Course is a Wise Career Choice

    Before exploring the costs and duration of different data science programs, it’s important to understand the return on investment (ROI) of such courses.

    1. High Salary Potential

    According to LinkedIn and Glassdoor, here’s the typical salary range for data professionals in India:

    • Entry-level Data Scientist: ₹6 – ₹10 LPA
    • Mid-level Data Scientist: ₹10 – ₹20 LPA
    • Senior Data Scientist: ₹20 LPA+

    Globally, experienced data scientists can earn over $100,000 per year.

    2. Career Development & Job Security

    Data science careers have grown 650% since 2012. Data science and AI are ranked two of the five fastest-growing careers by the World Economic Forum.

    3. Career Adaptability & Industry-Wide Demand

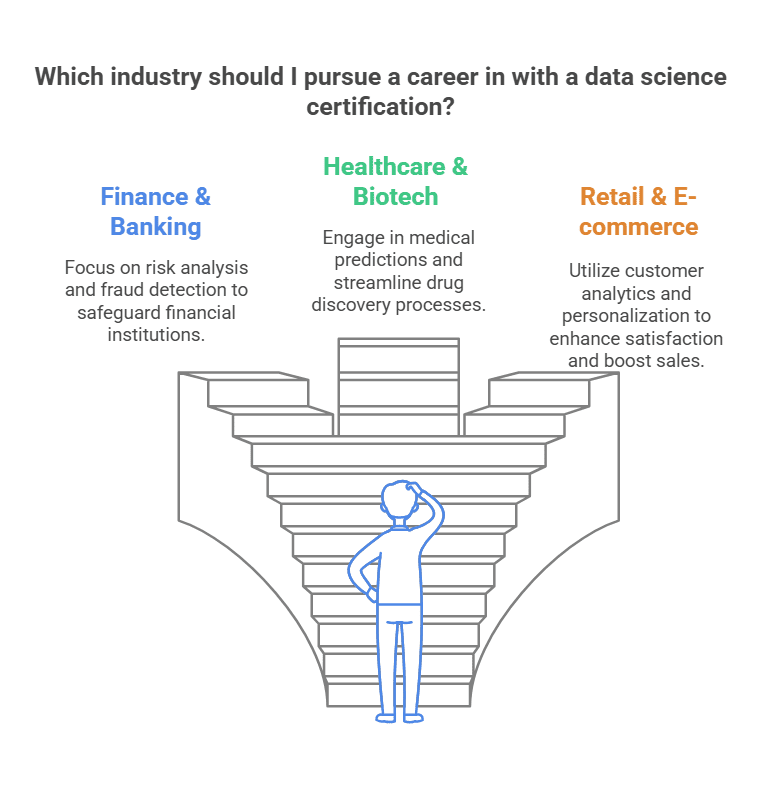
    With a data science certification, you can get into:

    ✔️ Finance & Banking (Risk Analysis, Fraud Detection)

    ✔️ Healthcare & Biotech (Medical Predictions, Drug Discovery)

    ✔️ Retail & E-commerce (Customer Analytics, Personalisation)

     ✔️ Technology & AI (Machine Learning, Deep Learning)

    This makes pursuing a structured, industry-accepted course a necessity to boost your career opportunities.

    Types of Data Science Courses & Their Costs

    There are various entry points to data science, each with varying degrees of depth, industry applicability, and career prospects. The below details covers eveything from data science training fees, course duration for data science programs

    1. Undergraduate Programs (B.Sc, B.Tech in Data Science)

    Undergraduate is best suited for students interested in a firm academic background in statistics, AI, and machine learning.

    Course Duration

    • B.Sc in Data Science – 3 Years
    • B.Tech in Data Science – 4 Years

    Course Fees

    • Public universities: ₹50,000 – ₹1,50,000 per annum
    • Private universities: ₹2,00,000 – ₹5,00,000 per annum

    2. Postgraduate Programs (M.Sc, M.Tech in Data Science)

    Postgraduate training enables professionals to specialize in cutting-edge AI, big data, and analytics.

    Course Duration

    • M.Sc in Data Science – 2 Years
    • M.Tech in Data Science – 2 Years

    Course Fees

    ₹1,50,000 – ₹8,00,000 per year

    3. Certification Programs & Bootcamps

    For those looking for quick upskilling, certification programs offer practical, hands-on training in Python, SQL, ML, and AI.

    Course Duration

    • Bootcamps – 3 to 6 months
    • Diploma & Certification Programs – 6 to 12 months

    Course Fees

    ₹50,000 – ₹1,50,000

    A Smart Alternative: Postgraduate Program in Data Science & Analytics by Imarticus Learning

    For working professionals seeking organised, practical training without having to pursue a full-time M.Sc or M.Tech, Imarticus Learning’s Postgraduate Program in Data Science & Analytics is an excellent choice.

    ✔️ Duration: 6-12 months

     ✔️ Mode: Instructor-led online training

     ✔️ Curriculum: Python, SQL, ML, AI, Big Data, and Analytics

     ✔️ Placement Assistance: Yes (Career-focused training with career guidance)

    ✔️ Suitable for: Working professionals & graduates who want to pivot into data science

    As opposed to a conventional postgraduate qualification, this certification course is based on practical projects, industry expert mentorship, and career guidance, which makes it a great fit for methodical yet lenient studying.

    Data Scientist vs Data Analyst – Which Is Right For You? (2025)

    FAQs

    1. What is the best job placement data science course?

    The Imarticus Learning Postgraduate Program in Data Science & Analytics is a solid option with hands-on projects, mentorship, and placement assistance.

    2. Can I switch to data science from a non-technical background?

    Yes! A number of programs start with teaching Python, SQL, and machine learning from the ground up, so it’s suitable for non-IT folks.

    3. Which programming languages are best for data science?

    ✔️ Python – Used the most for machine learning and AI

    ✔️ SQL – Must for database management

     ✔️ R – Ideal for statistical analysis

     ✔️ Java & Scala – Applied in big data frameworks

    4. Is remote work possible as a data scientist?

    Yes, data science work has great scope for remote working, particularly for data analyst, machine learning engineer, and AI researcher.

    5. What are the opportunities for career development after taking a course in data science?

    After gaining experience, you can shift to:

     ✔️ Senior Data Scientist

     ✔️ Machine Learning Engineer

     ✔️ AI Researcher

     ✔️ Data Science Manager

     ✔️ Chief Data Officer (CDO)

    6. How do I know whether a data science course is valid?

    Before signing up, verify for:

     ✅ Accreditation – Industry and university recognition

     ✅ Placement Support – Career guidance and job placement

     ✅ Real-World Projects – Case studies and hands-on experience

    ✅ Instructor Credentials – Trainers with industry experience

    7. Will AI replace data scientists?

    No. Although AI can automate certain tasks, human expertise is needed for data interpretation, model training, and ethical decision-making.

    8. Is it better to do an online course or a full-time degree?

    It is based on your career aspirations. Online certification courses such as Imarticus Learning’s Postgraduate Program in Data Science are great for fast upskilling and job preparation, whereas M.Sc or M.Tech degrees are more suited for long-term academic development.

    Key Takeaways

    • Data science course duration and fees differ according to program type (degree, certification, online).
    • Postgraduate courses such as M.Sc, M.Tech, or higher-level certifications provide systematic learning and career development.
    • Certification programs such as the Postgraduate Program in Data Science & Analytics by Imarticus Learning offer quicker, job-suitable skills with practical projects and placement assistance.

    Interested in becoming a data science professional without devoting 2+ years to a degree? Explore the Postgraduate Program in Data Science & Analytics for masterclass training, live projects, and placement guidance!

    The Key Skills Required for Data Analysis

    In the data-driven economy of today, businesses rely on data to make informed business decisions. From productising marketing campaigns, to forecasting customer behavior, or optimising operations, data analysts are at the forefront of turning raw data into insights that can be acted upon.

    If you will be working as a data analyst or simply wish to advance your skills, you must master a collection of skills needed in data analysis. This blog discusses critical skills for data analysts, such as main methods, software skills that you should know, and improving data analysis proficiency.

    What is Data Analysis

    Basically, data analysis is the act of gathering, cleaning, organising, and interpreting data for meaningful conclusions. Companies apply data analysis to streamline processes, improve customer experience, and increase profitability.

    There are two kinds of data employed in analysis:

    • Structured Data – Data organised in databases, spreadsheets, and tables.
    • Unstructured Data – Text, pictures, audio, and video that need special methods such as machine learning to analyze.

    The Rising Significance of Data Analysis

    Data analysis is an essential element of all businesses today. Firms employing data analytics perform better than their competitors by 20% or more in profitability (McKinsey).

    Where Data Analysis is Applied Across Sectors:

    • Banking and Finance – Fraud detection, risk assessment, stock price prediction.
    • Medicine and Healthcare – Disease prediction, hospital resource planning, patient tracking.
    • Online trade – Customer segmentation, recommendation customization, stock management.
    • Marketing – Sentiment tracking, campaign performance, audiences targeting.
    • Supply Chain – Cost reduction, demand forecasting, logistics planning.

    As the need for data-driven decisions has grown, data analysis skill experts for novices and professional data methods are needed.

    Key Data Analysis Techniques

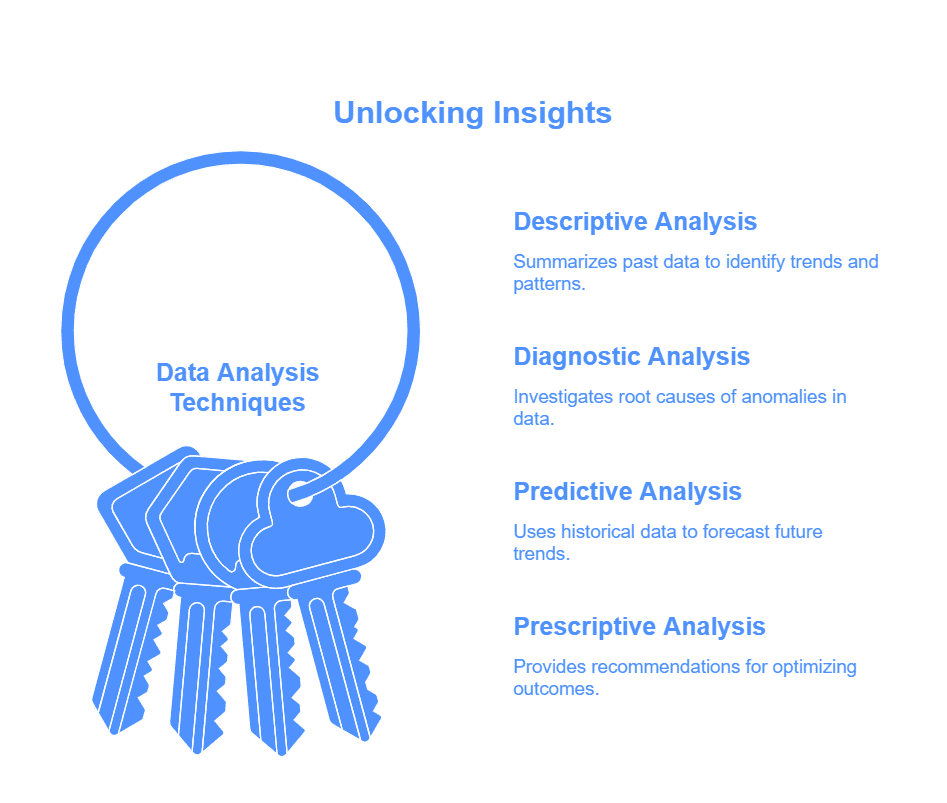
    Data analysts apply a variety of main data analysis methods to manage and analyse data in the right way. The four most common ones are explained below:

    1. Descriptive Analysis – What Happened?

    Descriptive analysis helps summarise past data to find trends and patterns. It is typically the starting point for data analysis.

    Example Applications:

    • Retail companies analysing past sales data to find out shopping times.
    • Web site owners analysing visitor traffic over time.
    • Firms analysing customer churn rates.

    2. Diagnostic Analysis – Why Did it Happen?

    Diagnostic analysis analyses information to uncover the root causes of anomalies and trends.

    Example Applications:

    • Determining the reason for a surge in web traffic.
    • Deciding the reason why one ad campaign generated better results in one area compared to another.
    • Investigating the reason behind products with higher return rates.

    3. Predictive Analysis – What’s Next?

    Predictive analytics employs statistical and machine learning algorithms to predict future trends.

    Example Applications:

    • Predicting stock market based on historical facts.
    • Estimating past sales volumes from historic customer behavior.
    • Estimating the probability of customer churn.

    4. Prescriptive Analysis – What Should We Do?

    Prescriptive analysis makes recommendations on the basis of learning from data.

    Example Applications:

    • Showing product demos to one-off users in e-commerce.
    • Optimisation of price strategy against competitive trends.
    • Suggestion of best ROI marketing channels.

    Key Skills Required for Data Analysis

    To succeed as a data analyst, you must have technical skills as well as soft skills. Here’s a rundown of the most important competencies:

    1. Statistical Knowledge

    Statistics is the backbone of data analysis. The understanding of statistical techniques in the correct manner equips analysts with the ability to interpret data.

    Most Important Statistical Concepts to Master:

    • Descriptive Statistics – Mean, median, standard deviation, variance.
    • Inferential Statistics – Hypothesis testing, probability distributions.
    • Regression Analysis – Finding relationship between variables.
    • Probability Theory – Needs to be studied for risk and machine learning models.

    2. Data Cleaning and Preparation

    It is reputed that 80% of a data analyst’s time is occupied with cleaning and getting data ready for analysis. (Source)

    Common Data Cleaning Operations:

    ✅ Removal of duplicate and redundant data.

     ✅ Management of missing values by using imputation methods.

     ✅ Normalising data types in an effort to achieve consistency.

     ✅ Outliers detection to avoid biased analysis.

    3. Programming and Query Languages

    Programming enables analysts to manipulate data programmatically and do sophisticated calculations.

    Key Programming Languages for Data Analysts:

    • Python – For data processing (Pandas, NumPy) and machine learning (Scikit-learn).
    • R – Statistical computing and data visualisation master.
    • SQL – To query big data in relational databases.

    Introduction to Deep Learning: Unlocking the Power of AI | Module 01

    4. Data Visualisation

    Data analysts need to communicate insights in an understandable way. Data visualisation enables stakeholders to make quick, well-informed decisions.

    Best Data Visualisation Tools:

    • Tableau – best for interactive dashboards and business intelligence.
    • Power BI – the ease of integration with Microsoft products.
    • Matplotlib & Seaborn – Python libraries for static plots and interactive plots.

    5. Machine Learning & AI

    Machine learning algorithms make an analyst better at predicting trends and identifying patterns.

    Important Machine Learning Topics:

    • Supervised Learning – decision trees, logistic regression.
    • Unsupervised Learning – clustering, anomaly detection.
    • Deep Learning – Neural networks for image and speech recognition.

    6. Business Acumen

    Analysts must understand the business context of their data so that they can make sound recommendations.

    Example: A marketing analyst must understand customer behavior trends so that they can optimize digital ad spend.

    7. Problem-Solving & Critical Thinking

    Data analysts must be able to:

    • Ask the right questions prior to analysis.
    • Find patterns and relationships in data.
    • Creating actionable insights that lead to business success.

    8. Communication & Data Storytelling

    Presenting findings as briefly as analyzing is as crucial.

    Best Ways to Present Data:

    • Use dashboards and infographics.
    • Minimise unnecessary jargon.
    • Present differently to technical vs. non-technical audiences.

    Table: Data Analyst Essential Skills

    SkillImportanceTools Used
    StatisticsCritical for interpreting dataR, Python (SciPy, StatsModels)
    Data CleaningEnsures accuracy of the dataPandas, OpenRefine
    ProgrammingMakes analysis easierPython, SQL, R
    VisualisationAids in communicating insightsTableau, Power BI
    Machine LearningFacilitates predictive analyticsTensorFlow, Scikit-learn
    Business AcumenFacilitates effective use of insightsExcel, BI Tools
    CommunicationFacilitates clarityGoogle Slides, PowerPoint

    FAQs: Top Questions About Skills Required for Data Analysis

    1. What are the key skills required for data analysis?

    The most important skills include statistical analysis, data cleaning, SQL, Python or R programming, data visualisation (Tableau or Power BI), and strong business acumen.

    2. What data analysis skills should beginners focus on first?

    Beginners should start with Excel, basic statistics, SQL, and simple data visualisation tools like Google Data Studio. Python and Tableau can be added as they progress.

    3. Do I need to know programming to become a data analyst?

    Yes, basic programming knowledge in Python or R is highly recommended. It helps automate tasks, analyse large datasets, and build predictive models.

    4. How can I improve my data analysis proficiency?

    You can improve by working on real-world datasets, taking online courses, solving Kaggle challenges, and mastering tools like Python, SQL, and Tableau.

    5. What are the most commonly used tools for data analysis?

    The most widely used tools are Python, R, SQL, Tableau, Power BI, Microsoft Excel, and data cleaning platforms like OpenRefine and Alteryx.

    6. Is data analysis a good career choice in 2025?

    Absolutely. With businesses relying on data for nearly every decision, skilled data analysts are in high demand. Job growth and salaries in this field are strong globally.

    7. What industries hire the most data analysts?

    Industries like finance, healthcare, retail, technology, marketing, and logistics consistently hire data analysts to drive decisions and optimise operations.

    8. What certifications can help me become a data analyst?

    Certifications such as Google Data Analytics, IBM Data Science, Microsoft Power BI, and the Imarticus Postgraduate Program in Data Science & Analytics can strengthen your profile.

    9. How long does it take to learn data analysis?

    With focused effort, you can gain foundational skills in 3–6 months. Achieving professional proficiency typically takes 9–12 months of hands-on practice and coursework.

    10. What’s the average salary of a data analyst?

    In the UK, entry-level data analysts earn around £30,000–£40,000 per year, while experienced analysts can make up to £65,000 or more depending on skills and location.

    Conclusion: Becoming a Skilled Data Analyst

    Mastery of data analysis skills for beginners and advanced techniques paves the way to lucrative career prospects.

    Key Takeaways:

    • A good data analyst is one who has both technical and business acumen.
    •  Tools like Python, SQL, and Tableau are of utmost significance when it comes to analysis.
    • Practice with actual datasets is the key to improving.

    What’s Next?

    Dreaming of a data analytics career? Enrol in the Postgraduate Program in Data Science & Analytics and embark on the journey to become a data guru!