What Is A Cluster Analysis With R? How Can You Learn It From A Scratch?

What is Cluster analysis?

Cluster means a group, and a cluster of data means a group of data that are similar in type. This type of analysis is described more like discovery than a prediction, in which the machine searches for similarities within the data.

Cluster analysis in the data science career can be used in customer segmentation, stock market clustering, and to reduce dimensionality. It is done by grouping data with similar values. This analysis is good for business.

Supervised and Unsupervised Learning-

The simple difference between both types of learning is that the supervised method predicts the outcome, while the unsupervised method produces a new variable.

Here is an example. A dataset of the total expenditure of the customers and their age is provided. Now the company wants to send more ad emails to its customers.

library(ggplot2)

df <- data.frame(age = c(18, 21, 22, 24, 26, 26, 27, 30, 31, 35, 39, 40, 41, 42, 44, 46, 47, 48, 49, 54),

spend = c(10, 11, 22, 15, 12, 13, 14, 33, 39, 37, 44, 27, 29, 20, 28, 21, 30, 31, 23, 24)

)

ggplot(df, aes(x = age, y = spend)) +

geom_point()

In the graph, there will be certain groups of points. In the bottom, the group of dots represents the group of young people with less money.

The topmost group represents the middle age people with higher budgets, and the rightmost group represents the old people with a lower budget.

This is one of the straightforward examples of cluster analysis. 

K-means algorithm

It is a common clustering method. This algorithm reduces the distance between the observations to easily find the cluster of data. This is also known as a local optimal solutions algorithm. The distances of the observations can be measured through their coordinates.

How does the algorithm work?

  1. Chooses groups randomly
  2. The distance between the cluster center (centroid) and other observations are calculated.
  3. This results in a group of observations. K new clusters are formed and the observations are clustered with the closest centroid.
  4. The centroid is shifted to the mean coordinates of the group.
  5. Distances according to the new centroids are calculated. New boundaries are created, and the observations move from one group to another as they are clustered with the nearest new centroid.
  6. Repeat the process until no observations change their group.

The distance along x and y-axis is defined as-

D(x,y)= √ Summation of (Σ) square of (Xi-Yi). This is known as the Euclidean distance and is commonly used in the k-means algorithm. Other methods that can be used to find the distance between observations are Manhattan and Minkowski.

Select the number of clusters

The difficulty of K-means is choosing the number of clusters (k). A high k-value selected will have a large number of groups and can increase stability, but can overfit data. Overfitting is the process in which the performance of the model decreases for new data because the model has learned just the training data and this learning cannot be generalized.

The formula for choosing the number of clusters-

Cluster= √ (2/n)

Import data

K means is not suitable for factor variables. It is because the discrete values do not produce accurate predictions and it is based on the distance.

library(dplyr)

PATH <-“https://raw.githubusercontent.com/guru99-edu/R-Programming/master/computers.csv”

df <- read.csv(PATH) %>%

select(-c(X, cd, multi, premium))

glimpse(df)

Output:

Observations: 6,259

Variables: 7

$ price  <int> 1499, 1795, 1595, 1849, 3295, 3695, 1720, 1995, 2225, 2575, 2195, 2605, 2045, 2295, 2699…

$ speed  <int> 25, 33, 25, 25, 33, 66, 25, 50, 50, 50, 33, 66, 50, 25, 50, 50, 33, 33, 33, 66, 33, 66, …

$ hd     <int> 80, 85, 170, 170, 340, 340, 170, 85, 210, 210, 170, 210, 130, 245, 212, 130, 85, 210, 25…

$ ram    <int> 4, 2, 4, 8, 16, 16, 4, 2, 8, 4, 8, 8, 4, 8, 8, 4, 2, 4, 4, 8, 4, 4, 16, 4, 8, 2, 4, 8, 1…

$ screen <int> 14, 14, 15, 14, 14, 14, 14, 14, 14, 15, 15, 14, 14, 14, 14, 14, 14, 15, 15, 14, 14, 14, …

$ ads    <int> 94, 94, 94, 94, 94, 94, 94, 94, 94, 94, 94, 94, 94, 94, 94, 94, 94, 94, 94, 94, 94, 94, …

$ trend  <int> 1, 1, 1, 1, 1, 1, 1, 1, 1, 1, 1, 1, 1, 1, 1, 1, 1, 1, 1, 1, 1, 1, 1, 1, 1, 1, 1, 1, 1, 1…

Optimal k

Elbow method is one of the methods to choose the best k value (the number of clusters). It uses in-group similarity or dissimilarity to determine the variability. Elbow graph can be constructed in the following way-

1. Create a function that computes the sum of squares of the cluster. 

kmean_withinss <- function(k) {

cluster <- kmeans(rescale_df, k)

return (cluster$tot.withinss)

}

2. Run it n times

# Set maximum cluster

max_k <-20

# Run algorithm over a range of k

wss <- sapply(2:max_k, kmean_withinss)

3. Use the results to create a data frame

# Create a data frame to plot the graph

elbow <-data.frame(2:max_k, wss)

4. Plot the results

# Plot the graph with gglop

ggplot(elbow, aes(x = X2.max_k, y = wss)) +

geom_point() +

geom_line() +

scale_x_continuous(breaks = seq(1, 20, by = 1))

Tableau: Accelerating Decision-making with the Power of Visual Analytics!

Tableau is one of the most frequently used data analytics tools. It is used for data visualization where the data is represented in a pictorial or graphical form. The raw data is converted into an understandable format by Tableau which can be further used for data analytics.

Firms use Tableau to understand the data and to use data analytics for empowering their business. Tableau helps in decision-making via forecasting, analytics, risk assessment, etc.

Let us see more about Tableau and how it helps in decision making & data visualization.

Importance of Visual Analytics

Visual analytics is the analytical reasoning of data via interactive visual interfaces which in this case is Tableau. Visual analytics helps in understanding the data better, finding outliers in the dataset, discovering insights, etc.

You can identify new opportunities for your business if you are visualizing your data via a good platform like Tableau. The benefits of using Tableau for visual analytics are as follows:

  • Tableau has excellent visualization capabilities and it helps in converting unstructured data into absolute logical results that are interactive. It is far better and powerful than its equivalent tools available in the market.Data Visualization
    The easy-to-use interface of Tableau provides data analysts to work faster and better. The drag-and-drop way of arranging unstructured data into diagrams and graphs makes it easier for beginners.Tableau is powerful and provides high performance of big data sets too. Beginners can easily complete Tableau training in less time and can get fluent in using it.
  • You can create a unified dashboard on Tableau where you can connect to multiple data sources. You can connect your dashboard with Hadoop, SAP, DB, etc., and can visualize data better.
  • There are a lot of Tableau users throughout the globe and one can find a helpful Tableau community on online forums. Tableau also provides a mobile application through which you can keep your visualized data at your fingertips.

How Tableau Accelerates Decision Making?

Tableau helps in visualizing and analyzing data. The structured data can be used for risk identification & management, increasing ROI, business forecasting, etc. You are well informed about your firm’s situation via data analytics and get to know about the upcoming market trends. You access the risk involved in any new opportunity via data analysis and then obtain it if is going to boost your business.

Tableau training in data visualization

Data analysis introduces clarity in your organization with a data-driven approach to obtain business objectives. Decision-making is hugely impacted via the use of data visualization tools and you will stay ahead of other firms in the market.

One can easily create and share analytics reports to your employees via Tableau, giving a sense of clarity. You can also use customer data to provide better services to them in the future. One can complete Tableau training online to understand how to use it.

Conclusion

Tableau is a powerful data visualization tool that can boost your business with better market predictions & risk assessment. Recent innovations in data analysis due to AI & machine learning have taken data analysis to a next level. You can learn more about data analysis via analytics courses available online. Start using Tableau for your business now!

Why is Data Science a Good Career in 2021?

Being a data scientist is only growing in demand over 2021 and is showing no signs of slowing down. It is estimated that around 11.5 million jobs in data science will be created by 2026 in the US. But, why is that the case? This article seeks to answer that very question.

  1. Use in Companies

Due to the ever-growing base of Big Data, every company is looking to utilize all available information to have a massive competitive edge.

Data Science CareerA data science career under a company is a frontier-field that finds new ways to better one’s products and services after utilizing past stores of information and/or case studies.

This work hence involves finding various avenues of data and finding new ways of processing and drawing conclusions from that data.

  1. Use in Studies

Being a form of study that is still in its nascent stages, a data science career may not be motivated by finding profit for a certain industry but also increasing the ambit of human knowledge. One might also work on designing a data science course from others to learn from.

  1. Proper Pathway

While being a data scientist requires a lot of work, the exact path to such a goal has been charted time and time again. There is a great degree of resources available now to become proficient in various aspects related to the data sciences. Other than doing a basic data science course, one may partake in learning various related fields like programming and big data processing from various online platforms (e.g. Imarticus learning).

  1. Demand Doesn’t Slack

The demands for data sciences have also increased due to the new atmosphere generated by Covid-19 and the near-worldwide lockdown because of it.

Data Science Roles

It has been studied that 50% of the data science organization showed no slow-down and have seen growth. This requires one to find new ways to collect data, as well as use that data to aid in multiple projects. These may involve helping set up new modes of businesses, and helping older businesses change their plans to suit their new circumstances. Furthermore, it may aid in improving a range of services on a global level.

  1. Diverse Skillsets

It is easy to switch into being a data scientist incorporating your present skillset. Whatever your present occupations and/or interests may be, it can lend an avenue to collecting data on that specific domain.

Data Science TrainingThey can complement these skills with learning standard data sciences’ skills. Former data analysts may also expand on their present sphere of knowledge to become data scientists, with relative ease.

  1. An Expanding Field

In 2021, a lot of past data science models are up to open-source scrutiny. Hence, even in this new field of human knowledge, one can have a sizable understanding of multiple avenues of collecting and processing data. Their entry into data sciences will work to expand on this field of knowledge.

In conclusion, one can see that it is indeed highly fruitful to be a data science in this present day and age. One can channel his/her present skillset into this occupation as well and aid a burgeoning field of human growth and knowledge.

Python Developer Salary in Terms of Job Roles

What is Python?

The second most liked Programming language in the world, Python is one of the widely used term in the web-development world.

Who are Python Developers?

The web-developers who design and code the software applications with the help of Python language are referred to as Python Developers.

Roles and responsibilities of Python Developers

 Python Developers as Data Scientists

Major businesses in today’s world require tools and skilled people for the data-related tasks such as data collection, data cleaning and processing.

Python Programming Course with Data ScienceData Scientists are the programmers who do these tasks for the organizations. Data Scientists gather a large quantity of data and convert it into a useful form, followed by recognizing data-analytics solutions for organizational growth.

Data Scientists encourage the data-driven approach in organizations to deal with complex business problems.

 Artificial Intelligence

In AI Python Developers create and implement the required Machine Language algorithms. They analyze the success and failure of the algorithm and rank them according to their performance for future use. Training and Retraining ML algorithms is one of the key tasks performed by Python Developers.

Salaries of Python Developers in India

The changing focus of the organizations on data-driven solutions is resulting in a manifold increase in the salaries of the Python Developers. In the coming years the demand for AI-skilled people will increase, and hence the salaries.

Major IT giants like Google, YouTube, Amazon etc. are adopting Python-driven systems and hence, manifold increases in the salaries of the Python Developers.

Python Programming Course with Data scienceThe entry level salary of a Data Scientist is approximately INR 500,000 per annum (Source: payscale.com) Data scientists with 5-9 years of work experience gets +100% more salary in India. With the experience and refinement of the skill, the salary of Data scientists shows exponential growth.

 An entry-level engineer who develops the ML Algorithms earns the average salary of approximately INR 700,000 annually. With further experience and refinement of the skills, the average salary of the Data Scientist shows exponential growth.

Factors affecting the Salaries of Python Developers

Job location: Considering the increasing demand of Python Developers, not only in India, the faster salary growth is visible in UK and in US.

Location

Approximate Average Salary in INR

Gurgaon

700,717

Bangalore

669,787

Delhi

600,000

Mumbai

579,728

Chennai

540,131

Hyderabad

475,000

UK Python Developer annual salary

£67,000

US Python Developer annual salary

$117,000

Experience:

Python Developer

Approximate Salaries in INR

Entry Level Python Developer

427,293

Med-Level Python Developer

909,818

Experienced Python Developer

1,150,000

Refined Skills:

Mere understanding of the Python is of no use, till is integrated with the problems and solutions. How one uses the well-known Python tools define the person’s skill set, which is a determiner of the salary.

Job Role:

Python Developer

Approximate Average Salary in INR

Data Scientists

700,000

ML Engineer

670,000

DevOps Engineer

660,000

Software Engineer

500,000

Web Developer

300,000


Python Programming Course with Data ScienceShould know more interesting things about Python programming training and Python career.


Which Career Is More Promising: Data Scientist or Software Developer?

As per a study, about 2.5 quintillion bytes of data are produced every day. The number is about to increase by many folds in the future. The pace at which data is being generated demands more data science professionals. That’s the reason data science jobs are now regarded as one of the highest-paid jobs across the globe. And, people are joining data science training to explore a career in data.

As, firms are hiring employees who can build technical applications, and collect, analyse and predict data. That’s the reason students are enroling in data science training courses that are best and give job assurance.

Companies are keen to employ data scientists, data analysts, web developers, full-stack developers, and much more technology professionals. According to Imarticus Learning and Analytics India Magazine’s research, there will be a 30.1% increase in data science and analytics jobs in 2022 compared to 2021.

However, more competition in Information Technology requires software career enthusiasts to learn the latest technology for survival. The primary responsibility of data scientists is business analytics. They also work on constructing data and software products using algorithms. The demand for data scientists is high due to the shortage of skilled people for start-ups and corporates. Global companies are searching for professional data scientists to up their game in this competitive world.

Who is a data scientist?

Data scientists collect and interpret large amounts of structured and unstructured information. They analyse, process, and model data before interpreting the findings to develop actionable plans for businesses. The data scientist uses computer science, statistics, and mathematics for data interpretation.

Who is a software developer?

Software developers are the thinkers and doers behind computer programs of all kinds. While some software developers specialise in a single program or application development, others build massive networks or underlying systems that trigger and power other programs. As a result, there are two types of developers: applications software developers and systems software developers.

The approach of data scientists and software developers

To use and organise data in a structured or unstructured form, a data scientist becomes essential and can master the art with the right Data Science Training. Hence, there is a need for a data scientist, with sound knowledge of handling data that demands the best data science training and experience.

Software developers collaborate with computer programmers to test the convenience of using a software program. The component that powers digital systems is software which is the core element of computers. To be precise, software engineering can be termed as the application of engineering principles for designing, structuring, developing, and implementing software. An efficient software developer understands the client’s needs and then develops the software as a solution to the client’s needs.

Important tools used in software development and data science

To be productive, data science career aspirants should be knowledgeable about statistics, software programming, and analytical thinking. In addition, a data scientist should have the urge to learn and be updated about new programming languages.  Python, Swift, and Ruby, apart from mastering SQL, Spark, machine learning, and Hadoop are the most important to learn.

A software developer should know the latest programming languages along with a bachelor’s degree in computer science. A good understanding of computer programming by understanding the functionality of new tools is a plus. Along with various skills, a software developer should possess to flourish in the field of analytical skills. Followed by attention to detail, creativity, problem-solving techniques, and interpersonal skills are vital.

The pay scale for data scientists versus software developers

A report from Payscale.com reveals that the median salary for a data scientist is around 6,00,000. It is not much different in the US. According to a survey by Glassdoor, the median salary for a data scientist is $91470, which is great. So, it is evident that data science can offer ample money and growth. But, the salary also depends on the qualifications, skills, experience, and location. Firms also play a vital role in deciding the pay. 

Currently, the median salary for software developers is $1,00,80 and the growth in employing software developers is set to increase by 24% in a decade. In addition, an estimate states that there are 3.7 billion mobile users worldwide. It demands newer and better applications for smartphones and tablets. It increases the demand for software developers globally. Factors that affect the salary of a data scientist are similar to those of software developers. 

Roles and job titles for a career in data science versus software development

A few important job titles that a data scientist can do are data architect, data scientist, and business analyst. In fact, the roles of data administrator, and business intelligence manager are also in demand. Global companies in the digital world, like Facebook, Twitter, IBM, and Apple, are racing to hire the best data scientists. So, the demand for data scientists is growing like never before.

Some of the interesting career options that connect to software developers are Computer programming. Computer system analysts, web developers, computer network architects, and computer hardware engineers are also on the list. Though data science is a relatively newer concept than software development, it is increasing rapidly. 

Conclusion

This article has showcased the digitisation, technology, data rise, and demand of technology professionals. The high demand for data scientists, and software developers have given rise to the skills gaps. If you are eager to learn new tools for efficient data handling, you can grab a chance to flourish as a data scientist in the long run. Enrol for the best data science training course and enter the world of data.
But, selecting the best institute for data science training is not easy.

You should enquire about the faculty, course curriculum, and the job assistance that they provide. It is always good to get interview assistance, career monitoring, and resume-building tips from the experts. If the institute provides all this then it is the best for the learners.

It should be your priority to learn coding and programming if you want to become a software developer. Furthermore, the amount of data being produced every day is high, which signifies long-term growth and attractive salary await a talented data scientist. So, in the end, we can say that both careers in data science and software development are promising. It depends on individual preferences and interests. Both, career options are good and offer career growth. 

For more details, you can also search for – Imarticus Learning.  You can drop your query by filling up a form from the site. You can also contact us through the Live Chat Support system. To explore more you can visit one of our training centers based in – Mumbai, Thane, Pune, Chennai, Bangalore, Hyderabad, Delhi, and Gurgaon.

Advanced Data Science Skills to Stay Relevant in the Post-Pandemic World!

The need to upskill to meet the dynamic demands of a technology-first world has been around for the past few years; it has only become more urgent in the wake of the COVID19 pandemic. The emergence of new technologies such as Artificial Intelligence, machine learning and data science has set the tone for the future.

Data Science

In the post-COVID19 world, there are a few advanced data science skills that, when added to the toolkit of a data scientist, can make or break their career.

To ensure that your core competencies are strengthened as a data scientist, you can sign up for a comprehensive data science training course that explores the following:


#1: Geospatial Technologies

 With more people working on data-driven decision processes, geospatial data has helped better planning and processing of the system. This knowledge has proved invaluable in tracking the COVID19 outbreak all over the world; come the near future, geospatial technology will likely be extended to other research areas as well.

Data Science

A geospatial data scientist will need to sift through vast geographic and demographic datasets that hide gold nuggets of insight across diverse research topics.


#2: Natural Language Processing (NLP)

NLP gained traction even before the pandemic reared its ugly head. That said, it is only set to increase in importance and reach in a post-pandemic world. Natural Language Processing

Most organisations often implement self-service systems, such as bots that come with multi-language optimized NLP to help solve customer problems.

Data scientists of the future must understand NLP and master it enough to help companies develop automated solutions for a better post-COVID outcome.

#3: Computer Vision

Computer vision is an artificial intelligence field which trains computers to interpret and comprehend the visual world. It uses digital images from cameras and videos as well as deep learning models to recognise and distinguish objects correctly. With the help of algorithms, computer vision is also integrated to follow up with a programmed response. In current scenarios, computer vision has proved helpful in containing the outbreak and regulating quarantines and social distancing in cities across the world. In the future, where maintaining distance might become the norm, data scientists specializing in computer vision will automatically become more hire able.

#4: Data Storytelling

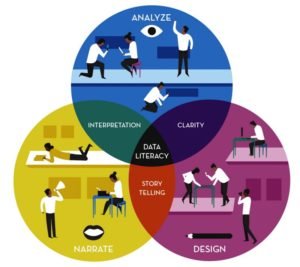
With data analytics becoming a prime concern for companies across industries, the need for good data storytelling has increased. The benefit of data analysis is not just in the evidence it provides but also in how it is made meaningful and impactful. Gripping storytelling makes it easier for non-data-scientist stakeholders to understand the value of the information and the possibilities it poses.

Data presented as contextual stories, rather than isolated data points, makes individuals more likely to understand the impact, decipher patterns and make more informed decisions.
In turn, as data storytelling would help business leaders with powerful insights, it would help them better prepare for the post-pandemic world’s opportunities.


#5: Explainable AI

Considering that AI has reached into nearly every area of human life, companies must be able to trust computers and their decisions. This is where the need for explainable AI emerges. Until now, companies build and sourced AI models that predicted accurate insights from large data dumps. In a post-pandemic world, they may well shift to models that also provide explanations for predictions. Explainable AI is a step forward in reducing the mistrust in non-human workflows. It makes AI systems more transparent and much fairer and all-inclusive than they were earlier.

Conclusion

Advanced data science skills are crucial to the cause of innovation and growth. Advanced upskilling is an integral step for data scientists looking to become more than relevant in the coming years.

Welcome to the Data Science Club of Imarticus Learning!

Imarticus Learning is among the top online education providers in India. After its data science course helped many data science aspirants to build a successful career in the industry, it has now come with a new campaign i.e. the ‘Data Science Club’. This club will aim at addressing the shortage of data scientists in India. It will also help in unifying data science aspirants from all over the country & giving them a chance to interact.

Data Science CourseYou can bring the data science club to your college/university with just a simple process. They already have registered 30 colleges from locations like Delhi, Tamil Nadu, and Karnataka.

The registration process is open & you can experience a whole new aspect of data science. One can also join the data science community of Imarticus on various social media platforms.

Mission & Vision of the Data Science Club

  • To promote students across India to build a successful career in data science.
  • To address the talent gap in the data science industry & shortage of skilled data scientists in India.
  • To facilitate the exchange of ideas & information relating to data science between club members across PAN India.
  • To provide industry-oriented learning of data science involving technological advancements & tools used in the industry.

Registration Process

Generally, most of the colleges don’t even have a data science club. You could be the first to introduce a data science club at your college/university. You can visit the Imarticus website and can easily register your college/university for the data science club. You will be required to fill a google form asking for a few details like college name, address, department, designation, email address, etc. The Imarticus panel will get back to you and will inform you about further proceedings.

Benefits of Being a Club Member

This data science club will facilitate its members from various colleges across India in understanding the importance of data science. It aims at motivating aspirants for building a successful career in data science and bridging the talent gap in the current data science industry. The benefits of joining the data science club of Imarticus are as follows:

  • Students of member colleges can attend any event/competition under the data science club for free.
  • You will get to attend lectures or webinars from industry experts/professionals.
  • The members of the club will get to test themselves by participating in the national level hackathon.
  • You will get to attend data science workshops under this club. You will also get a certification from Imarticus Learning for being a part of the data science club.
  • The members of the club will also undergo the faculty development programme.
  • Eligible members/students of the club will also get full placement support from Imarticus.
  • You will get to know about the industry practices & trends by being a member of this club. You will also get to know about the right career roadmap in the data science industry.

If you want to make a transition from data science aspirant to an expert, you have to grab this wonderful opportunity which will bring you closer to the data science community in India. One can also opt for the data science course provided by Imarticus Learning to know about the data science aspects in detail.

Register for the data science club now!

3 Tips on Building a Successful Online Course in Data Science!

3 Tips on Building a Successful Online Course in Data Science!

The coronavirus pandemic is undoubtedly one of the biggest disruptors of lives and livelihoods this year. Thousands of businesses, shops and universities have been forced to shut down to curb the spread of the virus; as a result, massive numbers have turned to their home desks to work from and to tide over the crisis.

The pandemic has also influenced the surge of a new wave of interest in online courses. Over the past few months, many small and large-scale ed-tech companies have sprouted up, bombarding the masses with a wider range of choices than ever before. Many institutions have chosen to give out their courses at a minimal price and yet others for free. The format of these classes is different– hands-on, theoretical, philosophical, or interactive– but the ultimate goal is to take learning online and democratize it.

Naturally, it’s an opportune time to explore the idea of creating an online course– a data science online course, in particular, seeing as futuristic technologies will see a profound surge in attention come the next few years.

Here are a few tips to get the ball rolling on your first-ever online course in data science:

  • Create a Curriculum

Data science is a nuanced and complex field, so it won’t do to use the term in its entirety. It is important to think up what the scope of your course will be. You will need to identify what topics you will cover, what industry you want to target (if any), what tools you might need to talk about, and how best to deliver your course content to engage students.

education

General courses are ideal for beginners who don’t know the first thing about data science. This type, of course, could cover the scope of the term, the industries it’s used in as well as job opportunities and must-have skills for aspirants.

Technical courses can take one software and break it down– this is also a great space to encourage experiments and hands-on projects. Niche courses can deal with the use and advantage of data science within a particular industry, such as finance or healthcare.

  • Choose a Delivery Method

There are a plethora of ed-tech platforms to choose from, so make a list of what is most important to you, so you don’t get overwhelmed. Consider how interactive you can make it, through the use of:

  1. Live videos
  2. Video-on-demand
  3. Webinars
  4. Panels
  5. Expert speakers
  6. Flipped classroom
  7. Peer reviews
  8. Private mentorship
  9. Assessments
  10. Hackathons
    Education

The primary draw of online classrooms is also how flexible they are. Consider opting for a course style that allows students to learn at their own pace and time. Simultaneously, make use of the course styles listed above to foster a healthily competitive learning environment.

  • Seek Industry Partnerships

An excellent way to up the ante on your course and set it apart from regular platforms is to partner with an industry leader in your selected niche. This has many advantages– it lends credibility to your course, brings in a much-needed insider perspective and allows students to interact outside of strict course setups. Additionally, the branding of an industry leader on your certification is a testament to the value of your course; students are more likely to choose a course like yours if this certification is pivotal in their career.

EducationOther ways by which you can introduce an industry partnership include inviting company speakers, organising crash courses on industry software and even setting up placement interviews at these companies. The more you can help a student get their foot in the door, the higher the chances of them enrolling and recommending.

Conclusion
Building an online course in data science is no mean feat. However, it’s a great time to jump into the ed-tech and online learning industry, so get ready to impart your knowledge!

Data Literacy Is Very Much a Life Skill– Here Are 4 Reasons Why?

The world is no stranger to data; in fact, in recent times, the world has found itself being bombarded by more facts and statistics than ever before. At quite the same speed, people have also been faced with fake facts, viral social media forwards with little to no truth.

Being data literate has moved from being a niche requirement to being a life skill that allows people to distinguish between fact and fiction. Data literacy is a way of exploring and understanding statistics in a manner that provides meaning and insight.

This meaning isn’t relegated only a data science career or to businesses looking for an edge over competitors. It applies to society and its interconnected systems as a whole.

To drive the point home, here are a few advantages that data literacy offers when looked at as a life skill:

Recognising the Sources of Data

Data is everywhere, especially in a world where nearly everything is digital and produces and consumes more data. There are many different ways in which data exists, including graphs, images, text, speech, video, audio and more. Recognising the different sources of data is the first step towards working with data. The sources, formats and types all have a role to play in determining the use (and potential misuse) of data, which in turn drives data literacy.

Acknowledging the Self as a Consumer and Producer of Data

The messages you send, images you post and likes you leave on social media are examples of data. So are the transactions you make and the searches you conduct on search engines such as Google and Bing. Today, nearly every single person in the world is a data producer; those sources of data are vital to value-generating processes across industries and markets.

Similarly, people are daily consumers of data even if they don’t perceive it as that. The COVID19 pandemic has brought this into the light even further– front page statistics are at the back of everyone’s mind, as are the names of containment zones and the best practices for sanitisation.

Recognize Biases and Fallacies

Data literacy gives the people more agency to call out those producing statistical data that is biased, twisted or outright incorrect. As citizens, consumers and valued members of a society, it is imperative that every individual is able to identify false promises or glossed-over issues that allow wrong-doers to continue as they were.

Data ScienceData literacy gives people the power and the evidential backing to call out those intentionally or unintentionally propagating mistruths and fallacies through awry statistics. This way, data literacy plays a pivotal part in politics, economics and ethics of a society, indeed of the world.

Improves Data Storytelling

Instead of data points presented on their own, data that is presented as descriptive stories make individuals more likely to understand the effect, decipher trends and make more educated decisions. While data storytelling is imperative to learn for those taking a data science course, it is just as important for members of all other fields to better present their arguments such that they catch eyes.

Data has never been a strictly academic factor; however, it has often been painted as complicated, invasive or unnecessary to penetrate everyday lives. Data storytelling ensures that data is taken even further out of that box and presented as actionable insights to even the average Joe Bloggs.

Conclusion

The focus on data science and literacy shouldn’t just be restricted to mathematics and algorithms but everyday applications of data in daily lives. Data understanding allows people all over the world to take more control of what they’re producing and consuming. Data fluency and literacy is achievable by all.

How Imarticus Helps For A Data Science Career in Pandemic Times?

Data-driven strategies have shot up in popularity after the coronavirus pandemic wreaked havoc on business plans. Data science is a key player in sustaining businesses not just now, but in the future when similar turbulent circumstances threaten to bring down shutters on previously stead organisations.

As a result, hundreds of companies across India and overseas are looking to add more data scientists to their repertoire. This comes from a need to drive more data-driven decisions and make businesses more resilient to change.

Here are some specific reasons that make a case for how choosing a data science career can be beneficial in times like these:

  • A need for general expertise

While previously companies favored data science specialists, today they prefer generalists and Jacks of all trades. While specialists come with in-depth knowledge and specific skill sets, they often cannot think beyond their domain. Companies today need someone who has skills to use across the board so that they can both learn on the job and be useful where they’re needed.

  • A need for understanding project flows

Many companies who are delving into data science now are probably unsure of their footing and their way forward.

Data Science CourseA data scientist is critical in companies like these, as they bring expertise to the table and understand the flow of projects much better than anyone else. With a data scientist at the helm, all other players in the process can fall into place. This reduces the pressure on upper management to figure out project flows; they can now leave it to the experts.

  • Higher chances for growth

Data scientist generalists are more likely to grow with the company– something many organisations prefer. Unlike a specialist, who already has a defined skill set, rookie data scientists can be shaped and molded into an ideal employee for the company. In the process, the data scientist becomes an intrinsic part of the organisation, learns business tactics and applications and develops skills through experience rather than through specializations. As a result, they become both experts and creative problem-solvers.

  • Immediate requirements

Businesses are struggling to stay afloat during the aftermath of the pandemic and are realizing their urgent need for data-driven business plans. As a result, many of them have put out feelers and immediate job offers for data scientists. This is in complete contrast to other fields that are seeing scores of job cuts, furloughs and pink slips, and goes to show that data science is only increasing in popularity.

It is worth keeping in mind that, despite recruitment into data science roles, many companies have slashed budgets and can’t afford to pay more experienced scientists at this stage. Rookie data scientists form the perfect compromise–  they’re eager to learn, have the necessary skills and can be accommodated within tighter budgets without reduced salaries.

  • Opportunities for upskilling

As rookie data scientists settle into their roles, many companies consider upskilling them for higher positions or specific technical projects.

Data Science CareerThis is an invaluable opportunity for fresh data scientists as the company takes care of all the costs and only asks for your attention and application in exchange. Adding a data science course to your CV will also help you get a leg up on the competition when you’re ready to switch roles or companies.

The final word

The data science landscape has shifted significantly in response to the coronavirus pandemic. As a result, rookie data scientists who are only just entering the field have a once-in-a-lifetime chance to make their mark and cement their place for when things stabilize.