Exploratory Data Analysis: How to Make Sense of Raw Data

In today’s data-driven world, organisations generate vast amounts of raw data daily. However-raw data by itself is meaningless unless properly analysed. This is where Exploratory Data Analysis (EDA)-comes in. It helps uncover patterns, detect anomalies, &extract valuable insights from raw data.

EDA- is the first crucial step in data analysis, allowing analysts and data scientists to understand the dataset before applying advanced models. By… leveraging data preprocessing methods, data visualization techniques, &statistical analysis in data science, businesses can make data-driven decisions with confidence.

In this blog…we will explore the importance of EDA, its key techniques, &how tools like Python for exploratory data analysis simplify the process.

What is Exploratory Data Analysis (EDA)?

Exploratory Data Analysis (EDA)- is the process of summarising, visualising, and interpreting raw data to uncover patterns, relationships, &trends. The goal is to clean the data, identify missing values, detect outliers, &understand its distribution before building predictive models.

EDA is a critical step in data analysis because it helps:

  • Identify missing or inconsistent data
  • Detect anomalies and outliers
  • Understand variable distributions
  • Reveal relationships between variables
  • Generate hypotheses for further testing

With the right approach, EDA ensures high-quality data that can be used effectively in machine learning and business intelligence applications.

Step 1: Data Cleaning and Transformation

Before diving into data analysis, the first step is to clean &preprocess the data. Poor-quality data can lead to inaccurate insights, making this…step non-negotiable.

Common Data Cleaning Techniques

  • Handling missing values (imputation or deletion)
  • Removing duplicate records
  • Correcting inconsistencies in categorical variables
  • Standardising formats (e.g., dates, currency values)

Data Transformation Methods

After cleaning, data transformation is necessary to make the dataset usable for analysis. This includes:

  • Normalization & Scaling – Adjusting numerical values to a standard range
  • Encoding Categorical Variables – Converting text labels into numerical format
  • Feature Engineering – Creating new variables to improve model performance

By applying data cleaning and transformation, we ensure that the dataset is structured, consistent, &ready for deeper analysis.

Explore career opportunities in data analytics

Step 2: Descriptive Statistics for EDA

Once the data is cleaned, the next step is to summarise it using descriptive statistics for EDA. This includes measures of central tendency (mean, median, mode) &measures of dispersion (variance, standard deviation).

Key Descriptive Statistics in EDA

  • Mean – The average value of a dataset
  • Median – The middle value in an ordered dataset
  • Mode – The most frequently occurring value
  • Variance – Measures how spread out the data points are
  • Standard Deviation – Square root of variance, indicating data dispersion

These statistics provide a quick summary of the dataset, helping analysts detect skewness, anomalies…inconsistencies.

Step 3: Data Visualization Techniques for EDA

A picture is worth a thousand words, and in data analysis, visualisation helps make sense of complex datasets. Data visualization techniques allow analysts to identify trends, outliers, &relationships in a more intuitive way.

Popular Data Visualization Techniques

  • Histograms – Show frequency distribution of numerical variables
  • Scatter Plots – Display relationships between two numerical variables
  • Box Plots – Detect outliers and understand data spread
  • Heatmaps – Visualise correlations between multiple variables

Watch this video to understand EDA better

Using these data visualization techniques- businesses can transform raw data into actionable insights.

Step 4: Statistical Analysis in Data Science

Beyond visualisation, statistical analysis in data science provides deeper insights by applying mathematical techniques to test hypotheses and validate data trends.

Common Statistical Tests in EDA

  • Correlation Analysis – Measures the strength of relationships between variables
  • T-tests & ANOVA – Compare means across different groups
  • Chi-square Test – Checks relationships between categorical variables
  • Regression Analysis – Identifies patterns for predictive modelling

Applying statistical analysis in data science ensures that the conclusions drawn from EDA are statistically valid and not just based on random patterns.

Learn how machine learning is shaping the future

Step 5: Using Python for Exploratory Data Analysis

Python- is the go-to language for exploratory data analysis due to its powerful libraries and ease of use.

Essential Python Libraries for EDA

  • Pandas – Data manipulation and analysis
  • Matplotlib & Seaborn – Data visualisation
  • NumPy – Numerical computing
  • Scipy & Statsmodels – Statistical analysis

A simple Python for exploratory data analysis workflow involves:

  1. Loading data using Pandas
  2. Cleaning and preprocessing data
  3. Applying descriptive statistics
  4. Visualising trends with Matplotlib or Seaborn
  5. Performing statistical tests-using Scipy

Check out these machine learning projects in analytics

Final Step: Gaining Insights from Raw Data

The ultimate goal of EDA is to extract meaningful…insights from raw data that drive business decisions. By integrating data cleaning and transformation, data visualization techniques, &statistical analysis in data science, analysts can uncover hidden trends and actionable intelligence.

Some real-world applications of EDA include:

  • E-commerce – Identifying customer purchasing trends
  • Healthcare – Detecting disease patterns from patient records
  • Finance – Spotting fraudulent transactions
  • Marketing – Understanding customer segmentation

Learn Data Science and Analytics with Imarticus

Exploratory Data Analysis is a must-have skill for aspiring data professionals. If you want to master data analysis, Python for exploratory data analysis, &data visualization techniques, check out… the Postgraduate Program in Data Science & Analytics by Imarticus Learning.

This industry-recognised program offers:

  • Comprehensive training in data science tools
  • Real-world projects for hands-on learning
  • Placement support with top companies

Kickstart your Data Science career today.

FAQs

1. What is Exploratory Data Analysis (EDA)?

Exploratory Data Analysis (EDA)- is a crucial step in data analysis that involves summarising, visualising, and interpreting raw data. It helps identify patterns, detect anomalies, &prepare the data for further modelling.

2. Why is data cleaning and transformation important in EDA?

Data cleaning and transformation ensure that the dataset is accurate, consistent, &structured. Removing errors, handling missing values, &standardising formats are essential for meaningful data analysis.

3. What are some popular data visualization techniques in EDA?

Common data visualization techniques include histograms, scatter plots, box plots, &heatmaps. These visual tools help analysts understand relationships, distributions, &trends in data analysis.

4. How does statistical analysis in data science help in EDA?

Statistical analysis in data science helps validate patterns and relationships in data using techniques like correlation analysis, regression models, &hypothesis testing. It ensures- that insights are statistically sound.

5. What role does Python play in exploratory data analysis?

Python for exploratory data analysis is widely used due to its powerful libraries like Pandas, NumPy, Matplotlib, &Seaborn. These tools enable efficient data manipulation, visualisation, &statistical evaluation.

6. What are descriptive statistics for EDA?

Descriptive statistics for EDA include measures like mean, median, mode, standard deviation, &variance. These help summarise datasets &provide insights into data distributions.

7. How do data preprocessing methods improve data analysis?

Data preprocessing methods such as normalisation, feature engineering, &encoding categorical variables help refine raw data. These steps improve the accuracy &reliability of data analysis outcomes.

8. How can EDA help in improving machine learning models?

EDA helps identify key features, detect outliers, and understand data distributions, which are crucial for building accurate machine learning models. By uncovering patterns and relationships during EDA, data scientists can select the right algorithms and optimize model performance.

9. What are the common challenges faced during EDA?

Some common challenges include dealing with large datasets, handling missing or inconsistent data, identifying subtle outliers, and interpreting complex relationships. Effective EDA requires strong analytical skills, domain knowledge, and the right tools to overcome these hurdles.

10. Can EDA be performed on unstructured data like text or images?

Yes, EDA can be performed on unstructured data such as text or images. For text data, techniques like word frequency analysis, sentiment analysis, and topic modeling are used. For images, EDA involves analyzing pixel distributions, identifying patterns, and using image processing techniques to extract meaningful features.

Conclusion

EDA is the foundation of data analysis, helping businesses and data scientists make sense of raw data before applying advanced models. By leveraging data preprocessing methods, descriptive statistics for EDA, &data visualization techniques, professionals can extract meaningful insights from raw data and drive informed decisions.

If you’re looking to-master Python for exploratory data analysis &accelerate your career in data science, explore the Postgraduate Program in Data Science & Analytics at Imarticus Learning today.

What Are The New Advancements In Data Analytics?

Data analytics is a field which witnesses a continuous revolution. Since data is becoming increasingly valuable with each passing time, it has been treated with great care and concern. New tools, techniques, theories, and trends are always introduced in the data analytics sector to cope with the constant changes in the industries and societies. You can opt for a sought-after data analytics course to get a deeper understanding.

In this article, we will go through some of the latest data analytics opportunities which have come up in the industry.

The Intelligent Data Mesh

The intelligent data mesh has been termed the next revolution in healthcare and medical diagnostics systems in the coming years by the Gartner Top 10 Strategic Technology Trends in 2018.

The “Intelligent Data Mesh” has been described by Gartner as a meeting point of the physical and digital worlds where humans, machines, data, and services have been entwined together into a mesh.

The purpose is to gather the benefits offered by all these individual entities into a single unit to find solutions to complex issues thought to be insolvable until now.

One major industry expected to benefit most from this system is the healthcare industry where Intelligent Data Mesh is being hailed as a game-changer in enhancing patient care.

Blockchain

Blockchain continues to be an exciting technology even in 2018 and is expected to remain so for at least another decade. New advancements are being made almost daily regarding this technology as blockchain finds wider uses in various industries with time.

It will not be wrong to describe blockchain as one of the greatest data analytics opportunities. The concept of blockchain started with the idea of a decentralized digital currency which came to be known as Bitcoin in the market.

However, even though the controversy regarding the currency rose the concept of a decentralized and open-source peer-to-peer modeled technology for storing and analysing data. The concept of blockchain is now applied in a wide range of industries with its use predicted to keep rising soon.

Artificial Intelligence

Artificial intelligence is one such data analytics opportunity which is finding widespread adoption in all businesses and decision-making applications. As per Gartner 2018, as much as 41 percent of organizations have already adopted AI into some aspect of their functioning while the remaining 59 percent are striving hard to do the same.

There is considerable research going on at present to incorporate artificial intelligence into the field of data science too. With data becoming larger and more complex with each passing minute, management of such data is getting out of manual capacities very soon. Scholars have now turned to AI for storing, handling, manipulating and managing larger chunks of data in a safe environment.

Augmented Reality

Augmented Reality is an interesting new technology coming up in recent years. As a source which facilitates the interaction between machine and humans in a unique manner, AR has the potential to be a game-changer in the field of data sciences making it another top data analytics opportunity in the future.
best big data analytics course

AR can provide for the development of simpler UIs for the man-machine interaction when merged with AI allowing the users to store and interact with data in a completely new manner.

Imagine going to an island where all your data is stored in different treasure chests and you are provided with customised keys to access the chests with your data in it. These things may be possible in the future because of the use of AR in data analytics. 

Imarticus Learning offers select best data analytics courses that not only boosts your skillset but also your career as a whole. 

Frequently Asked Questions

What is a data analytics course?

Data analytics involves examining raw data to extract valuable and actionable insights. These insights, once gleaned, serve as the basis for informed and strategic business decisions, contributing to the enhancement of overall business intelligence.

Do data analysts require coding?

Certainly, coding is a fundamental requirement when undertaking an online Data Analytics Degree. While highly advanced programming skills may be optional, mastering the basics of R and Python is crucial. Additionally, a solid command of querying languages such as SQL is indispensable for a comprehensive understanding of data analytics.

Is Python a mandate for data analysts?

Possessing a thorough grasp of Python programming proves highly advantageous for data analysts. Employers commonly anticipate proficiency in utilizing Python libraries to streamline various data-related tasks. Consequently, acquiring skills in Python emerges as a prudent and strategic career decision for aspiring data analysts.

Edge Vs Cloud: Which Is Better For Data Analytics?

What is Edge Computing?

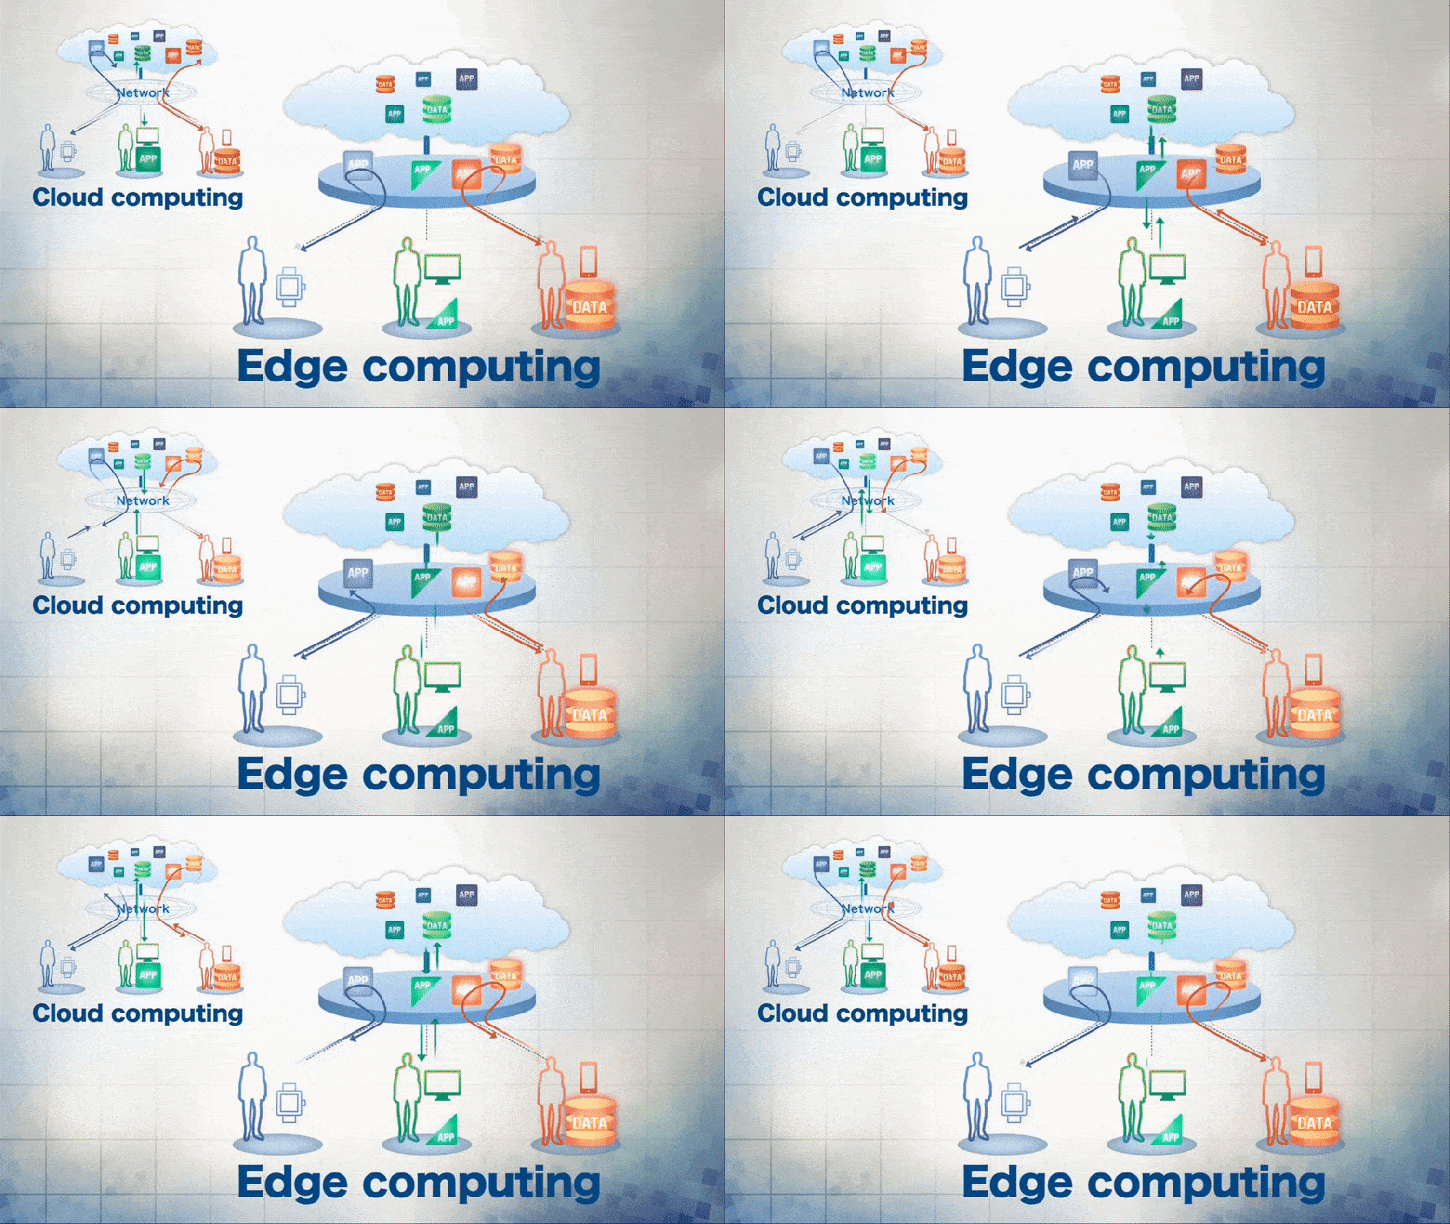
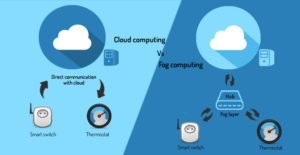
Edge computing is a segregated topology which serves to bring processed information closer to the device that is gathering the data rather than relying on a central unit which would be located much farther away.

What is Cloud Computing?

Cloud computing involves the process of delivering important information and services such as storage without the need for involvement of active management.

Which Out of the Two Is Better For Data Analysis?

In today’s world where AI has become an extremely important part of our lives, developers are looking to merge the devices we use on a day-to-day basis with artificial intelligence to make running businesses easier for organizations.

In such cases, we must look at the various computing methods that can make this possible in an efficient manner. Here, you would think that cloud computing would hold an important position in making the most suitable and ideal decisions. Platforms which are based on cloud allow developers to quickly create, deploy and handle their applications.

These would include playing the role of a platform of data for applications, application development which would help bridge the gap between data and users, and so on. It is popular for its flexibility with data storage and the ability to perform analysis processes.

On the other hand, edge computing allows applications and various other analytical and service processes of data to be done away from a central data unit, bringing it nearer to end-users. It allows the processing to take place within the locally available resources, thus bringing it a step back from the intricately planned cloud model where data processing happens in specific data centres.

Let us dive into this further in detail.

Cloud vs Edge Computing: Latency Problems

Cloud computing is used extensively across various organizations and companies for data analysis. However, there may be situations where a business may face problems in collecting, transporting and analysing the data given.

Edge and cloud computing for Data AnalyticsWhen data is transferred to a remote cloud server, it allows the user to perform various complex algorithms with machine learning and thus predict the maintenance needs of a particular section. This is then forwarded to a dashboard on a personal system where one can determine what decisions are to be made further. This is all done comfortably from home or the office.

This is great, however, as one begins to increase the intensity of operations, one may begin to run into issues such as physical limitations on the bandwidth of the network and thus also latency issues.

Edge computing does a great job at reducing latency issues by involving a local server, maybe even on the device itself. The only difference here is that the issue with latency is solved at the expense of the processing power offered by cloud computing methods.

Businesses, with edge computing, are now being able to decrease data volumes which would need to be uploaded and stored in the cloud. This thus makes the process of data analysis less time-consuming.

Edge computing may still interact with other website applications and servers. It includes physical sensor thus allowing it to help run smarter algorithms and facilitate real-time processing which is used in smart vehicles, drones and smart appliances. It may not be as strong as a remote server, but it helps reduce the bandwidth strain that one would normally face with cloud computing.

Data Analytics CareerA big data analytics courses would help equip a person aspiring to work in the field of data analysis with all the information that would be necessary. A big data analytics career is a good option because it is an ever-expanding field with a large number of opportunities!

How Can Data Analytics Help Insurance Companies Perform Better?

It is the question that has already been asked after it was on everybody’s mind for a long time. How can big data help insurance companies – a heavily regulated sector in India and everywhere else in the world – and make them perform better? Especially when it comes to preventing frauds, system gaming, and other illegal activities that are prevalent.
With the competition only rising in the insurance sector, what company makes headway in properly using data analytics and acts a role model remains to be seen. So, in order for us spectators to do that, we will need more information.
How exactly can analytics help insurance companies serve their customers better? There are four major ways.

Use of Data Analytics in the Insurance Sector

Apart from gaining customer insights and helping in risk management, data analytics training can also help understand if it’s worth handing out an insurance policy to a person based on his social stature. How does his social media presence look like? What are his hobbies and adventurous choices? Has he lied in his application? All of this can also be extracted through the proper use of data capturing and analytics tools.
It seems extremely lucrative for the companies but it also poses a risk for us customers who stare at a possible invasion of our personal space and privacy. Having our social media accounts stalked by HR professionals for the purpose of employment is one thing (not a decent task, nonetheless). Having strangers do the same so that they can deny you insurance – which let us remind you is a basic necessity in today’s times – is a big event. It is not to say that this will be the majority outcome but it is what is on the mind of insurers when they consider big data.
Let us look at those four different ways in which analytics can help insurers:

Managing Claims

This is by far the biggest reason why insurers are pushing for use of predictive analytics in the sector. As you can imagine, it can help companies create a database of customer information that can then be used to compare new policy buyers and see if they fall in a bracket of people who might commit fraud such as wrongly filing for a claim.
The insurer can feed the model with past data and then use it to classify its new customers. Since the approval or rejection of a file is more or less under the authority of the insurer, this can help them denying insurance to a possible fraudulent applicant.

Generating Claims Based on Data

This involves checking the profile of a person while she applies for insurance. For example, in the case of house insurance, data can help insurers understand if this specific house is vulnerable to natural incidents; is it closer to the fire station; what is the history of the locality for the past twenty years as far as mishaps are concerned. When we talk about data, there is a lot of scopes.
And when it’s time to act, this collection of data can be extremely helpful to weed out fraudulent applications and other types of scams. It can also help them set better premiums if denying insurance is not an option.

Better Customer Support

Have you ever been in a situation where you have had to get your call to the customer care rerouted a couple of times before you finally got your problem heard? The call first moves to the respective section of the insurance (example: car insurance versus medical insurance), then it goes to the redressal section, and then finally you get someone on the other line to speak. It is extremely annoying for a customer. Even more so when she is in a situation where she needs urgent medical insurance support.
Big data can assist in this process by automatically understanding the issue of a caller and routing it to the respective section. This is possible based on the preliminary details that the customer has to fill in. The analytical model which is attached to the database of policies can better bridge the gap so that the customer gets her information quickly.
On the other hand, this can also help insurers keep a track on a particular customer. How many times in the past five years has she filed for insurance? What does her lifestyle look like now compared to when she bought it? This last piece of information can aid in guiding her should she decide to buy another policy with the same company.

Offering New Services

According to IBM, data analytics can also provide insurers with tools to market new products based on their requirements. Today, retargeting techniques and cold calling are used to push products to customers, but when companies have valuable data in their hand, they can easily club it with their marketing and advertising and even sales departments to better retain customers and make them buy more products.
This will require a lot of integration on the part of insurers, but the current market and the high competition say that companies will be willing to take the jump if they see there’s any scope to grow their customer base and tackle the menace of continued competition.
According to us, newer companies will be more desperate to try these systems out than incumbent ones that have functioned in the same way for years and even decades.
While we have talked about the scope in general tone, it makes sense to understand what specific tools will be of most use. Out of this, content analytics, discovery and exploration capabilities, predictive analytics, Hadoop, and Stream computing are some essential models that will pave the way forward for insurance companies.
Of course, all of this cannot be switched on one fine morning without the approval of IRDAI. The regulatory body is yet to come up with proper guidelines, and insurers will need to abide by those rules before they can start executing them.

Why is Excel Such An Undervalued Tool For Data Analysis?

Microsoft Excel is one of the most popular data analytics tool available in the market. Initially released way back in 1987, its popularity increased manifold in 1993 after the launch of its Version 5. In its most basic version, Excel is a kind of spreadsheet where users can generate and store their data and interact with it to perform all sorts of operations and view them in the form of graphs, charts and other sorts of visualizations.

Widely regarded as one of the best tools in data analytics at one time, Excel has lost much of its reputation and prominence to other more advanced software and tools in recent time.

Although a worthy and powerful tool for data analytics, it does not feature in top 5 of most of the industry experts of today. In this article, we are trying to look at some reasons for the breaking up of the acclaimed connection between data analytics and excel in today’s world.

Unfair Comparison with Advanced Tools
With the arrival of more specialized tools for handling different aspects of data analytics, people find them better for their specific needs than a general workhorse like Excel and make the conclusion of Excel to be useless. It is not a fair comparison though. Some experts have pointed out that it is like comparing a Minivan to a large-scale cargo hauling such as Freightliner or comparing a minivan with a Formula 1 car and concluding that minivan is useless since it isn’t a Formula 1 car.

Excel works as a general tool for a wide range of data analytics work and is good for quickly building a wide variety of highly specialized timesaving workflow tools. The newer tools generally try to target and specialize one or two components of data handling and therefore are more advanced and capable in those aspects than Excel.

Relative Ease for Understanding and Operate
One can start working on MS Excel even with a basic knowledge of computer and networking. It does not require a high level of education or knowledge to be a master in Excel. Even kids of elementary schools can be taught to operate Excel with much ease. Excel is also easier to operate than the other advanced specialized tools in the market.

This relative easiness in understating and operating of the tool creates a misconception among many that it is not sophisticated enough to handle complex aspects of data analytics and visualization. It is however a wrong assumption. Even the best tools in data analytics require the knowledge and functioning of Excel in at least some part of their operation. Data analytics and excel have always went hand-in-hand and one is inseparable from the other.

Difficult to Find Errors
Even as one of the best tools in data analytics, Excel functions with the use of simple and complex analytical formulas. And since the formulas are only used for computation and calculation on the data, any errors which may reflect in the outcome becomes very difficult to be searched. Since there is no usage of coding in Excel, it is nearly impossible to automatically detect any error in data without having to go through the complete data manually.

Inability to handle Big Data
One of the major cons of using Excel is its inability to handle big data in data analytics. Since big data is emerging as a major component in today’s world in almost all major sectors, the simplicity of Excel makes it incapable of handling such larger data creating a perception of it being inferior to other such tools which can handle big data efficiently. Even after this disadvantage, it is impossible to overlook the sheer history of data analytics and Excel in any way.

Importance of Data Analysis in India

The importance of data in the world of today can not overstate. Though data has formed the backbone of all research for centuries, today, its use has spread to businesses – both online and offline, governments, think tanks which help in policy formulation, and professionals.
With the surge is collection and dissemination of data, the importance of data analysis has grown as well. While data collation is vital, it is just the first step in the process of using it. The ultimate use of data is to draw meaningful insights from which can then be put to use to practice. Data analysis helps in doing this by transforming raw data into a human or machine-usable format from which information is being drawn.
Also Read: What is Data Analysis and Who Are Data Analysts?
Data AnalyticsSome ways in which data analysis can be distinguished are as follows:

  • Organizing data: Raw data collected from single or multiple sources may be disorganized, or present in different formats. Data analysis helps in providing a form and structure to data and makes it useful so that other tools can be used to arrive at findings and interpret the results.

  • Breaking down a problem into segments: Working on data collection from an extensive survey or transaction and consumer behavior data can become very challenging due to the sheer volume of data involved. Data analysis techniques can help segment the data thereby reducing a massive, seemingly insurmountable problem, into smaller parts which can be relatively easily tackled.
  • Drawing insights and decision-making: This is the aspect which is most readily associated with data analysis. Tools and techniques from the field applied to pre-organized and segmented data assist in drawing meaningful insights which can either help in concluding a research project or support business in understanding consumer behavior towards their products better.

Further, through data analysis in itself is not a decision-making process, it certainly does help policymakers and businesses make decisions based on insights, information, and conclusions drawn while researching and analyzing data.

  • Presenting unbiased analysis: The use of data analysis techniques helps ensure that unwarranted biases – human or statistical – are reduced at least or eliminated at best. It helps ensure that top quality insights can be extracted from the data set which can help in taking effective policy actions or decisions.

Some people misconstrue data analysis to be just the presentation of numbers in a report based on which researchers support their thesis or managers take decisions. This is far from being true. More than merely data collection, data analysis helps in cleaning raw data, dissecting it, and analyzing it. It can also assist in presenting the insights drawn or information received from this exercise in a format which is compact and easy to understand.
In companies, there are data analysts and data scientists who are responsible for conducting data analysis. They can play a crucial role in harvesting information and insights from the data collection and study cause and effect relationships by understanding the meaning behind figures in light of business objectives. They are trained to process technical information and convert it into an easily understandable format for management.
Some data analysis methods that they use include:

  • Data mining: This studies patterns in large data sets – also known as big data – by applying statistical, machine learning, and artificial intelligence methods.
  • Text analytics: It processes unstructured information in text format and derives meaningful information from it. It also converts this information into the digital format for use by machine learning algorithms.
  • Business intelligence: This method draws insights from data and converts it into actionable information which is used by management for strategic business decisions.
  • Data visualization: This method uses data analysis tools to present trends and insights visually, thus making data more palatable.

Companies like Amazon and Google have made pioneering efforts in using data analysis by applying machine learning and artificial intelligence to create end-user experience better. Given that we are living in the information technology age, the use of data analysis is expected to increase manifold in the future and enhance its scope.
Also Read: