Excel for Business Analytics: Essential Tips and Tricks

In a world that is increasingly data-driven, business analytics becomes a very crucial source of business value for organizations that wish to make informed decisions. There are many sophisticated tools, but the most versatile and widely used solution for business analytics, however, remains Excel-from data management through visualization, this package proves to be a trusted ally among analysts, managers, and even senior leaders.

Here, an exploration of how Excel can empower professionals with actionable insights will be made while giving essential tips and tricks for excelling in data analysis and visualization. Whether you’re an analyst, a manager, or part of a senior leadership program, insights make the ability to better interpret and act on data effective.

Excel still manages to stay afloat despite the advanced business analytics tools, such as Power BI, Tableau, and Python. Their easy access, robust functionalities, and compatibility with other tools make them invaluable.

Why Excel Remains Relevant Today

Accessibility: It’s found in nearly every business, which puts it within the reach of professionals regardless of which industry they belong to.

Versatility: Whether it involves simple calculations, intricate data modeling, or development of dashboards, Excel does everything.

Integration: Excel works harmoniously with the most advanced analytics platforms. It is an extension to effectively prepare and perform basic exploration on the data.

Excel Tips for Effective Business Analytics

  1. Data Management Made Easy

Data management is an integral part of Excel Data Analysis. There are features provided by Excel to help users clean, organize, and prepare data for further analysis.

Flash Fill: Enable automatic repetitive data entry tasks through the identification of patterns.

Remove Duplicates: Remove duplicated data with a few clicks.

Text to Columns: Split complex data entries into usable fields.

Conditional Formatting: Highlight trends and anomalies within data for better interpretation.

Pro Tip: Always validate the data using utilities such as Data Validation to ensure consistency.

  1. Advanced Excel Formulas

It is the formulas in Excel that have enabled its users to perform powerful calculations and data manipulations.

Lookup Functions

Apply VLOOKUP or XLOOKUP for identifying specific data in a large dataset

Combine such functions with the IFERROR that can handle errors gracefully

INDEX-MATCH Combination: A more flexible alternative to the VLOOKUP function to retrieve data based on certain conditions.

Array Formulas: Use dynamic arrays for advanced calculations like SUMIFS and FILTER.

Example: Assessing monthly sales trends with SUMIFS based on multiple conditions, such as region and product category.

  1. Excel Data Analysis

The business analytics tools provided with Excel include the built-in Analysis ToolPak, which smooths statistical computations and complex analyses.

Regression Analysis: Understand relationships between variables to predict trends.

Descriptive Statistics: Quickly summarizes a data set with mean, median, standard deviation, and variance.

Solver Add-In: Optimize decision making by solving linear programming problems.

Real-World Use Case: A retail business uses regression analysis to forecast sales based on the advertising spend.

Data Visualization in Excel

Data visualization is the keystone of business analytics, allowing professionals to communicate insights effectively. Excel contains robust tools for creating compelling visual representations of data.

  1. Charts and Data Presentations

Bar and Column Charts: Great for comparing categories over time.

Line Charts: Ideal for showing trends or progressions.

Scatter Plots: Emphasize relationships between two variables.

  1. Advanced Visualizations

Heatmaps: Use conditional formatting to create visual patterns based on cell values.

Sparklines: Insert minicharts within a cell to illustrate trends of data.

Waterfall Charts: Show cumulative effects of sequential values, such as income and expenditures.

Pro Tip: Make your charts exciting through integration with slicers and timelines to add interactivity in dashboards.

  1. Dynamic Dashboards

Dynamic dashboards are an excellent way to provide a snapshot of key metrics. With pivot tables, slicers, and Excel formulas, you can create dashboards that will update in real time as the data changes.

Excel Integration with Advanced Business Analytics Tools

Excel gets more potent when integrated with other business analytics tools, which include Power BI and Tableau.

Integration with Power BI

Use Excel to prepare data first. Upload your data to Power BI for more advanced visualization.

Export insights from Power BI back to Excel for detailed reporting.

Tableau Connection

Prepare datasets in the Excel system before importing them to Tableau for interactive storytelling.

Use Excel’s functions to clean the data before creating dashboards in Tableau.

These integrations allow professionals, including those in a senior leadership program, to work seamlessly across platforms.

Excel Tips for Senior Leadership Programs

Excel isn’t just for analysts; rather, it is also an important tool for senior leaders. Decision-makers often need quick, reliable insights without diving into technical complexities.

Important Features for Senior Leaders:

Pivot Tables: Quickly summarize data for high-level overviews.

What-if Analysis: Analyze the impact of various scenarios on business outcomes.

Dashboards: Build clear, informative dashboards for performance tracking

These tools enable leaders to understand the data appropriately in order to make strategic decisions.

FAQs

  1. What makes Excel a favorite tool for business analytics?

What makes Excel the most preferred tool, used by professionals in various sectors, due to its accessibility, ease of use, and strong capabilities, is the fact that it can carry out as simple or complex analyses as the business analytics requires.

  1. How does Excel aid in data visualization for business decisions?

Excel offers quite customizable charts: from simple line graphs to complex heatmaps that enable users to present data insights effectively.

  1. Is Excel scalable to support big data analytics in businesses?

Yes, absolutely. Excel supports large data with tools such as Power Query and Power Pivot that can import, clean, and analyze data efficiently.

  1. Do senior analytics leaders require Excel competency?

Absolutely. The senior leaders enjoy quick insights through dashboards and summaries in Excel, which adds great value to their decision-making capabilities.

  1. How Does Excel Integrate with Other Business Analytics Applications?

Excel is perfectly compatible with leading analytics tools, such as Power BI and Tableau, which enables users to perform analysis across various platforms and visualize data.

Conclusion

Excel continues to be a must-have tool in the arsenal of any business analytics professional. Capabilities to interpret data, visualize them, and incorporate advanced functionality are so strong that one can expect its relevance to continue indefinitely. Mastering the tips and tricks outlined in this blog will allow professionals at all levels to tap into their full potential.

For senior leaders, understanding Excel’s capabilities can bridge the gap between data and decision-making, making it an invaluable skill. If you’re looking to advance your expertise in analytics and decision-making, consider enrolling in specialized courses or senior leadership programs that focus on business analytics and Excel mastery.

Mastering Excel is not only the improvement of technical skills but rather new opportunities to drive impact into decisions. Start today and empower your career with the tools of tomorrow!

Essentials of Business Analytics: Causal Inference and Analysis

Business analytics is the factor giving businesses a competitive edge in the very data-driven world we live today. While everything is driven by data and metrics, the “why” behind the outcome is equally important as the outcome itself. Which is helpful through causal inference; an important piece of the business analytics puzzle that makes decisions more intelligently based on patterns rather than mere positive correlations found in the data.

This guide will be teaching you the basics about business analytics, more particularly on causality and causal inference and analysis. Do know the techniques in analyzing causality tools, and methods, and learn how statistical and predictive analytics work. If you’re starting out or considering taking up a course in business analytics to upskill, then this is the guide for you.

What is Business Analytics?

Business analytics defines the use of data when making decisions. This is more than statistics applied to business, but actually gives an organization an understanding of past performance trends and enables it to predict future trends, thus making them better in decision-making, going beyond standard data analysis.

Why Causal Inference Matters in Business Analytics?

One of the greatest strengths of business analytics lies in its ability to take it further than mere correlation and establish causation. Techniques of causal inference would essentially find out if there is a causal relationship between two or more variables. For example, did an increase in sales result from an increase in spending on social media or by coincidence? It helps businesses know which strategies really work, therefore helping them allocate their resources effectively.

Key Techniques in Business Analytics for Causal Inference

  • Randomised Controlled Trials: Essentially the “gold standard” of causal inference, RCTs involve a random assignment of subjects to the treatment or control group, thereby conferring an ability to tease out the effect of any particular variable.
  • Difference-in-Differences DiD: It is the method of causal inference that compares a certain change over time for an exposed group and a non-exposed group. It allows businesses to measure the effect of interventions. Instrumental Variables: An instrumental variable is exogenous to treatment and not to the outcome while affecting treatment. It helps reduce bias where randomised methods aren’t possible.
  • Propensity Score Matching: PSM pairs subjects by their characteristics, thus simulating experimental conditions to estimate causal effects more realistically.
  • Regression Discontinuity: They apply if the treatment assignment has a clear cutoff point, such as some score threshold in a test; comparison of people on each side of this threshold can help establish causation.

This is important because, to entities wanting to get real actionable insights, it is crucial to know and apply such causal inference techniques.

Essential Business Analytics Tools for Causal Analysis

Numerous tools in business analytics can support causal inference and analysis. The tools are not only used to comfortably process and interpret the data but also add efficiency to complex statistical analysis in business.

 Some of the commonly used tools include:

– R and Python: These programming languages are widely used in business analytics due to the use of their powerful libraries, which allow deep statistical analysis and data manipulation.

There exist two broad categories into which tools need to be divided: Stata and SAS This category is especially dominant in fields that necessitate careful econometric analysis, often using techniques of causal inference, as well as regression analysis.

This category is also needless for visually stating the results of the causal analyses in a communicable form. Tableau and Power BI.

– Google Analytics: A tool that each business around the world uses to track customer behaviour on websites and provides an invaluable analysis of trends and causal patterns.

SPSS and Minitab: These are more for users requiring robust statistical tools for deeper, more detailed business analytics.

Mastering these business analytics tools greatly improves your power to analyse and interpret data when causality is an element.

Statistical Analysis in Business: Foundation of Causal Inference

The concept of statistical analysis in business is the most important aspect in understanding the techniques used for causal inference. This concept involves analysis of Large data sets in order to observe differences, similarities and patterns among them. 

Such a foundation is important for the following two reasons:

– Validity: Statistical analysis enhances the level of order and enables substantiate the results, hence it makes sure that the effect that has been recorded is not through random processes.

– Evidence Based Management: On the other hand application of techniques such as regression, t tests, and hypothesis testing enable formulation of objective conclusions in businesses.

Statistical analysis in business is very crucial whether you are calculating customer lifetime value, measuring the success of a product, or forecasting churn. It enables the business to make logical deductions and use causal inference more effectively leading to better decision-making.

Predictive Analytics Methods: Enhancing the Power of Business Analytics

Where causal inference looks ahead to the “why” of past outcomes, predictive analytics methods look forward by making predictions of future trends and events. Where the combinations of causal inference with predictive analytics allow businesses not only to understand the reasons for past outcomes but also predict their future needs, it becomes important to know which ones are popular in use.

Popular predictive analytics methods include:

This requires applying machine learning algorithms such as decision trees, random forests, or even neural networks, that can scan large amounts of data and relate more complex variables.

Time Series Analysis predicts future value based on history and this often proves very helpful in predicting sales or demand.

-Regression Analysis: It is the most commonly used regression with the help of business analytics, where one or more independent variables predict the value of a dependent variable.

-Cluster Analysis: It is an unsupervised learning technique that can classify data into different segments. Now, it helps in targeted marketing, personalized recommendations, and much more.

-Text Mining: As the use of social media is increasing, and reviews flood cyberspace, it really is important to draw insights from this unstructured data by using text mining.

These forms of predictive analytics will enable a firm to take a proactive approach to its understanding so that it will be able to predict the challenges. They can also capitalize upon emerging trends using these causal inference techniques.

Choosing a Business Analytics Course to Master Causal Inference

If one aims to upscale his or her career, it is worth signing up for a business analytics course that includes causal inference. A good-paced course will explore in depth the statistical and predictive analytics that are highlighted in this article, as well as practical sessions on top business analytics tools available in the market today. With the increasing demand for qualified analysts, a specific program can be an advantage and lead to more interesting career goals.

Conclusion

Business analytics captures causal inference, which would enable the organisation to make much better decisions based on causality rather than mere correlation. With mastery over the quintessential business analytics tools, knowledge of statistical analysis in business, and the best predictive analytics techniques, companies could be armed with deep insights from data. For those ready to dive deep, a comprehensive business analytics course can pave the way to career development and innovation in this exciting area of endeavour.

FAQs

  1. What is causal inference, and why is it important in business analytics?

Causal inference, as the term suggests, is the process that tries to assess the cause-effect relationship between two or more variables. It is essential because it helps companies defend the results which in the end assists them in making the right decisions.

  1. What tools are commonly used in causal inference and business analytics?

Often used are R, Python, SAS and Stata for statistical and machine learning purposes; Tableau and Power BI for visualization; in addition to Google Analytics for customer analysis.

  1. Why is statistical analysis in business-critical for causal inference?

Statistical analysis validates findings by adding rigour to causal relationships, ensuring that observed patterns are not coincidental but genuinely representative of causality.

Data analytics courses: 7 skills everyone needs to know

Data analytics courses: 7 skills everyone needs to know

Today, it is not an exaggeration to say that the world runs on data. The world creates 2,500,000,000,000,000,000 bytes (two and a half quintillion bytes) of data every day! Data analytics has become the jargon of the modern business, and talented data analysts are needed now more than ever before. As a result, more and more students are opting for a Data Analytics course as it stands for a lucrative job offer. 

best data analytics courseA Data Analytics Certification helps individuals to disrupt, innovate and drive their organizations’ strategies in a better manner today.

There are a variety of Tableau Course and  Data Analytics Courses online as job openings call from every industry of the market, from manufacturing and supply chain to banking, healthcare, and retail.

Here are the 7 skills that everyone needs to know if they plan to pursue Data Analytics Certification Courses to become an in-demand data professional:

Machine Learning

Machine learning has become the most important arm and leg of Data Science. As an extension of Artificial Intelligence (AI), it helps one in finding patterns in big data sets and build on algorithms to improve accuracy over time. Having a general understanding of machine learning-related tools and concepts will give you an edge over competitors. Some of the courses available on the Imarticus platform are Postgraduate Program In Data Analytics And Machine Learning And Certification In Artificial Intelligence And Machine Learning.

Structured Query Language (SQL)

To communicate with the databases, one needs to know the Structured Query Language (SQL). It allows the data analyst to modify data structures, and organize and update data. By exploring data, one learns how to analyze data as well in time. SQL has a good hold in companies everywhere because of its functionality and maintained effectiveness. Hence, it is considered one of the most important skills needed to land a data analyst job.

Data Visualization

A course in Data Analytics should equip an individual to gather insights and string the information together in a story format so that business owners can make better decisions. One can build data models and create business intelligence reports and use visual representations in a better way. The ability to visualize data empowers a data analyst to gain a better understanding of a company’s situation, deliver useful insights, and make better company decisions.

R or Python – Statistical Planning

Being able to write programs in R or Python can help one visualize as well as analyze data sets better. Although R is regarded better for analytics, Python is considered easier to learn of the two. Both languages fascinate businesses because they can handle complex or large quantities of data. Learning a language goes a long way in building a program that will collect, collate and analyze data.

Modern Statistical Thinking

Collecting, analyzing. and representing data are all parts of statistics. A strong foundation in probability and statistics is an important data analyst skill. Honing skills to develop modern statistical thinking will help an individual identify trends and patterns, avoid biases, fallacies, and logical errors in the analysis and produce accurate and trustworthy results.

Data Management

Managing data is of utmost importance, be it in any vertical of industry, as it interacts with different stakeholders over time. Storing data and information in such a way that it is cost-friendly and secure, helps data analysts to develop another skill set altogether. One can dive deep into how data works in the cloud and physical environments.

Presentation skills

For data to make sense, data analysts must perfect their presentation skills. Data visualization and presentation skills go hand-in-hand. After all, based on historical data, analysts can forecast future trends. Gain the job-ready skills for an entry-level data analyst role so that one can leverage technical skills to build a great career in the field of data analytics.

Things to Take Away!

Putting in time and effort and enrolling at a great center can help one to achieve great heights and propel one to succeed. To explore data analytics courses that can help one pursue a lucrative career in this field and assist in upskilling as well, join us now! Contact us through chat support, or drive to our training centers in Mumbai, Thane, Pune, Chennai, Bengaluru, Delhi, and Gurgaon

Big Data Engineer Salary: How Much Can You Earn as a Big Data Engineer?

Who is a Data Engineer?

As businesses across the globe are enthusiastically adapting the data-driven strategies to optimize their decisions, the demand of highly skilled Data Engineers has increased manifold. A skilled person who is able to convert the raw data into a self-explanatory form to analyze the trends by developing requisite algorithms is a Data Engineer.

The entire task of Data Mining, maintaining and extracting trends from different data sets in an organization is completed by a team of Data Engineers. Ultimately, the Data Engineers provide reliable infrastructure to maintain big data.

Skills required to be a Data Engineer

A Data Engineer must have deep understanding of SQL, Extract Transform Load, Apache Hadoop, in depth knowledge of Python, Java, Scala, Kafka, hive, storm and many more.

Big Data EngineerEnterprises now a days prefer the employees with the experience of working on the cloud platforms like Amazon Web Services etc. Sound knowledge of Data warehousing and Data modelling is also given a lot of preference these days.

The required skills and preferences may affect the salary of an Data Engineer by 10%-15%.

A Data Engineer deals in Big Data, the person should be proficient in the documentation skills and must also be good in his/her verbal and Non-verbal communication skills.

How to Become a Data Engineer?

Applied Mathematicians, Engineers, People holding Bachelor’s degree in Computer Sciences or related IT field find it easier to become a Data Engineer. The aspiring candidates then go for a Big Data certification course to have in depth understanding of required technological skills to be a Data Engineer.

Roles and Responsibilities of a Data Engineer

The generic tasks that a Data Engineer has to perform include:

  • Aggregation and Analysis of given data sets
  • Development of Dashboards and reports
  • Development of tools for business professionals
  • Providing improved techniques to access the Big Data

Three main domains in which a Data Engineer works are: Generalist, Pipeline centric, Database-Centric Generalists are the Data Engineers who processes, manages and analyses the data.

Big Data EngineerPipe-line centric Data Engineers work in coherence with Data Scientists to utilize their collected Data. Database-centric Data Engineers manages the Data-flow and database analytics.

Along with the technical skills, a Data Engineers must have some soft skills as well to communicate their analysis. Some of the key responsibilities are:

  • Acquisition of Data
  • To match their development constantly with the business requirements
  • Consistent improvement in the data reliability, efficiency and Data Quality
  • Development of predictive and prescriptive modelling

The key responsibilities vary from organization to organization.

Data Engineer: Employers and Salaries

Some of the top companies where Data Engineers are highly paid are:

  • com Inc
  • Tata Consultancy Services Limited
  • IBM Private Limited
  • General Electric (GE) Co
  • Hewlett-Packard
  • Facebook

Factors affecting Salaries of Data Engineers 

Experience:

Average Experience as a Data Engineer Average Pay-Scale based only on Experience
Entry level ₹400,000 approx.
1-4 years ₹739,916 based on 317 salaries
5-9 years ₹1,227,921 based on 179 salaries
10-19 years ₹1,525,827 based on 49 salaries

Job Location:

The Data Engineers working in the prime locations like Gurgaon (Haryana) earns 27.3% more average salary, in Hyderabad (Andhra Pradesh) 13.7% more average salary, in Bangalore (Karnataka) 12.5% more average salary than in locations across the nation.

The average salary of a Data Engineer in Mumbai, New Delhi and Chennai are relatively lesser than average salary across the nation.

Why Artificial Intelligence is Invaluable for Weather Forecasting and Disaster Prediction

For most people, weather forecasts are simply indicators of whether they need to carry an umbrella or throw on a coat when they go outside. However, for many industries and types of individuals, weather changes and patterns have a direct impact on their lives and livelihoods.

Agriculture, for example, benefits from accurate weather forecasting because farmers can make better planting and harvesting decisions. For governments, weather forecasts factor in their budget plans and disaster relief fund allotments. Businesses that rely on clear weather (or rough weather) depend on weather forecasts to drive several of their operational processes.

From all this, it is easy to gather that accurate weather and disaster forecasting carries much more weight than we think. Artificial intelligence augments the accuracy and reliability of weather forecasting, especially given that so many details fluctuate every day and with every geographical location. It is a great fit, given the volume of data is nigh impossible to sift through with manual labor alone.

In short, the future of artificial intelligence will also see its increasing use in the weather and natural disaster forecasting domains. Here are  a few more reasons why:

  • Managing several sources of weather data

There are currently more than one thousand weather satellites orbiting the  Earth, each sending back weather data dumps to various collection points. These data dumps are a mix of information about temperatures, cloud patterns, winds, and pollution levels. Then there are thousands of government and private weather stations around the world, each conducting their own real-time research on weather and climate.  It is nearly impossible to sift through all this data manually, but AI algorithms can do it in a matter of hours.

  • Sifting through multiple data categories

Suffice to say that the amount of data generated from satellites and personal weather stations is too much to fathom, and impossible for humans to sift through. However, Artificial Intelligence training can be applied to segregate and classify data from dumps, as well as to pull out key insights for analysis. This is a preliminary process in the weather prediction model, wherein AI segregates data based on indicators, flags significant shifts or patterns, and keeps data classified such that predictions are made as accurately and as scientifically as possible.

  • Preparing for potential disasters

Beyond real-time predictions, AI is also used to identify patterns and prepare for natural disasters in advance, off the back of previous circumstances. It may also split this data between geographies, allowing disaster management teams to evaluate which areas will be hit the hardest and prepare for that. This data is also invaluable for civil engineering teams, architectural firms, and city planning teams who need to take weather into account when mapping out residential and commercial areas.

  • Sending out warnings

Apart from predicting natural disasters, AI can also be leveraged to send out warnings to potential danger zones. This is invaluable when it comes to saving human and animal lives and generally preparing areas for the worse. Warnings can be sent out through media alerts, push notifications, and citizen broadcasts; whatever the method of delivery, AI is vital to sending such notices out in time and to the right people to curb panic and facilitate seamless planning.

Artificial Intelligence Training for Weather Forecasting

Weather forecasting teams and companies need skilled AI scientists and engineers to apply theory to practice in real-time. They need AI professionals who can create automated setups to free human minds for higher-order thinking; they also need pros who are fast on their feet and adept at creative problem-solving.

Using AI for weather forecasting is a whole new ball game – one on which many lives depend.

Boost your Career and Secure a Job During the Pandemic by Availing our Great Fightback Offers today!

Imarticus Learning introduces the ‘Great Fight Back Offer’ where you can sign up for selected courses and avail of good discounts for a limited period from 26th April-30th April 2021. Sign up today and avail of up to 30% Flat Off on placement-oriented, future-skill professional training programs.

 Covid-19 has changed the ways we lived. We are living amidst new normalcy, and we hope it fades out soon. Before we can unmask and return to normal, safety and health has to be a priority for all. The latter priorities being livelihood!

Yes, patterns of the industries have shifted, and employment and recruitment processes have changed. The parameters and eligibility criteria are moving to different alignment rapidly!

Does it put a question in the mind of what to do to advance and keep up the pace?

Well, the answer is simple to update and upgrade your skills. Those looking for an advance in their respective careers can look for new-age career programs. While those falling short of opportunities can consider shifting their career into a different industry.

Learn Data AnalyticsA practical approach and expert advice can work wonders for any task as it lays down a strategic path to be followed.

Upgrade for New Age Career with Imarticus

Imarticus Learning has transformed many careers by enabling aspirants to acquire in-demand skills using an ‘Industry-First approach.’ The idea is to prepare a talent pipeline for the jobs of tomorrow!

With the growing commercial and technological advancements in the global markets, Finance, Analytics, Technology, and Marketing are the industries that tend to secure the top-most position in terms of job opportunities.

These industries are rapidly becoming one of the most lucrative careers in the business world. Finance and Analytics Courses play a significant role in data evaluation for businesses to streamline decision-making processes. Technology simply helps to implement the strategy coming in through management.

‘The Great Fight Back Offer’

Why let Covid ruin your career when you can upgrade and become a skilled new-age professional! With the online learning mode of Imarticus, you get the facility to learn at home, thus, remaining safe and ensure productivity in the spare time.

Register today and empower your career prospects most affordably!

Solve Real-world Text Analytics Problems With NLP!

Solve Real-world Text Analytics Problems With NLP!

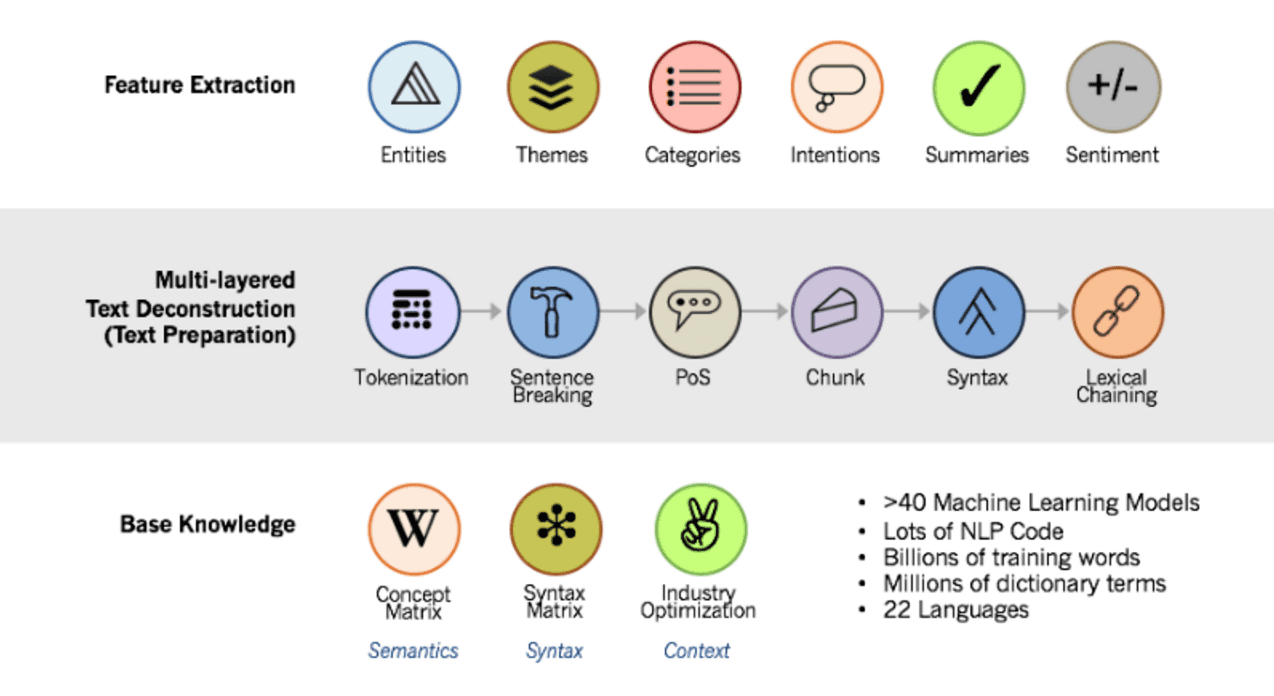
Natural language processing (NLP) helps machines analyze text or other forms of input such as speech by emulating how the human brain processes languages like English, French, or Japanese. NLP consists of ‘natural language understanding’ and ‘natural language generation’ which help machines create a summary of the information or assist in taking part in conversations.

With the advent of natural language processing, services like Cortana, Siri, Alexa, and Google Assistant are finding it easier to analyze and respond to requests from users. This is opening up many new possibilities in human-machine interactions and helping improve existing systems and services.

In this article, we will cover how NLP is helping provide solutions for various requirements of text analytics in different sectors.

Significance of NLP in modern times

data analytics courses

NLP can analyze massive amounts of text-based data with consistency and accuracy. NLP courses help summarize key concepts from large unstructured complex texts. It also helps in deciphering or analyzing ambiguous statements or sentences. It can draw connections and also investigate deeper meanings behind seemingly normal data in the form of text.

With the massive amounts of randomized forms of textual data that is generated on a daily basis, automation is highly necessary for this field to analyze the large amounts of data from text efficiently and effectively. Ranging from text posted on social media to customer service, natural language processing is powering text analytics which is making life easier for both consumers and corporations. 

How text analytics along with NLP is helping businesses? 

Text analytics can be described as a process of analyzing a massive or specifically targeted volume of unstructured textual data and translating it into quantitative information to gain valuable insights through patterns and trends.

With the help of additional visualization of this data, text analytics allows corporations to understand the sentiments, deeper meaning, or compact information behind this data and helps them take data-backed or data-centric decisions for improved results through better performance or profit.

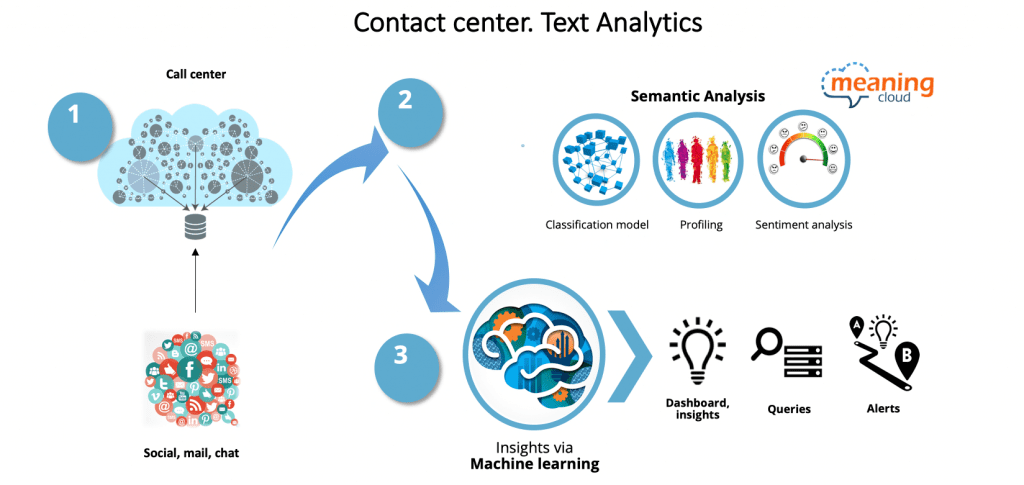
These companies collect massive amounts of unstructured textual data from sources like social media, e-mails platforms, chat services, and historic data from previous interactions or third parties. This could prove to be a challenge without the help of natural language processing which powers text analytics, helping analyze the massive amounts of data without the need to stop or for human interference. 

The same amount of data, being manually processed seems like an impossible, never-ending task. Manually processing even a tiny bit of the colossal amount of data that is generated daily would definitely take a lot of manpower. Hence, it is not cost-effective and would also lead to inaccuracy and duplication. This is where text analytics comes to the rescue.

With the help of text analytics, companies can excavate meaning and sentiments from unstructured textual data sourced from social media posts, content inside e-mails, chat services, and surveys or feedback. 

This helps businesses identify patterns and trends which lead to providing customers with improved experiences by analyzing service or product issues and customer expectations through market research and monitoring with text analytics.

Natural Language ProcessingHere are some real-world applications of text analytics and natural language processing:
Customer care service

Data generated from surveys, chats, and service tickets can help companies improve the quality of customer service by increasing efficiency and decreasing the time taken in resolving problems.

Illegal activity and fraud detection 

Text analytics helps in analyzing unstructured data from various internal or external sources to prevent fraud and warn governments or companies of illegal and fraudulent activities. 

Natural Language ProcessingSocial media analytics

Text analytics is being used by brands to analyze customer preferences and expectations through the extraction of sentiments and summarized opinions from textual data sourced from social media platforms like Facebook and Instagram. 

Text analytics and NLP are increasingly becoming more effective for companies to depend on and encouraging them to take more data-backed decisions. This need is making way for better, more accurate, and faster analytical tools and technologies in the future.

With Jobs at Risk, can a Career in Big Data Keep You Safe?

Data powers the information economy just like oil powers industrial economy. No wonder they say, “data is the new oil”. A critical asset to many industries, data science and AI changed the way information is gathered and processed. Even when COVID-19 hit the global economy, leading to job cuts and hiring freeze, data science remained unaffected.

While companies do not debate on the importance of data science, collecting and storing the huge volume of data was a big challenge. With limited capabilities, companies had a big struggle to maintain and process data. However, AI and cloud-based technologies provide a solution to this problem. These technologies have created better job opportunities for data professionals than ever before. If you are aspiring for a data analyst career, there isn’t a better time than this.

Why Big Data?

The world is consumer-centric and will remain so despite the hard hits on the economy. Consumerism is the driving force that creates revenue, and job opportunities. From healthcare to e-commerce, all industries are data-driven. The data requirement changes from one business to another, from one company to another. But the enormous amount of unstructured data can be collected using various tools and techniques, organized and structured according to the business needs.

No matter the business is consumer data is vital to all businesses. The tech giants like Google, Amazon etc, and the social media giants like Facebook have been using the potential of data to achieve a competitive advantage over their rivals. And the result is pretty much evident. They are far ahead of their competitors.

What is common among all of them is that they collect large swathes of data regarding their customers – right from what products they buy, which products they ditched after adding to the cart, which posts get better engagement, how long does a person spend time on their webpages – every single move of their customer after arriving on their website is tracked, processed and analyzed to make better business decisions.

The global health crisis saw the extensive application of data, how it can be used to manage a crisis better. From contact tracing, health screening and mitigating the spread. Many apps were developed to help contain the spread, leveraging the GPS to identify the COVID-19 hotspots.

The Increasing Demand for Data Scientists

COVID-19 has indeed changed the way the world functions. With more people staying indoors, individuals flocking the internet also increased. From work to shopping, everything is being done online. And this has increased the requirements for data scientists. While many companies struggle to acclimatize and manage their current employees logging in from a remote place, Tech firms are out with a pressing need to recruit more talents.

With more students and professionals active online, the need for online tools and platforms is growing, and this has led to the demand for an intense expansion of their talent pool.

AI and cybersecurity talents are the most coveted as many companies need technical support in digitizing their businesses. This calls for the improvement of data security measures and to enhance automation to reduce the on-site manpower.

Firms that rely on AI-powered software and those which provide such platforms are on a lookout for technical talents including software engineers and data analysts. Furthermore, financial services companies are also gearing up to become market-ready when the economy reopens. They have started headhunting for people with risk management and data analytics skills to cater to the recent spike in digital banking and online payments activities.

Data Science Online CourseData science is one of those areas not affected by COVID-19. In fact, the pandemic and the enforced stay-ins have resulted in an increased demand for data scientists. If you are a new graduate, take this opportunity to make the most out of the current market situation.
Enrolling in a Big Data Analytics Course could help you land on a lucrative career in data analytics and big data.

Edge Vs Cloud: Which Is Better For Data Analytics?

What is Edge Computing?

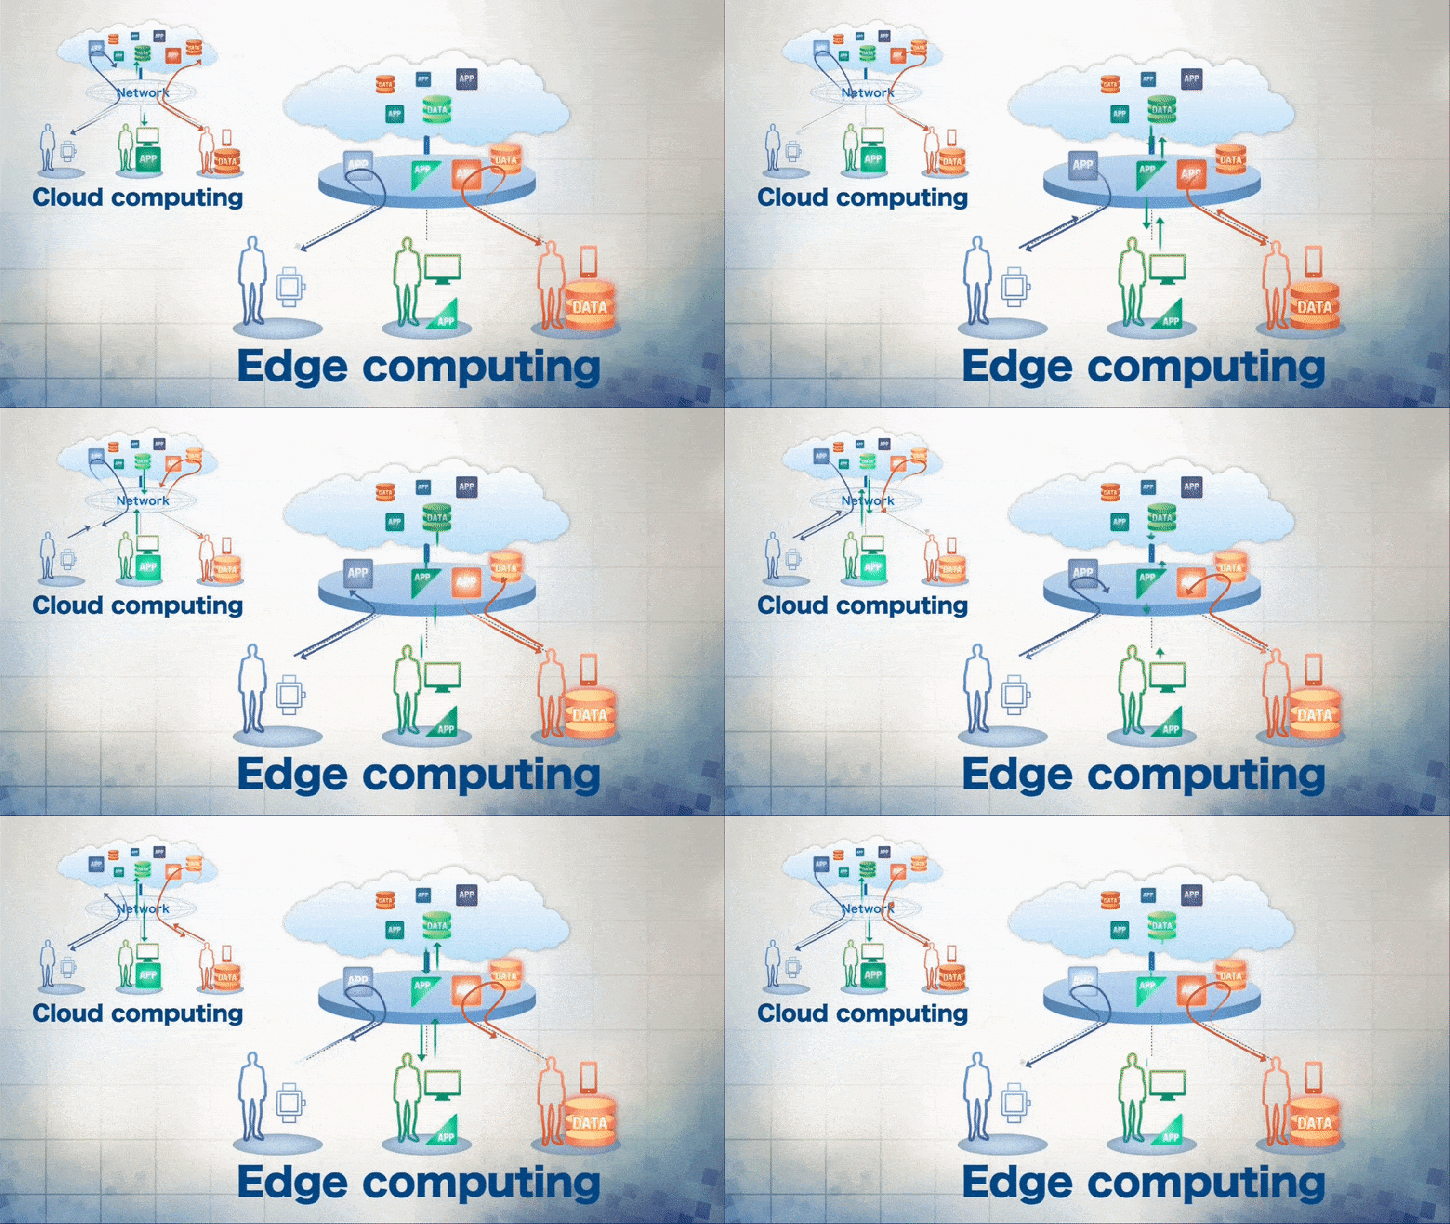
Edge computing is a segregated topology which serves to bring processed information closer to the device that is gathering the data rather than relying on a central unit which would be located much farther away.

What is Cloud Computing?

Cloud computing involves the process of delivering important information and services such as storage without the need for involvement of active management.

Which Out of the Two Is Better For Data Analysis?

In today’s world where AI has become an extremely important part of our lives, developers are looking to merge the devices we use on a day-to-day basis with artificial intelligence to make running businesses easier for organizations.

In such cases, we must look at the various computing methods that can make this possible in an efficient manner. Here, you would think that cloud computing would hold an important position in making the most suitable and ideal decisions. Platforms which are based on cloud allow developers to quickly create, deploy and handle their applications.

These would include playing the role of a platform of data for applications, application development which would help bridge the gap between data and users, and so on. It is popular for its flexibility with data storage and the ability to perform analysis processes.

On the other hand, edge computing allows applications and various other analytical and service processes of data to be done away from a central data unit, bringing it nearer to end-users. It allows the processing to take place within the locally available resources, thus bringing it a step back from the intricately planned cloud model where data processing happens in specific data centres.

Let us dive into this further in detail.

Cloud vs Edge Computing: Latency Problems

Cloud computing is used extensively across various organizations and companies for data analysis. However, there may be situations where a business may face problems in collecting, transporting and analysing the data given.

Edge and cloud computing for Data AnalyticsWhen data is transferred to a remote cloud server, it allows the user to perform various complex algorithms with machine learning and thus predict the maintenance needs of a particular section. This is then forwarded to a dashboard on a personal system where one can determine what decisions are to be made further. This is all done comfortably from home or the office.
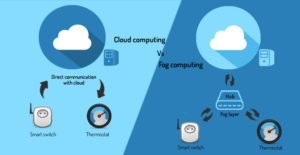
This is great, however, as one begins to increase the intensity of operations, one may begin to run into issues such as physical limitations on the bandwidth of the network and thus also latency issues.

Edge computing does a great job at reducing latency issues by involving a local server, maybe even on the device itself. The only difference here is that the issue with latency is solved at the expense of the processing power offered by cloud computing methods.

Businesses, with edge computing, are now being able to decrease data volumes which would need to be uploaded and stored in the cloud. This thus makes the process of data analysis less time-consuming.

Edge computing may still interact with other website applications and servers. It includes physical sensor thus allowing it to help run smarter algorithms and facilitate real-time processing which is used in smart vehicles, drones and smart appliances. It may not be as strong as a remote server, but it helps reduce the bandwidth strain that one would normally face with cloud computing.

Data Analytics CareerA big data analytics courses would help equip a person aspiring to work in the field of data analysis with all the information that would be necessary. A big data analytics career is a good option because it is an ever-expanding field with a large number of opportunities!

Current Trends Likely to Shape the Future of Business Analytics


Business Analytics is the process of organizing a company’s data into a simpler and more understandable form, in order to allow the administration to take a better decision with respect to the growth of the company.

Many individuals, after taking the Business Analytics course in Thane, are employed in multinational companies. They are tasked with providing relevant information, backed with suitable data, to the company’s administration. This makes for better decision making, which in turn, increases the rate of revenue made by the company. Business analytics could also be seen as an iterative investigation of a company’s past records. Recommendations are made in accordance with the study to ensure the betterment of the company.

There are a number of trends today which are shaping the future of Business Analytics. Keeping up with these trends and analyzing them is also a major part of the future. This makes it the right time to take up the Business Analytics Course. In this article, we will specifically talk about these trends.

Machine Intelligence

Machine Intelligence refers to creating smart machines which could act and perform specific activities just like humans. These machines are designed to work similar to human activities and natural phenomena. The machines learn from specific data sets customized to their activity. These are organized by individuals with skills in business intelligence.

Artificial Intelligence is only as good as the data provided to it.

With technological advancement, we have come to the invention of a medium both to enhance human intelligence, and replace it with something smarter and more efficient. Artificial Intelligence (also called augmented intelligence) takes its decisions on its own in accordance with its programming and learning from the data provided to it. An essential aspect of AI is that it is only as smart as the data. Business analytics serves that purpose by providing the AI program with a sorted and efficient set of data.

Internet of Things reached $170.57 billion in 2017.

The Internet of Things (IOT) is a market of devices which provide users with data on the basis of machine-to-machine communication. These devices or machines (like the Fitbit and smart watches) collect data from the user, interpret and analyze them by their parameters, and return their results accordingly. The IOT market is expected to rise to $561.04 billion by 2022. This will be a result of business analytics, through which a more organized data set is expected to be provided. Business analytics provides these wireless devices with properly understandable data which helps them provide simplified and relevant data in return.

Takeaway:

With the advent of technology, consumer expectation has shot up accordingly. Devices for instant entertainment, wireless communication, and other smart devices have experienced a rise in market demand. Moreover, the demand for sensors in these devices has also been increasing. Business analytics is that field of data simplification which is needed to convert this expectation into reality. If you are thinking of a career in Business Analytics, this is the best time to take Business Analytics course in Thane.