Every brand vies for customers’ attention in this digitally-inclined world, making it arduous. This can be done by implementing multiple brand strategies or conducting a marketing mix aligned with the company’s aims. Retaining customers requires great effort and time to gain the consumer’s trust. Hence, a strong focus on customer retention becomes crucial for a business’s success. One can apply multiple strategies to improve customer retention, including more face-to-face interaction or working on the buyer-brand relationship.
This article will answer the prevalent question of ‘what are the strategies for customer retention companies can adopt’ and suggest a few CMO Training Programs to level up your career.
What does customer retention mean?
Customer retention refers to the metric organisations or businesses use to measure their customer’s loyalty over a time period and their overall success. Different strategies and tactics are implemented to boost the overall retention of consumers for the company. Using a proper strategy for customer retention ensures that they remain loyal to the brand over a long period of time.
Customer Retention Rate formula:
The customer retention rate (CRR) is a specific component representing the retained customer percentage for the brand over a specified time-bound period. Given below is the formula to determine the CRR-
CRR = [{E-N} / S],
Here,
E represents the number of customers the brand holds at the closing of the period,
S represents the number of customers the brand holds at the initial measuring stage, and
N the number of new customers that the brand acquired.
Important Strategies to Improve Customer Retention
Customer retention and loyalty marketing are crucial to sustainable and flourishing businesses. While gaining new customers is significant, zeroing in on retaining existing customers can yield better yields and cultivate a loyal customer base that promotes your brand image. Here are a few successful methodologies to accomplish this:
Customised Experiences
Tailoring your communications to customer requirements and behaviour can fundamentally uplift their association with your image. Use data analysis to grasp their buying history, inclinations, and socioeconomics. Leverage this data to make customised item suggestions, selective offers, and designated marketing efforts that reverberate with every customer.
Unmatched Customer Service
Offering unique customer service solutions is the foundation of customer retention. Including ideal and sympathetic responses to customer queries and problems can contribute to a pleasant overall experience with a long-term impact. Satisfied customers will remain loyal and recommend your products or services to others.
Loyalty Programmes
Executing a meticulously planned loyalty programme can entice customers to make them want more. Offer rewards like discounts, limited period offers, free products, or selective admittance to loyal customers. The pride and acknowledgement that comes from amassing rewards boosts rehash buys and improves customer commitment.
Multi-channel Engagement
Draw in your customers using online entertainment, email, in-person, and telephone channels. Consistency in providing information and the capacity to cooperate through their favoured channels influences consumers’ general insight. Be responsive and congenial, cultivating your areas of strength for association and dependability.
Help Customers Getting Associated With the Brand Positively
Creating a brand association can be an uphill task, especially when a company initially creates a brand name. This is followed by creating brand awareness leading to brand association with customers. Develop a positive outlook to entice customers into partnering with you.
Surveys and Feedback
Routinely look for customer feedback through surveys, feedback and audit structures. This shows that your brand values feedback from the market. Follow up on this feedback to improve your products, services, and customer experience.
Content and Guidance
Offer interesting and instructional content that resonates with your target customers’ needs to connect and engage them with your products or services. This could incorporate how-to guides, tips, industry experiences, and much more.
Selective Offers and Exclusive Discounts
Reward your loyal customers with discounts and offers. This makes them feel appreciated and esteemed, empowering them to keep selecting your brand over other potential competitors.
Community Building
Make a community around your brand where customers can interact with one another. This can be through internet-based gatherings, virtual entertainment gatherings, or in any event, facilitating customer-selective occasions. Building a customer-centric community can help consumers stay connected with the brand and instil a sense of loyalty.
The Bottom Line
A few approaches and strategies might work better than others depending on the type of organisation you own, for example, a physical area versus a web-based store, its size and target audience. Whether you shape a brand profile or opt for promotions, fostering the right customer retention strategies for your business is significant.
If you are inclined toward making a career in management, check out the CMO Training Program, such as Imarticus’s Executive Certificate Programme For Strategic Chief Marketing Officers, to upskill yourself against the competition.
Learn the ropes of customer acquisition, retention and development tactics from industry experts and enhance your professional profile to fit the role of a CMO.
Cloud computing, like a dependable friend, has been showing up and quietly revolutionising banking in ways that are changing the entire financial landscape. Whether you’re an industry veteran or a budding professional looking to make your mark, fintech and financial technology courses are here to help you understand and engage with this transformation.
Imagine having a reliable tool that changes the way you operate, creating a world of possibilities. That’s what cloud computing has become for the banking industry. According to a survey by Accenture, about 90% of banking executives globally are exploring the shift to cloud-based operations.
This change doesn’t just signify a new era but demonstrates a leap into a future where efficiency and innovation are key.
How Cloud Computing Helps Banking
From cost-saving prowess and powerful data protection abilities to an uncanny knack for elevating customer experiences, cloud computing is making a massive difference in banking.
Let’s take a closer look at some of these superpowers and see how they’re making banking better.
Cost Efficiency
Let’s start with what matters to us all – money. The pay-as-you-go model of cloud computing has been a game-changer for banks, giving them the flexibility to scale resources as needed, which in turn, cuts down massive investments in IT infrastructure.
Enhanced Data Security
In the world of banking, data security is non-negotiable. It’s like the secret recipe for your favourite dish – it needs to be guarded zealously. Thanks to cloud computing, banks now have tools like encryption and identity management, which, combined with disaster recovery solutions, keep your data as safe as a house.
Improved Customer Experience
Remember when banking transactions felt like just another chore on your to-do list? Those days are gradually fading into the past as cloud computing helps banks offer real-time, personalised services, transforming mundane transactions into enjoyable experiences.
The Cloud-Driven Era in Banking
We’re already stepping into the future, where banking is driven by cloud computing. This technology isn’t just an upcoming trend but a present reality dictating the course of the banking sector. From small community banks to multinational banking giants, everyone is leaning towards the benefits of cloud computing.
A Gartner report suggests that the public cloud services market will grow by 21.4% in 2023 alone, amounting to a total value of $404.9 billion. Such a surge indicates the growing trust and reliance on cloud technology across industries, including banking.
In this context, several significant aspects come to the forefront:
Greater Adaptability: In an ever-evolving landscape, cloud computing provides the flexibility to adapt to changes swiftly. It allows banks to scale operations based on demand, ensuring cost efficiency and optimum resource utilisation.
Digital Customer Experience:McKinsey predicts that digital banking will fully catch up in the near future, making branch visits a thing of the past. In this scenario, cloud computing forms the backbone of digital transformation, facilitating seamless, real-time services for customers.
Data-Driven Decisions: The banking sector generates vast amounts of data. Cloud computing provides the capacity and the analytical tools to process this data, enabling banks to make informed, strategic decisions.
Robust Security: With rising cyber threats, banks need a robust security framework to protect sensitive customer data. Cloud computing offers advanced security measures, including data encryption, regular backups, and disaster recovery plans, fostering a secure banking environment.
Financial technology courses are becoming increasingly relevant in this context. They provide an in-depth understanding of cloud computing, offering the tools to harness its potential effectively. As the future of banking becomes more intertwined with cloud technology, individuals equipped with such knowledge will be at the forefront of this transformation.
Investing in Yourself: The Value of Financial Technology Courses
In the era of cloud computing, knowledge is truly power. Financial technology courses are here to help you wield that power by not just understanding cloud computing but other disruptive technologies like AI and blockchain as well.
With a broad catalogue of certified Fintech courses from Imarticus, you can explore the depth of cloud computing and its growing relevance in the field of finance- eventually becoming a part of the dynamic Fintech world!
Wrapping Up
As we wrap up our talk, it’s clear that the world of banking isn’t the same as it used to be. Cloud computing has changed the entire banking domain – whether it concerns saving money, keeping important data safe, or giving great customer service. As a result of this, in order to make the most of these changes, one needs to understand and use the technology that makes it possible.
This is where financial technology courses can be very helpful. They not only help us understand how cloud computing works but also give us the skills and information we need to use it well.
The cloud-based future of banks looks bright and hopeful. And for those of us who are willing to change and learn, there are exciting chances to shape this change and lead it. So, here’s to the future of banks, where technology and new ideas work together to drive growth and progress. Are you ready to join in?
The worldly functions are now majorly changing with data usage. It has a wide spectrum of usage starting from the company’s revenue strategy to disease cures and many more. It is also a great flagbearer to get targeted ads on your social media page. In short, data is now dominating the world and its functions.
But the question arises, what is data? Data primarily refers to the information that is readable by the machine, unlike humans. Hence, it makes the process easier which enhances the overall workforce dynamic.
Data works in various ways, however, it is of no use without data modelling, data engineering and of course, Machine Learning. This helps in assigning relational usage to data. These help in uncomplicating data and segregating them into useful information which would come in handy when it comes to decision making.
The Role of Data Modeling and Data Engineering in Data Science
Data modelling and data engineering are one of the essential skills of data analysis. Even though these two terms might sound synonymous, they are not the same.
Data modelling deals with designing and defining processes, structures, constraints and relationships of data in a system. Data engineering, on the other hand, deals with maintaining the platforms, pipelines and tools of data analysis.
Both of them play a very significant role in the niche of data science. Let’s see what they are:
Data Modelling
Understanding: Data modelling helps scientists to decipher the source, constraints and relationships of raw data.
Integrity: Data modelling is crucial when it comes to identifying the relationship and structure which ensures the consistency, accuracy and validity of the data.
Optimisation: Data modelling helps to design data models which would significantly improve the efficiency of retrieving data and analysing operations.
Collaboration: Data modelling acts as a common language amongst data scientists and data engineers which opens the avenue for effective collaboration and communication.
Data Engineering
Data Acquisition: Data engineering helps engineers to gather and integrate data from various sources to pipeline and retrieve data.
Data Warehousing and Storage: Data engineering helps to set up and maintain different kinds of databases and store large volumes of data efficiently.
Data Processing: Data engineering helps to clean, transform and preprocess raw data to make an accurate analysis.
Data Pipeline: Data engineering maintains and builds data pipelines to automate data flow from storage to source and process it with robust analytics tools.
Performance: Data engineering primarily focuses on designing efficient systems that handle large-scale data processing and analysis while fulfilling the needs of data science projects.
Governance and Security: The principles of data engineering involve varied forms of data governance practices that ensure maximum data compliance, security and privacy.
Understanding Data Modelling
Data modelling comes with different categories and characteristics. Let’s learn in detail about the varied aspects of data modelling to know more about the different aspects of the Data Scientist course with placement.
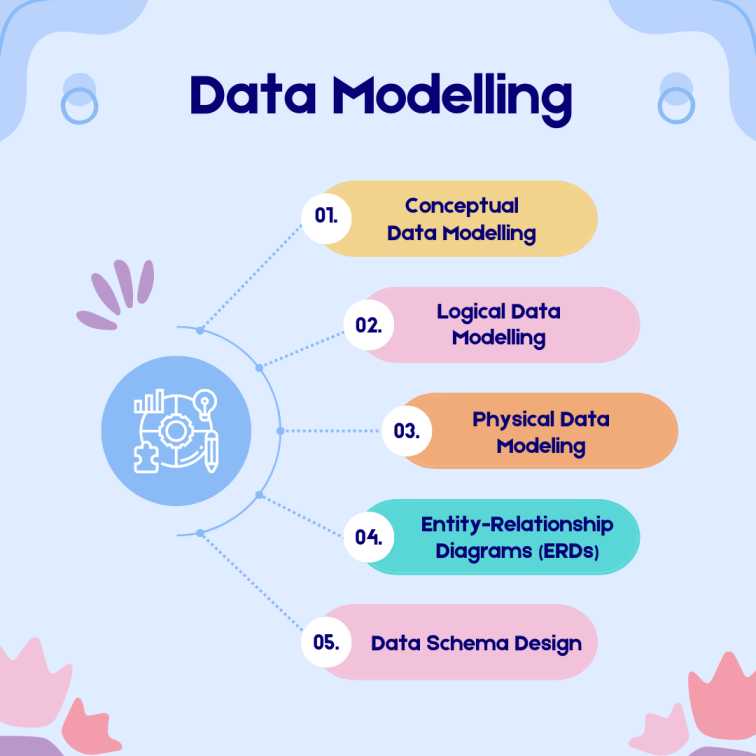
Conceptual Data Modelling
The process of developing an abstract, high-level representation of data items, their attributes, and their connections is known as conceptual data modelling. Without delving into technical implementation specifics, it is the first stage of data modelling and concentrates on understanding the data requirements from a business perspective.
Conceptual data models serve as a communication tool between stakeholders, subject matter experts, and data professionals and offer a clear and comprehensive understanding of the data. In the data modelling process, conceptual data modelling is a crucial step that lays the groundwork for data models that successfully serve the goals of the organisation and align with business demands.
Logical Data Modelling
After conceptual data modelling, logical data modelling is the next level in the data modelling process. It entails building a more intricate and organised representation of the data while concentrating on the logical connections between the data parts and ignoring the physical implementation details. Business requirements can be converted into a technical design that can be implemented in databases and other data storage systems with the aid of logical data models, which act as a link between the conceptual data model and the physical data model.
Overall, logical data modelling is essential to the data modelling process because it serves as a transitional stage between the high-level conceptual model and the actual physical data model implementation. The data is presented in a structured and thorough manner, allowing for efficient database creation and development that is in line with business requirements and data linkages.
Physical Data Modeling
Following conceptual and logical data modelling, physical data modelling is the last step in the data modelling process. It converts the logical data model into a particular database management system (DBMS) or data storage technology. At this point, the emphasis is on the technical details of how the data will be physically stored, arranged, and accessed in the selected database platform rather than on the abstract representation of data structures.
Overall, physical data modelling acts as a blueprint for logical data model implementation in a particular database platform. In consideration of the technical features and limitations of the selected database management system or data storage technology, it makes sure that the data is stored, accessed, and managed effectively.
Entity-Relationship Diagrams (ERDs)
The relationships between entities (items, concepts, or things) in a database are shown visually in an entity-relationship diagram (ERD), which is used in data modelling. It is an effective tool for comprehending and explaining a database’s structure and the relationships between various data pieces. ERDs are widely utilised in many different industries, such as data research, database design, and software development.
These entities, characteristics, and relationships would be graphically represented by the ERD, giving a clear overview of the database structure for the library. Since they ensure a precise and correct representation of the database design, ERDs are a crucial tool for data modellers, database administrators, and developers who need to properly deploy and maintain databases.
Data Schema Design
A crucial component of database architecture and data modelling is data schema design. It entails structuring and arranging the data to best reflect the connections between distinct entities and qualities while maintaining data integrity, effectiveness, and retrieval simplicity. Databases need to be reliable as well as scalable to meet the specific requirements needed in the application.
Collaboration and communication among data modellers, database administrators, developers, and stakeholders is the crux data schema design process. The data structure should be in line with the needs of the company and flexible enough to adapt as the application or system changes and grows. Building a strong, effective database system that effectively serves the organization’s data management requirements starts with a well-designed data schema.
Data Engineering in Data Science and Analytics
Data engineering has a crucial role to play when it comes to data science and analytics. Let’s learn about it in detail and find out other aspects of data analytics certification courses.
Data Integration and ETL (Extract, Transform, Load) Processes
Data management and data engineering are fields that need the use of data integration and ETL (Extract, Transform, Load) procedures. To build a cohesive and useful dataset for analysis, reporting, or other applications, they play a critical role in combining, cleaning, and preparing data from multiple sources.
Data Integration
The process of merging and harmonising data from various heterogeneous sources into a single, coherent, and unified perspective is known as data integration. Data in organisations are frequently dispersed among numerous databases, programmes, cloud services, and outside sources. By combining these various data sources, data integration strives to create a thorough and consistent picture of the organization’s information.
ETL (Extract, Transform, Load) Processes
ETL is a particular method of data integration that is frequently used in applications for data warehousing and business intelligence. There are three main steps to it:
Extract: Databases, files, APIs, and other data storage can all be used as source systems from which data is extracted.
Transform: Data is cleaned, filtered, validated, and standardised during data transformation to ensure consistency and quality after being extracted. Calculations, data combining, and the application of business rules are all examples of transformations.
Load: The transformed data is loaded into the desired location, which could be a data mart, a data warehouse, or another data storage repository.
Data Warehousing and Data Lakes
Large volumes of organised and unstructured data can be stored and managed using either data warehousing or data lakes. They fulfil various needs for data management and serve varied objectives. Let’s examine each idea in greater detail:
Data Warehousing
A data warehouse is a centralised, integrated database created primarily for reporting and business intelligence (BI) needs. It is a structured database designed with decision-making and analytical processing in mind. Data warehouses combine data from several operational systems and organise it into a standardised, query-friendly structure.
Data Lakes
A data lake is a type of storage facility that can house large quantities of both organised and unstructured data in its original, unaltered state. Data lakes are more adaptable and well-suited for processing a variety of constantly changing data types than data warehouses since they do not enforce a rigid schema upfront.
Data Pipelines and Workflow Automation
Workflow automation and data pipelines are essential elements of data engineering and data management. They are necessary for effectively and consistently transferring, processing, and transforming data between different systems and applications, automating tedious processes, and coordinating intricate data workflows. Let’s investigate each idea in more depth:
Data Pipelines
Data pipelines are connected data processing operations that are focused on extracting, transforming and loading data from numerous sources to a database. Data pipelines move data quickly from one stage to the next while maintaining accuracy in the data structure at all times.
Workflow Automation
The use of technology to automate and streamline routine actions, procedures, or workflows in data administration, data analysis, and other domains is referred to as workflow automation. Automation increases efficiency, assures consistency, and decreases the need for manual intervention in data-related tasks.
Data Governance and Data Management
The efficient management and use of data within an organisation require both data governance and data management. They are complementary fields that cooperate to guarantee data management, security, and legal compliance while advancing company goals and decision-making. Let’s delve deeper into each idea:
Data Governance
Data governance refers to the entire management framework and procedures that guarantee that data is managed, regulated, and applied across the organisation in a uniform, secure, and legal manner. Regulating data-related activities entails developing rules, standards, and processes for data management as well as allocating roles and responsibilities to diverse stakeholders.
Data Management
Data management includes putting data governance methods and principles into practice. It entails a collection of procedures, devices, and technological advancements designed to preserve, organise, and store data assets effectively to serve corporate requirements.
Data Cleansing and Data Preprocessing Techniques
Data preparation for data analysis, machine learning, and other data-driven tasks requires important procedures including data cleansing and preprocessing. They include methods for finding and fixing mistakes, discrepancies, and missing values in the data to assure its accuracy and acceptability for further investigation. Let’s examine these ideas and some typical methods in greater detail:
Data Cleansing
Locating mistakes and inconsistencies in the data is known as data cleansing or data scrubbing. It raises the overall data standards which in turn, analyses it with greater accuracy, consistency and dependability.
Data Preprocessing
The preparation of data for analysis or machine learning tasks entails a wider range of methodologies. In addition to data cleansing, it also comprises various activities to prepare the data for certain use cases.
Introduction to Machine Learning
A subset of artificial intelligence known as “machine learning” enables computers to learn from data and enhance their performance on particular tasks without having to be explicitly programmed. It entails developing models and algorithms that can spot trends, anticipate the future, and take judgement calls based on the supplied data. Let’s delve in detail into the various aspects of Machine Learning which would help you understand data analysis better.
Supervised Learning
In supervised learning, the algorithm is trained on labelled data, which means that both the input data and the desired output (target) are provided. Based on this discovered association, the algorithm learns to map input properties to the desired output and can then predict the behaviour of fresh, unobserved data. Examples of common tasks that involve prediction are classification tasks (for discrete categories) and regression tasks (for continuous values).
Unsupervised Learning
In unsupervised learning, the algorithm is trained on unlabeled data, which means that the input data does not have corresponding output labels or targets. Finding patterns, structures, or correlations in the data without explicit direction is the aim of unsupervised learning. The approach is helpful for applications like clustering, dimensionality reduction, and anomaly detection since it tries to group similar data points or find underlying patterns and representations in the data.
Semi-Supervised Learning
A type of machine learning called semi-supervised learning combines aspects of supervised learning and unsupervised learning. A dataset with both labelled (labelled data with input and corresponding output) and unlabeled (input data without corresponding output) data is used to train the algorithm in semi-supervised learning.
Reinforcement Learning
A type of machine learning called reinforcement learning teaches an agent to decide by interacting with its surroundings. In response to the actions it takes in the environment, the agent is given feedback in the form of incentives or punishments. Learning the best course of action or strategy that maximises the cumulative reward over time is the aim of reinforcement learning.
Machine Learning in Data Science and Analytics
Predictive Analytics and Forecasting
For predicting future occurrences, predictive analysis and forecasting play a crucial role in data analysis and decision-making. Businesses and organisations can use forecasting and predictive analytics to make data-driven choices, plan for the future, and streamline operations. They can get insightful knowledge and predict trends by utilising historical data and cutting-edge analytics approaches, which will boost productivity and competitiveness.
Recommender Systems
A sort of information filtering system known as a recommender system makes personalised suggestions to users for things they might find interesting, such as goods, movies, music, books, or articles. To improve consumer satisfaction, user experience, and engagement on e-commerce websites and other online platforms, these techniques are frequently employed.
Anomaly Detection
Anomaly detection is a method used in data analysis to find outliers or odd patterns in a dataset that deviate from expected behaviour. It is useful for identifying fraud, errors, or anomalies in a variety of fields, including cybersecurity, manufacturing, and finance since it entails identifying data points that dramatically diverge from the majority of the data.
Natural Language Processing (NLP) Applications
Data science relies on Natural Language Processing (NLP), enabling robots to comprehend and process human language. To glean insightful information and enhance decision-making, NLP is applied to a variety of data sources. Data scientists may use the large volumes of textual information available in the digital age for improved decision-making and comprehension of human behaviour thanks to NLP, which is essential in revealing the rich insights hidden inside unstructured text data.
Scikit-learn for general machine learning applications, TensorFlow and PyTorch for deep learning, XGBoost and LightGBM for gradient boosting, and NLTK and spaCy for natural language processing are just a few of the machine learning libraries available in Python. These libraries offer strong frameworks and tools for rapidly creating, testing, and deploying machine learning models.
R Libraries for Data Modeling and Machine Learning
R, a popular programming language for data science, provides a variety of libraries for data modelling and machine learning. Some key libraries include caret for general machine learning, randomForest and xgboost for ensemble methods, Glmnet for regularised linear models, and Nnet for neural networks. These libraries offer a wide range of functionalities to support data analysis, model training, and predictive modelling tasks in R.
Big Data Technologies (e.g., Hadoop, Spark) for Large-Scale Machine Learning
Hadoop and Spark are the main big data technologies that handle large-scale data processing. These features create the perfect platform for conducting large-scale machine learning tasks of batch processing and distributed model training to allow scalable and effective handling of enormous data sets. It also enables parallel processing, fault tolerance and distributing computing.
AutoML (Automated Machine Learning) Tools
AutoML enables the automation of various steps of machine learning workflow like feature engineering and data processing. These tools simplify the procedure of machine learning and make it easily accessible to users with limited expertise. It also accelerates the model development to achieve competitive performance.
Case Studies and Real-World Applications
Successful Data Modeling and Machine Learning Projects
Netflix: Netflix employs a sophisticated data modelling technique that helps to power the recommendation systems. It shows personalised content to users by analysing their behaviours regarding viewing history, preferences and other aspects. This not only improves user engagement but also customer retention.
PayPal: PayPal uses successful data modelling techniques to detect fraudulent transactions. They analyse the transaction patterns through user behaviour and historical data to identify suspicious activities. This protects both the customer and the company.
Impact of Data Engineering and Machine Learning on Business Decisions
Amazon: By leveraging data engineering alongside machine learning, businesses can now easily access customer data and understand their retail behaviour and needs. It is handy when it comes to enabling personalised recommendations that lead to higher customer satisfaction and loyalty.
Uber: Uber employs NLP techniques to monitor and analyse customer feedback. They even take great note of the reviews provided by them which helps them to understand brand perception and customer concern address.
Conclusion
Data modelling, data engineering and machine learning go hand in hand when it comes to handling data. Without proper data science training, data interpretation becomes cumbersome and can also prove futile.
If you are looking for a data science course in India check out Imarticus Learning’s Postgraduate Programme in Data Science and Analytics. This programme is crucial if you are looking for a data science online course which would help you get lucrative interview opportunities once you finish the course. You will be guaranteed a 52% salary hike and learn about data science and analytics with 25+ projects and 10+ tools.
To know more about courses such as the business analytics course or any other data science course, check out the website right away! You can learn in detail about how to have a career in Data Science along with various Data Analytics courses.
Exploratory data analysis (EDA) is an essential component of today’s data-driven decision-making. Data analysis involves handling and analysing data to find important trends and insights that might boost corporate success.
With the growing importance of data in today’s world, mastering these techniques through a data analytics course or a data scientist course can lead to exciting career opportunities and the ability to make data-driven decisions that positively impact businesses.
Whether you’re a seasoned data expert or just starting your journey, learning EDA can empower you to extract meaningful information from data and drive better outcomes for organisations.
Role of Data Analysis in Data Science and Business Decislpion Making
Effective business decision-making requires careful consideration of various factors, and data-driven decision-making is a powerful approach that relies on past data insights. Using data from business operations enables accurate and informed choices, improving company performance.
Data lies at the core of business operations, providing valuable insights to drive growth and address financial, sales, marketing, and customer service challenges. To harness its full potential, understanding critical data metrics is essential for measuring and using data effectively in shaping future strategies.
Businesses can achieve success more quickly and reach new heights by implementing data-driven decision-making.
Understanding Exploratory Data Analysis (EDA)
EDA is a vital tool for data scientists. It involves analysing and visualising datasets to identify patterns, anomalies, and relationships among variables. EDA helps understand data characteristics, detect errors, and validate assumptions.
EDA is a fundamental skill for those pursuing a career in data science. Through comprehensive data science training, individuals learn to use EDA effectively, ensuring accurate analyses and supporting decision-making.
EDA’s insights are invaluable for addressing business objectives and guiding stakeholders to ask relevant questions. It provides answers about standard deviations, categorical variables, and confidence intervals.
After completing EDA, data scientists can apply their findings to advanced analyses, including machine learning. EDA lays the foundation for data science training and impactful data-driven solutions.
Exploring Data Distribution and Summary Statistics
In data analytics courses, you’ll learn about data distribution analysis, which involves examining the distribution of individual variables in a dataset. Techniques like histograms, kernel density estimation (KDE), and probability density plots help visualise data shape and value frequencies.
Additionally, summary statistics such as mean, median, standard deviation, quartiles, and percentiles offer a quick snapshot of central tendencies and data spread.
Data Visualisation Techniques
Data visualisation techniques involve diverse graphical methods for presenting and analysing data. Common types include scatter plots, bar charts, line charts, box plots, heat maps, and pair plots.
These visualisations aid researchers and analysts in gaining insights and patterns, improving decision-making and understanding complex datasets.
Identifying Data Patterns and Relationships
Correlation analysis: Correlation analysis helps identify the degree of association between two continuous variables. It is often represented using correlation matrices or heatmaps.
Cluster analysis: Cluster analysis groups similar data points into clusters based on their features. It helps identify inherent patterns or structures in the data.
Time series analysis: Time series analysis is employed when dealing with data collected over time. It helps detect trends, seasonality, and other temporal patterns.
Handling Missing Data and Outliers
Handling missing data and outliers is a crucial step in data analysis. Techniques like imputation, deletion, or advanced expectation-maximisation (EM) can address missing values.
At the same time, outliers must be identified and treated separately to ensure unbiased analysis and accurate conclusions.
Data Preprocessing for EDA
Data Preprocessing is crucial before performing EDA or building machine learning models. It involves preparing the data in a suitable format to ensure accurate and reliable analysis.
Data Cleaning and Data Transformation
In data cleaning and transformation, missing data, duplicate records, and inconsistencies are addressed by removing or imputing missing values, eliminating duplicates, and correcting errors.
Data transformation involves normalising numerical variables, encoding categorical variables, and applying mathematical changes to deal with skewed data distributions.
Data Imputation Techniques
Data imputation techniques involve filling in missing values using mean, median, or mode imputation, regression imputation, K-nearest neighbours (KNN) imputation, and multiple imputations, which helps to address the issue of missing data in the dataset.
Handling Categorical Data
In data science training, categorical data, representing non-numeric variables with discrete values like gender, colour, or country, undergoes conversion to numerical format for EDA or machine learning.
Techniques include label encoding (assigning unique numerical labels to categories) and one-hot encoding (creating binary columns indicating the presence or absence of categories).
Feature Scaling and Normalisation
In data preprocessing, feature scaling involves:
Scaling numerical features to a similar range.
Preventing any one feature from dominating the analysis or model training.
Using techniques like Min-Max scaling and Z-score normalisation.
On the other hand, feature normalisation involves normalising data to have a mean of 0 and a standard deviation of 1, which is particularly useful for algorithms relying on distance calculations like k-means clustering or gradient-based optimisation algorithms.
Data Visualisation for EDA
Univariate and Multivariate Visualisation
Univariate analysis involves examining individual variables in isolation, dealing with one variable at a time. It aims to describe the data and identify patterns but does not explore causal relationships.
In contrast, multivariate analysis analyses datasets with three or more variables, considering interactions and associations between variables to understand collective contributions to data patterns and trends, offering a more comprehensive understanding of the data.
Histograms and Box Plots
Histograms visually summarise the distribution of a univariate dataset by representing central tendency, dispersion, skewness, outliers, and multiple modes. They offer valuable insights into the data’s underlying distribution and can be validated using probability plots or goodness-of-fit tests.
Box plots are potent tools in EDA for presenting location and variation information and detecting differences in location and spread between data groups. They efficiently summarise large datasets, making complex data more accessible for interpretation and comparison.
Scatter Plots and Correlation Heatmaps
Scatter plots show relationships between two variables, while correlation heatmaps display the correlation matrix of multiple variables in a dataset, offering insights into their associations. Both are crucial for EDA.
Pair Plots and Parallel Coordinates
Pair plots provide a comprehensive view of variable distributions and interactions between two variables, aiding trend detection for further investigation.
Parallel coordinate plots are ideal for analysing datasets with multiple numerical variables. They compare samples or observations across these variables by representing each feature on individual equally spaced and parallel axes.
This method efficiently highlights relationships and patterns within multivariate numerical datasets.
Interactive Visualisations (e.g., Plotly, Bokeh)
Plotly, leveraging JavaScript in the background excels in creating interactive plots with zooming, hover-based data display, and more. Additional advantages include:
Its hover tool capabilities for detecting outliers in large datasets.
Visually appealing plots for broad audience appeal.
Endless customisation options for meaningful visualisations.
On the other hand, Bokeh, a Python library, focuses on human-readable and fast visual presentations within web browsers. It offers web-based interactivity, empowering users to dynamically explore and analyse data in web environments.
Descriptive Statistics for EDA
Descriptive statistics are essential tools in EDA as they concisely summarise the dataset’s characteristics.
Measures of Central Tendency (Mean, Median, Mode)
Mean, representing the arithmetic average is the central value around which data points cluster in the dataset.
Median, the middle value in ascending or descending order, is less influenced by extreme values than the mean.
Mode, the most frequently occurring value, can be unimodal (one mode) or multimodal (multiple modes) in a dataset.
Measures of Variability (Variance, Standard Deviation, Range)
Measures of Variability include:
Variance: It quantifies the spread or dispersion of data points from the mean.
Standard Deviation: The square root of variance provides a more interpretable measure of data spread.
Range: It calculates the difference between the maximum and minimum values, representing the data’s spread.
Skewness and Kurtosis:
Skewness measures data distribution’s asymmetry, with positive skewness indicating a right-tail longer and negative skewness a left-tail longer.
Kurtosis quantifies peakedness; high kurtosis means a more peaked distribution and low kurtosis suggests a flatter one.
Quantiles and Percentiles:
Quantiles and percentiles are used to divide data into equal intervals:
Quantiles, such as quartiles (Q1, Q2 – median, and Q3), split the data into four equal parts.
Percentiles, like the 25th percentile (P25), represent the relative standing of a value in the data, indicating below which percentage it falls.
Exploring Data Relationships
Correlation Analysis
Correlation Analysis examines the relationship between variables, showing the strength and direction of their linear association using the correlation coefficient “r” (-1 to 1). It helps understand the dependence between variables and is crucial in data exploration and hypothesis testing.
Covariance and Scatter Matrix
Covariance gauges the joint variability of two variables. Positive covariance indicates that both variables change in the same direction, while negative covariance suggests an inverse relationship.
The scatter matrix (scatter plot matrix) visually depicts the covariance between multiple variables by presenting scatter plots between all variable pairs in the dataset, facilitating pattern and relationship identification.
Categorical Data Analysis (Frequency Tables, Cross-Tabulations)
Categorical data analysis explores the distribution and connections between categorical variables. Frequency tables reveal category counts or percentages in each variable.
Cross-tabulations, or contingency tables, display the joint distribution of two categorical variables, enabling the investigation of associations between them.
Bivariate and Multivariate Analysis
Data science training covers bivariate analysis, examining the relationship between two variables, which can involve one categorical and one continuous variable or two continuous variables.
Additionally, the multivariate analysis extends the exploration to multiple variables simultaneously, utilising methods like PCA, factor analysis, and cluster analysis to identify patterns and groupings among the variables.
Data Distribution and Probability Distributions
Normal Distribution
The normal distribution is a widely used probability distribution known for its bell-shaped curve, with the mean (μ) and standard deviation (σ) defining its center and spread. It is prevalent in many fields due to its association with various natural phenomena and random variables, making it essential for statistical tests and modelling techniques.
Uniform Distribution
In a uniform distribution, all values in the dataset have an equal probability of occurrence, characterised by a constant probability density function across the entire distribution range.
It is commonly used in scenarios where each outcome has the same likelihood of happening, like rolling a fair die or selecting a random number from a range.
Exponential Distribution
The exponential distribution models the time between events in a Poisson process, with a decreasing probability density function characterised by a rate parameter λ (lambda), commonly used in survival analysis and reliability studies.
Kernel Density Estimation (KDE)
KDE is a non-parametric technique that estimates the probability density function of a continuous random variable by placing kernels (often Gaussian) at each data point and summing them up to create a smooth estimate, making it useful for unknown or complex data distributions.
Data Analysis Techniques
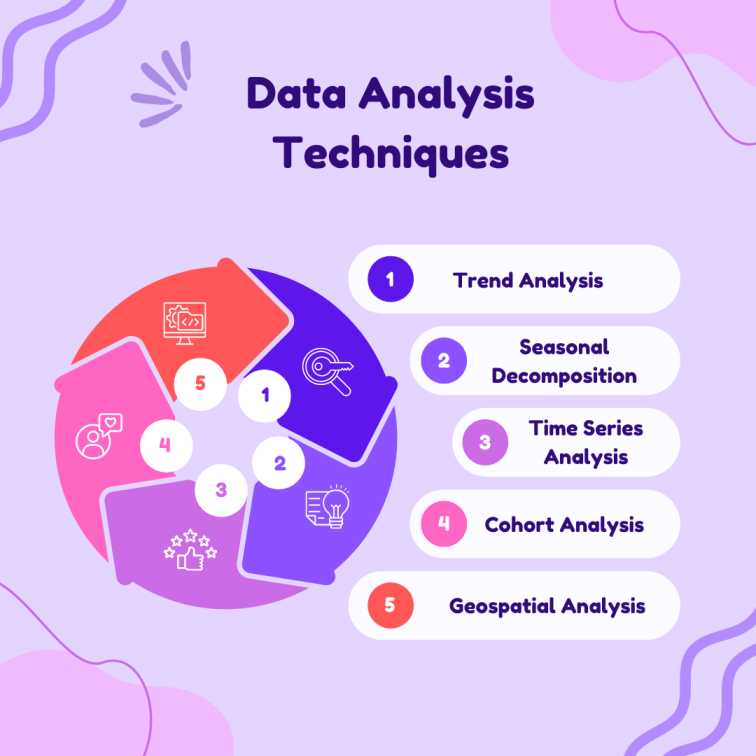
Trend Analysis
Trend analysis explores data over time, revealing patterns, tendencies, or changes in a specific direction. It offers insights into long-term growth or decline, aids in predicting future values, and supports strategic decision-making based on historical data patterns.
Seasonal Decomposition
Seasonal decomposition is a method to separate time series into seasonal, trend, and residual components, which helps identify seasonal patterns, isolate fluctuations, and forecast future seasonal behaviour.
Time Series Analysis
Time series analysis examines data points over time, revealing variable changes, interdependencies, and valuable insights for decision-making. Time series forecasting predicts future trends, like seasonality effects on sales, like swimwear in summer, and umbrellas/raincoats in monsoon), aiding in production planning and marketing strategies.
If you are interested in mastering time series analysis and its applications in data science and business, enrolling in a data analyst course can equip you with the necessary skills and knowledge to effectively leverage this method and drive data-driven decisions.
Cohort Analysis
Cohort analysis utilises historical data to examine and compare specific user segments, providing valuable insights into consumer needs and broader target groups. In marketing, it helps understand campaign impact on different customer groups, allowing optimisation based on content that drives sign-ups, repurchases, or engagement.
Geospatial Analysis
Geospatial analysis examines data linked to geographic locations, revealing spatial relationships, patterns, and trends. It is valuable in urban planning, environmental science, logistics, marketing, and agriculture, enabling location-specific decisions and resource optimisation.
Interactive EDA Tools
Jupyter Notebooks for Data Exploration
Jupyter Notebooks offer an interactive data exploration and analysis environment, enabling users to create and execute code cells, add explanatory text, and visualise data in a single executable document.
Using this versatile platform, data scientists and analysts can efficiently interact with data, test hypotheses, and share their findings.
Data Visualisation Libraries (e.g., Matplotlib, Seaborn)
Matplotlib and Seaborn are Python libraries offering versatile plotting options, from basic line charts to advanced 3D visualisations and heatmaps, with static and interactive capabilities. Users can utilise zooming, panning, and hovering to explore data points in detail.
Tableau and Power BI for Interactive Dashboards
Tableau and Microsoft Power BI are robust business intelligence tools that facilitate the creation of interactive dashboards and reports, supporting various data connectors for seamless access to diverse data sources and enabling real-time data analysis.
With dynamic filters, drill-down capabilities, and data highlighting, users can explore insightful data using these tools.
Consider enrolling in a business analytics course to improve your proficiency in utilising these powerful tools effectively.
D3.js for Custom Visualisations
D3.js (Data-Driven Documents) is a JavaScript library that allows developers to create highly customisable and interactive data visualisations. Using low-level building blocks enables the design of complex and unique visualisations beyond standard charting libraries.
EDA Best Practices
Defining EDA Objectives and Research Questions
When conducting exploratory data analysis (EDA), it is essential to clearly define your objectives and the research questions you aim to address. Understanding the business problem or context for the analysis is crucial to guide your exploration effectively.
Focus on relevant aspects of the data that align with your objectives and questions to gain meaningful insights.
Effective Data Visualisation Strategies
Use appropriate and effective data visualisation techniques to explore the data visually.
Select relevant charts, graphs, and plots based on the data type and the relationships under investigation.
Prioritise clarity, conciseness, and aesthetics to facilitate straightforward interpretation of visualisations.
Interpreting and Communicating EDA Results
Acquire an in-depth understanding of data patterns and insights discovered during EDA.
Effectively communicate findings using non-technical language, catering to technical and non-technical stakeholders.
Use visualisations, summaries, and storytelling techniques to present EDA results in a compelling and accessible manner.
Collaborative EDA in Team Environments
Foster a collaborative environment that welcomes team members from diverse backgrounds and expertise to contribute to the EDA process.
Encourage open discussions and knowledge sharing to gain valuable insights from different perspectives.
Utilise version control and collaborative platforms to ensure seamless teamwork and efficient data sharing.
Real-World EDA Examples and Case Studies
Exploratory Data Analysis in Various Industries
EDA has proven highly beneficial in diverse industries, such as healthcare, finance, and marketing. EDA analyses patient data in the healthcare sector to detect disease trends and evaluate treatment outcomes.
For finance, EDA aids in comprehending market trends, assessing risks, and formulating investment strategies.
In marketing, EDA examines customer behaviour, evaluates campaign performance, and performs market segmentation.
Impact of EDA on Business Insights and Decision Making
EDA impacts business insights and decision-making by uncovering patterns, trends, and relationships in data. It validates data, supports hypothesis testing, and enhances visualisation for better understanding and real-time decision-making. EDA enables data-driven strategies and improved performance.
EDA Challenges and Solutions
EDA challenges include:
Dealing with missing data.
Handling outliers.
Processing large datasets.
Exploring complex relationships.
Ensuring data quality.
Avoiding interpretation bias.
Managing time and resource constraints.
Choosing appropriate visualisation methods.
Leveraging domain knowledge for meaningful analysis.
Solutions involve data cleaning, imputation, visualisation techniques, statistical analysis, and iterative exploration.
Conclusion
Exploratory Data Analysis (EDA) is a crucial technique for data scientists and analysts, enabling valuable insights across various industries like healthcare, finance, and marketing. Professionals can uncover patterns, trends, and relationships through EDA, empowering data-driven decision-making and strategic planning.
Imarticus Learning’s Postgraduate Programme in Data Science and Analytics offers the ideal opportunity for those aspiring to excel in data science and analytics.
This comprehensive program covers essential topics, including EDA, machine learning, and advanced data visualisation, while providing hands-on experience with data analytics certification courses. The emphasis on placements ensures outstanding career prospects in the data science field.
Discounted Cash Flow (DCF) Valuation is a widely utilized method in finance to effectively estimate the intrinsic value of investments. It is a valuation technique that considers the future cash flows of an investment and adjusts them for the time value of money. This analysis is particularly relevant in investment banking capital markets, where informed decisions regarding acquisitions and capital budgeting are made.
DCF valuation and investment analysis are among the many valuation techniques covered in comprehensive investment banking courses. These courses aim to provide individuals with a thorough understanding of various valuation methodologies, including but not limited to DCF analysis, Comparable Company Analysis, Precedent Transaction Analysis, and Leveraged Buyout analysis. Through the study of these courses, individuals can develop a comprehensive perspective on company valuation.
Professionals equipped with investment banking skills and knowledge are highly sought after in the competitive financial industry. Their proficiency in analysing investments and providing guidance on mergers and acquisitions allows them to play a pivotal role in shaping successful business ventures. As a result, individuals who possess these investment banking skills become invaluable assets in the ever-evolving world of finance.
Understanding the Time Value of Money
The concept of the time value of money (TVM) asserts that the present worth of a sum of money is greater than its future value, primarily due to its potential for earning over the interim period. This fundamental principle holds utmost significance in the field of finance. In simple terms, holding a specific amount of money at present carries greater value than receiving the same sum at a later date.
Investment banking services play a crucial role in calculating the TVM for their clients and helping them make informed financial decisions. TVM is a fundamental concept in finance that states that a sum of money is worth more now than the same sum will be in the future due to its earning potential and the effects of inflation. Here’s how investment banking firms assist in calculating TVM:
Present Value (PV) and Future Value (FV):
Present Value (PV) and Future Value (FV) are important components of the time value of money. PV represents the current worth of money to be received in the future, while FV is the value of money after earning interest over time. Investors often prefer receiving money today as opposed to the same amount in the future due to the potential for growth through investments, such as the power of compounding interest.
The formula for TVM:
PV = FV / (1 + r)^n
Where:
PV = Present Value
FV = Future Value
r = Interest rate per period (expressed as a decimal)
n = Number of periods (time)
FV = PV * (1 + r)^n
Where:
FV = Future Value
PV = Present Value
r = Interest rate per period (expressed as a decimal)
n = Number of periods (time)
Discount Rate and Net Present Value (NPV):
The Discount Rate plays a crucial role in evaluating the time value of money, serving as the interest rate for determining the Net Present Value (NPV) of investment while considering the associated risk. NPV, which calculates the difference between the present value of cash inflows and outflows over time, serves as a tool for assessing the profitability of a project or investment.
Complementing NPV, the Internal Rate of Return (IRR) represents the discount rate that sets the NPV to zero and estimates the expected percentage return from an investment. In instances where NPV is zero, Excel can identify the IRR, indicating that the project breaks even with the cost of capital.
Cost of Capital:
The Cost of Capital represents the rate of return required by investors for providing capital to a company. It serves as the discount rate for investment evaluation, considering the risk associated with the investment
DCF Valuation Methodology
The DCF Valuation Methodology is a highly regarded investment banking financial modelling technique utilised in assessing the value of a business or investment by considering its projected future cash flows. The DCF analysis entails a series of crucial steps, such as the computation of Free Cash Flow (FCF), cash flow forecasting, terminal value estimation, selection of the suitable discount rate, and performance of sensitivity analysis.
Let us delve into each step of the DCF Valuation Methodology in detail:
Free Cash Flow (FCF) Calculation:
Free Cash Flow (FCF) is an imperative element in DCF analysis, as it signifies the cash generated by a business that can be allocated to investors or reinvested into the operation. The calculation of FCF involves commencing with the company’s operational cash flows and making adjustments for capital expenditures and variations in working capital.
The formula for computing FCF is as follows:
FCF = Operating Cash Flow – Capital Expenditures – Change in Working Capital.
Forecasting Cash Flows:
Forecasting cash flows is a crucial step in the DCF valuation process. Analysts project cash flows over 3 to 5 years, which significantly impacts the reliability of the valuation. Factors considered include revenue growth, operating expenses, capital expenditures, working capital changes, and tax rates.
Terminal Value Calculation:
DCF analysis extends beyond the forecast period, requiring estimation of the business’s value beyond that explicit period, known as the terminal value. Two common methods for calculating terminal value are the perpetual growth and exit multiple approaches.
Perpetual Growth DCF Terminal Value Formula:
Assuming continuous generation of Free Cash Flow at a normalised state, the perpetual growth terminal value is calculated as:
TV = (FCFn x (1 + g)) / (WACC – g),
where TV is the terminal value, FCFn is the final-year free cash flow, g is the perpetual growth rate of FCF, and WACC is the weighted average cost of capital.
Exit Multiple DCF Terminal Value Formula:
Based on observed comparable trading multiples for similar businesses, the exit multiple approach assumes the business will be sold for a multiple of a financial metric (e.g., EBITDA).
The formula for calculating the exit multiple terminal values is:
TV = Financial Metric (e.g., EBITDA) x Trading Multiple (e.g., 10x).
Choosing the Appropriate Discount Rate:
In calculating the present value of future cash flows, it is crucial to discount them using an appropriate discount rate. This rate considers the time value of money, opportunity cost, and investment risk. The most commonly used discount rate in DCF analysis is the weighted average cost of capital (WACC), which accounts for both debt and equity costs.
Sensitivity Analysis:
Sensitivity analysis is necessary for DCF valuations to examine the impact of various assumptions on the final valuation. By testing different scenarios, analysts can understand the range of potential valuations and the sensitivity of the valuation to changes in key variables.
Components of DCF Valuation
DCF analysis involves projecting future cash flows, discounting them to present value using a suitable discount rate (e.g., WACC). It also considers terminal value to estimate the company’s worth beyond the forecast period. Investment banking services rely on DCF analysis to ascertain the intrinsic value of investments or companies, facilitating informed financial decision-making.
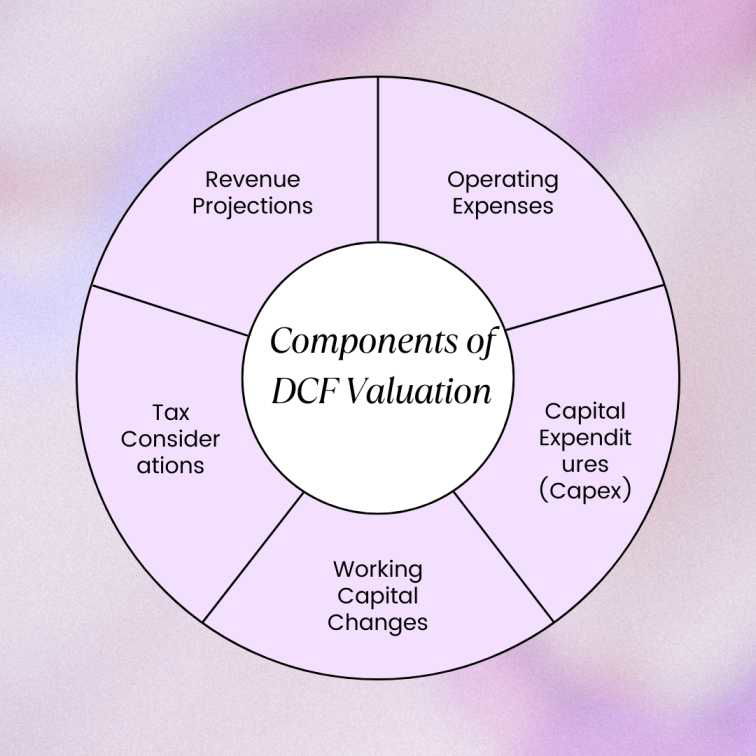
DCF Valuation comprises the following key components:
Revenue Projections: Forecasting future sales and income based on market trends, demand, and industry outlook.
Operating Expenses: Costs for day-to-day operations, like salaries, rent, utilities, marketing, and other expenses.
Capital Expenditures (Capex): Investments in fixed assets or long-term projects, such as equipment, infrastructure, or production expansion.
Working Capital Changes: Impacts of current assets and liabilities on cash flow, like inventory increase or accounts payable decrease.
DCF models are commonly utilised in finance to assess investments, value businesses, and inform financial decisions. These models rely on projected future cash flows and discounted rates to determine present investment or company value. By utilsing DCF methods, analysts and investors can evaluate opportunities and make informed investment choices.
DCF models and techniques include
Dividend Discount Model (DDM): This estimates stock value by calculating the present value of future dividends. Assumes the primary source of returns for investors is dividends, discounted using the required rate of return.
Cash Flow to Equity (CFE) Model: Focuses on cash flows available to equity shareholders. Calculates net cash flows after deducting interest expenses and debt obligations. Discounted using the cost of equity.
Cash Flow to Firm (CFF) Model: Estimates cash flows available to all capital providers. Considers equity and debt holders. Calculates free cash flow after accounting for expenses, taxes, capital expenditures, and working capital changes. Discounted using Weighted Average Cost of Capital (WACC).
Weighted Average Cost of Capital (WACC): This represents the average rate of return expected by the company’s investors. Considers proportion of debt and equity in capital structure. Used as the discount rate in DCF analysis. Reflects the company’s overall cost of financing.
Adjusted Present Value (APV) Model: Considers the value of potential tax shields or subsidies from financing decisions. Unlevered cash flows are discounted using the cost of equity to determine value without debt financing (NPV). Value of tax shields and subsidies added to arrive at APV.
Relative Valuation vs. DCF Valuation
Characteristics
Relative Valuation
DCF Valuation
Methodology
The target company’s financial metrics and valuation multiples are compared with similar companies in the same industry to determine its value based on market sentiment and peer performance.
This valuation method determines the target company’s intrinsic value using discounted cash flows, considering the time value of money and financial fundamentals.
Precision
The approach may be less precise as it relies on generalisations and may overlook unique company characteristics.
By considering cash flow projections, growth rates, and the cost of capital, it becomes more precise.
Basis
The valuation process relies on market multiples and assumes that companies within the same industry should have comparable metrics.
To accurately forecast cash flows, it is necessary to apply a discount rate that reflects the cost of capital, and then discount them back to the present.
Market Dependency
Dependent on market sentiment and prevailing market multiples.
Independent of market pricing and focuses solely on the company’s financial fundamentals.
Applicability
Quick assessments and benchmarking in the market.
Long-term investment decisions and in-depth analysis require sensitivity testing and scenario analysis.
Advantages
Easy to understand and apply. Captures the current mood of the market.
Provides a detailed and intrinsic valuation based on expected cash flows. Allows for sensitivity analysis.
Valuation Methods
Comparable Company Analysis (Comps) and Precedent Transaction Analysis (Precedents).
Discounted Cash Flow Analysis (DCF).
DCF Valuation is primarily ideal for:
Stable and established companies with predictable cash flows.
Long-term investment decisions backed by confidently projected cash flows.
Companies with distinctive characteristics deviating from comparable peers.
Rigorous analysis involving sensitivity testing and scenario assessment for risk evaluation.
DCF Valuation in Investment Decision-Making
DCF Valuation is a vital technique for investment decision-making, used in scenarios like business valuation, investment project evaluation, M&A analysis, and asset valuation. Investment banking firms rely on DCF Valuation to assess asset intrinsic value and inform financial decisions.
Let us examine its application in these contexts:
Valuing a Business or Company: In investment banking, professionals use DCF Valuation to estimate the present value of a business based on its future cash flows. By projecting cash flows, selecting a proper discount rate, and determining a terminal value, investment bankers derive the company’s intrinsic value. This method is crucial for mergers, acquisitions, and equity investment decisions, offering a comprehensive and unbiased view of the business’s worth.
Evaluating Investment Projects: DCF Valuation is a commonly employed method for assessing the financial viability of investment projects. By discounting future cash flows to present value using an appropriate discount rate, investment bankers can determine the project’s feasibility and profitability. This analysis aids in identifying lucrative investment opportunities and informing strategic investment decisions.
Merger and Acquisition (M&A) Analysis: DCF Valuation is crucial in M&A deals for determining the fair value of the target company. Investment banking services leverage this technique to analyse synergies and the financial impact of acquisitions, enabling them to negotiate a purchase price and assess financial attractiveness for clients.
Valuing Equity and Debt Instruments: DCF Valuation is commonly used by investment banking firms to estimate the fair value of equity and debt instruments. For common stock valuation, projected future dividends are discounted to derive the intrinsic value. Similarly, future cash flows from coupon payments and the bond’s maturity value are discounted to determine the fair value of bonds.
Assumptions and Limitations of DCF Valuation
DCF analysis is a commonly taught valuation method in investment banking courses. It helps estimate the intrinsic value of an asset or business based on projected future cash flows and a discount rate.
The common DCF Valuation assumptions and limitations are
Sensitivity to Projections: DCF analysis depends on assumptions made about future cash flows, discount rate, and terminal value. Slight variations in these inputs can significantly impact the calculated intrinsic value. Thus, the accuracy of the valuation depends on the reliability of these projections.
Forecasting Challenges: Accurately forecasting future cash flows is challenging due to uncertain economic conditions, market fluctuations, and projections for early-stage companies. These challenges may introduce inaccuracies in DCF valuation, influencing investment decisions.
Market and Economic Factors: DCF analysis assumes projected cash flows will continue into the future, ignoring potential changes in market dynamics, economic conditions, or competitive landscape. Unpredictable market and economic factors can impact company performance, reducing the long-term reliability of DCF projections.
Risk and Uncertainty: DCF Valuation may not fully account for all risks and uncertainties, such as unforeseen events, regulatory changes, or competitive threats. These factors can impact a company’s future cash flows and potentially introduce inaccuracies in the valuation model.
Real-World DCF Valuation Examples
Valuation of a Startup Company
Valuation of a Mature Company
Valuation of a Project or Investment
Valuation in Different Industries
DCF Valuation Best Practices
The following are the best practices for investment banking DCF valuation:
Gathering and Analysing Data:
When studying DCF Valuation in investment banking courses, it is imperative to grasp the significance of collecting and analysing pertinent data. This includes historical financial statements, industry trends, market data, and macroeconomic indicators. Thorough data analysis enables informed decision-making and the construction of robust valuation models.
Ensuring Consistency in Assumptions:
Students undergoing investment banking training should be aware of the importance of consistency in assumptions for DCF Valuation. Logical alignment and reliance on reliable data when making assumptions about revenue growth, profit margins, working capital, capital expenditures, and discount rates are paramount. Achieving consistency significantly improves the accuracy and reliability of the valuation model.
Communicating Results Effectively:
Efficient communication of DCF Valuation outcomes is emphasised in investment banking courses. The ability to articulate the methodology, assumptions, and sensitivity analysis in a clear and concise manner is vital. Visual aids, such as charts and graphs, can enhance the presentation and facilitate stakeholders’ understanding of the valuation’s implications.
Continuous Monitoring and Updates:
Investment banking training should stress the importance of continual monitoring and updates in DCF Valuation. Market conditions, business performance, and economic factors evolve over time, impacting the accuracy of projections. Regularly reviewing and updating the DCF model with the latest data ensures the valuation remains pertinent and reliable.
Conclusion
The DCF model is an essential tool used by various financial professionals to assess companies and make informed investment decisions. Students pursuing investment banking courses must master this model through a step-by-step approach, involving accurate cash flow forecasting and discounting.
However, it’s important to acknowledge that valuations can be affected by uncertain assumptions and unforeseen events, which may impact cash flow projections. Therefore, the DCF model should be seen as one of several methods for investment analysis.
Wandering how to get started with an investment banking course? Imarticus Learning is here to help!
At Imarticus Learning, we ensure that along with sharpening your skills through our robust investment banking course, you also receive an investment banking certification to facilitate your career progression in this field.
Earlier, most companies were sceptical about the idea of training through video games. That is a thing of the past now as more and more companies are realising the purpose behind game-based solutions- to educate employees better. Video games are just a tool to achieve this goal quickly and efficiently. This article will discuss how Imarticus Game Studio can help organisations in implementing successful game-based solutions.
Identify the goals
First things first, map out and prioritise the needs of an organisation, employees and target audience. Once these demands are identified, it will be easier to identify the goals. Organisations should think of the results they would want to achieve through game-based solutions. That will give clarity about the goals before moving into the development stage. Experts from Imarticus Game Studio will provide all the guidance required to make decisions. With their help, companies will be able to build an effective narrative.
Plan the environment
After identifying the game goals, it is time for the organisation to define the space where the game action will take place. As for this question- if the game was supposed to take place in person, what would the space look like? The idea is to virtually give employees a sense of real-life office situations and environments. Brainstorm with Imarticus Game Studio‘s expert team and find out elements that would give the employees this experience.
Decide on the Platform
Choosing the platform is a crucial decision because it determines the success of the game-based solution. Each platform has its own levels of complexity and can incorporate various features. So, make sure to choose the platform that best fits the business needs. PC, mobile, web etc. are some of the common platforms for game-based solutions. Imarticus Game Studio will do the research and suggest the options. The organisation can choose the platform that will work best for them and their team.
Plot an engaging storyline
New challenges should come the way of employees as they progress in the game. These challenges should reflect the learning objectives of the game. A lot of thinking and careful planning should go on into deciding these challenges. Keep in mind that the players receive feedback and guidance based on how they perform in these challenges. They are also to be rewarded after the completion of each task. Hence, it’s vital that they receive the right tasks at the right time in their virtual learning journey. Remember to develop an engaging scenario which has a clear beginning, middle and end. Imarticus Game Studio can help in achieving this goal.
Select intuitive interfaces and controls
One thing to be taken care of while building a game-based solution is that players should understand how to work with the controls easily. This way, they can focus on the challenges rather than spending additional time understanding how the game works. Clunky controls and usability issues will make the employees frustrated and disinterested in the game. One of the primary objectives of game-based solutions is to keep the employees engaged and not distracted. Ensure that the purpose and uses are clearly communicated and its effects can be reflected in the game. Imarticus Game Studio will make sure that the employees have the best experience while participating in the game-based training.
Develop a strategic game plan
The last step is to come up with a strategic game plan and a clear set of rules. This ensures that the game is designed with some serious strategies and that the results from challenges reflect those strategies. Define every parameter, including the resources employees have access to and how much they can win or lose. This process is simplified when companies have a set of well-defined goals in hand.
Key Takeaway
Using the benefits of game-based solutions to the organisation’s advantage is important in becoming an industry leader. Now that companies know the Imarticus Game Studio’s six-step formula to success, get in touch with their experts. To learn more about game-based learning solutions, visit Imarticus Learning.
The customer funnel depicts a customer’s entire path, from initial awareness and interest to consideration and conversion. It extends beyond the purchase stage, encompassing ongoing engagement and advocacy.
A sales & marketing leadership programme can help aspirants learn the basics of the customer journey and how to use customer funnelling to nurture leads and close deals.
Advantages of Customer Funnelling
Simple and clear understanding: The customer funnel is a simple concept that can be effectively tracked. It provides a straightforward visual representation of the customer journey.
Attracting a broad audience: It helps draw the attention of a large number of people to your company. As prospects progress through the stages, qualified leads are generated.
Building target groups: It enables the gradual formation of target groups, starting with a broad audience. It filters out less interested individuals, leaving those with a higher potential for conversion.
Tailored marketing: It guides marketers in tailoring their efforts to specific target groups. Addressing each segment’s unique needs and preferences enhances the overall effectiveness of marketing campaigns.
Consumer Journey
A client or consumer journey refers to interactions, offers, and channels guiding prospects or clients through your product/service range.
It can vary in duration depending on the complexity of your offerings. Some journeys may be brief, while others may be more extensive due to multiple product options or service levels.
The consumer journey involves:
Funnelling: Creating structured pathways guiding prospects towards specific actions or conversions.
Email communication: Using personalised and targeted email campaigns for nurturing and maintaining ongoing communication.
Text messages: Engaging prospects and clients through direct and timely text messaging platforms.
Voicemails: Leave thoughtful voicemails to follow up and provide additional information or offers.
Website presence: Establish an informative and interactive website, a central hub for prospects to explore your offerings.
Essential Stages of the Consumer Journey
Let’s explore the consumer journey stages through an example of someone looking to buy a new smartphone:
1. Awareness
The individual realises their current smartphone is outdated and doesn’t meet their needs anymore. They search for the latest smartphone models online and read reviews and articles about top brands and features.
2. Consideration
They narrowed their choices to two leading smartphone brands following extensive research. They compare each model’s specifications, prices, and customer feedback to make an informed decision.
3. Decision
The person purchases the smartphone from Brand X due to its excellent camera features, positive customer reviews, and a limited-time discount offer.
4. Retention
After using the smartphone for a few weeks, the individual receives personalised emails from the brand, offering tips on optimising the device’s performance and exclusive access to new software updates. It enhances their overall experience and loyalty to Brand X.
5. Advocacy
Impressed with the smartphone’s performance, the person shares their positive experience on social media, recommending the product to their followers. One of their friends sees the post and asks for a direct link to purchase the same smartphone.
The example shows how a consumer progresses through the journey stages, from becoming aware of the need to purchase, examining possibilities and finally becoming an advocate for the company.
Regularly reviewing and refining your consumer journey is essential to ensure a seamless and satisfying experience.
Here are the key stages to focus on:
Stage 1: Reach
Effectively target your audience by leveraging customer data, including voluntarily shared zero-party data.
Create audience personas for targeted ads on platforms like Google and social media.
You’ll build a more robust and engaged contact list by reaching the right people. Remember to collect only necessary data and avoid gathering unnecessary information.
Stage 2: Acquisition
Prevent customer loss by avoiding irrelevant messaging to newly acquired customers. Impersonal and generic email marketing can lead to a high customer unsubscribe rate.
Instead, ask customers about their preferences or offer a self-service content model for topic selection. Maintain customers’ trust in your brand by avoiding irrelevant messages.
Stage 3: Conversion
The conversion stage is where marketing and customer service converge. Collaborate between departments to ensure a smooth customer experience.
Implement channels like live chat to remove obstacles to purchasing and gather valuable data. Identify areas for website improvement and address frequently asked questions.
Use consumer data to create post-chat email automation, enhancing overall experiences and fostering robust and enduring customer relationships.
Stage 4: Retention
Leverage consumer data for personalisation during the post-purchase phase. Focus on collecting data that enables tailored product recommendations and content to keep customers engaged and retained.
Combine consumer interests, purchase history, and segmentation techniques like eRFM or lead scoring to create unique pathways for highly targeted customer segments.
Personalise marketing messages and offers based on customer data to drive relevance and conversions and cultivate consumer loyalty.
Stage 5: Loyalty
The loyalty stage aims to make consumers feel valued and deepen their connection with your brand.
Optimise earlier stages of the consumer journey to establish trust and demonstrate commitment to responsible data usage and privacy.
Invite loyal customers to participate in review panels or join loyalty programmes, encouraging a more vital investment in your brand.
This approach increases the likelihood of customers choosing your brand over competitors.
Customer Funnel vs Consumer Journey
Some of the primary differences between the two are:
Customer Funnel
Consumer Journey
Definition
A marketing model outlining the steps customers take to make a purchase decision and become a customer.
A holistic view of a consumer’s entire experience with a brand, from the initial awareness stage to post-purchase interactions.
Focus
Acquiring new customers and guiding them towards making a purchase.
Understanding and enhancing the overall consumer experience and fostering long-term relationships.
Scope
Limited to the stages leading up to a customer’s purchase decision.
Encompasses all touchpoints and interactions throughout the customer’s relationship with the brand, including the pre-and post-purchase stages.
Goal
Conversion of leads into customers.
Building loyalty, customer retention, and advocacy.
Marketing Focus
Attracting and converting potential customers.
Creating a seamless and positive experience at each touchpoint, from discovery to advocacy.
Importance
Essential for lead generation and sales.
Crucial for building strong customer relationships and fostering brand loyalty.
Conclusion
Understanding and effectively implementing customer funnelling and consumer journey strategies are crucial for driving business growth and success. Companies can enhance their sales and marketing performance by optimising the customer’s path from initial awareness to becoming loyal advocates.
Have you ever tried to navigate your way through insurance claims? Despite numerous phone calls, emails and then some more chasing after the customer care executives – oftentimes all this hustle goes in vain. Lack of substantial response ends up generating lower customer satisfaction and an even more bitter experience, until technology swoops in and saves the day.
In today’s fast-paced world, technology has been a disruptive force in almost every other industry. The insurance industry is not an exception. If you are looking forward to a career in fintech, knowing about insurtech is essential. In this blog, we shall try to understand how technology has penetrated the insurance market and explore the innovations that have impacted the industry altogether.
What is Insurtech?
As the word suggests, Insurtech is the technology designed to remodel the insurance industry to make it more customer-oriented and user-friendly. The term Insurtech comes from ‘insurance’ and ‘technology’ put together, inspired by Fintech (finance+technology). Insurtech now has effectively revolutionised the industry that once upon a time was made of tonnes of paperwork and some extremely tedious process of claim settlements. Along with that, insurtech has also come to ensure efficiency and cost-effectiveness while reducing errors and fraud with cutting-edge tools.
How so? Let us learn more.
Streamlined customer experience
Customer experience is one of the most crucial aspects of selling insurance. An improved customer experience is the catalyst of growth of the entire industry. But in the case of insurance, all the manual paperwork and process of claim settlement get quite cumbersome.
With the help of insurtech, one can easily purchase insurance policies online, have it customised based on their needs, submit claims simply with a tap of a finger and receive time-to-time updates on their mobile phones. Cloud computing and other technologies such as Artificial Intelligence and Machine Learning help in determining the amount of policy premiums based on the data provided by the customer. The digitised way not only makes buying insurance easier but also lets the customers navigate their way through the whole process with more convenience.
Advanced data analytics
Insurance is something that should be unique to individual customers. Every customer has their own set of needs and priorities. Insurance should be based on those essential points. Earlier, insurance used to have a set structure and customers had to buy a certain type of insurance to avail of specific benefits, all the while paying for things they did not need. Insurtech allows the much-needed customisations to insurance policies. With the help of artificial intelligence or AI, both insurers and customers can now analyse information to personalise packages.
Chatbots provide customer support to policyholders without the fuss of human interaction. Automation helps in designing an insurance policy that is solely fitted for the policyholder. For example, certain technical devices are installed nowadays in vehicles to collect data on driving behaviours. That data comes in handy in the future to calculate the amount of insurance premiums. Even wearable devices that can track various health metrics like heart rate, blood pressure, oxygen saturation in blood, and sleep patterns help design insurance policies for customers.
Blockchain and smart contracts
Blockchain is one of the pioneering technologies that has transformed the insurance industry for the better. Blockchain helps insurers create transparent and secure pathways for collecting and storing data of customers and their transactions. It also lets smart contracts automate the claim settlement process with more ease and efficiency. Smart contracts also come in handy in proceeding with the settlement after validating the claims of the policyholders. The execution of the entire process does not get started until the smart contract verifies the specific conditions that are to be met for the claim settlement. That is how this technology helps filter out potential fraudulent claims with finesse.
Internet of Things (IoT)
Internet of Things or IoT devices are the bridge between physical devices and software that analyse the data collected by them. Insurance providers heavily depend upon the real-time data collected by sensors and connected devices alike. For example, automobile insurers offer devices that gather data on vehicle conditions and driving patterns of the policyholder. The insurance premiums and the claim settlement amounts are decided based on those analytics. IoT devices are also capable of effectively identifying health hazards and contributing to the prevention of potential risk factors.
Pros of insurtech
Insurtech plays a pivotal role in filling the loopholes in traditional insurance policies with its new-age technological innovations. The reasons why customers these days are inclined towards opting for insurtech are:
Insurtech enhances the customer experience by providing easy access to policy-related information. The innovative technology also helps them understand the nitty-gritty of the coverage. As the entire service is available online, the customers do not have to travel to certain offices to derive any information whatsoever.
Insurtech focuses on the customisation of policies based on the needs of the policyholders. This technological trait makes the customers feel more comfortable with their investments.
Insurtech improves seamless efficiency in the industry. Earlier, insurers and customers had to research a lot and explore a lot of options before deciding on a policy that fits their bill. Now, with the help of technological tools, both the insurer and customer can finalise their desired policy within a much lesser time, with more accurate projections.
Insurtech ensures cost-effectiveness. Earlier, traditional insurance companies used to rely on manual labour and the miscellaneous cost would go up with no guaranteed outcome. Now with insurtech, companies engage staff remotely with almost no convenience cost and way more effective results.
Insurtech promotes flexibility as the AI tools, chatbot and automation are available 24×7 to find resolutions to the queries of the policyholders and potential customers.
Insurtech also accurately assesses the risk factors and provides optimised support in case of fraudulent activities.
Cons of Insurtech
Along with multiple pros, insurtech has a few cons as well:
Technologies, no matter how advanced they might be, can sometimes be extremely confusing for new users. With all these new-age tools at their disposal, it can get incredibly overwhelming for technologically challenged customers.
There also are nuances that are better explained by human agents than chatbots. Strictly online services can be limiting for all those enquiries.
Conclusion
The longstanding traditional insurance industry is now evolving rapidly with disruptive innovations like insurtech. Although insurtech is still at a nascent stage, it has revolutionised the insurance market with more certainty and sustainability. Insurtech has introduced a new way of looking at insurance policies and navigating through the nooks and corners of the industry. It has helped the customers with a more analytical approach and efficient yield. Some might say that the insurance industry is losing the human touch, but with its proven relevance, pace and responsiveness – it is safe to say that insurtech is here to stay.
Imarticus Learning provides an exceptionally insightful PGDM in Fintech. This course is designed in collaboration with Delhi School of Business. This 2-year full time course arms the students with in-depth knowledge and hands-on experience they can use to build a successful career in fintech. Sign up for the PGDM course today and prepare yourself for a brighter future.