Core Pricing Strategies for Marketing and Sales

In the world of marketing and sales, price is not just a number on a tag, it is a strategic lever that can make or break your success. Think of a perfectly crafted marketing campaign generating a flood of leads as an example, only to have them vanish at the sight of your pricing. Conversely, a well-defined pricing strategy can not only influence customer perception but also propel your brand image towards premium status.

This is where having a strategic approach to pricing becomes crucial. In today’s competitive landscape, simply guessing or mimicking competitors will not suffice. Well-defined pricing methods take into account a multitude of factors, from customer value perception to market trends, ensuring your price point not only reflects your product’s worth but also fuels your business’s profitability. I will delve into core pricing strategies in marketing and sales in this article and we will explore how to leverage them for both marketing and sales.

Mapping Your Pricing Territory

Before setting sail on your pricing adventure, a thorough exploration of the landscape is essential. Here is where market research comes in as your compass to navigate the competitive waters. By analysing competitor pricing strategies, you gain valuable insights into market trends and identify potential price gaps where your offering can shine.

But price is not a one-size-fits-all proposition. Understanding customer price sensitivity, which is how willing customers are to pay for your product or service, is equally important. This can be achieved through surveys, focus groups, or by analysing customer behaviour data.

Another key element is customer segmentation. Dividing your target audience into distinct groups based on shared characteristics like demographics, needs, or buying behaviours allows you to tailor your pricing strategy to resonate with each segment. For instance, a student segment might be more price-sensitive, while a segment of professionals might value premium features and be willing to pay a higher price.

Finally, do not set sail without a clear understanding of your internal costs. Factoring in production costs, marketing expenses, and your desired profit margin helps establish a baseline price floor that ensures your business remains healthy. By considering these elements such as competitor pricing, customer sensitivity, segmentation and internal costs, you can create a pricing strategy that is both competitive and profitable.

4 Core Pricing Strategies in Marketing and Sales

Now that you have mapped your pricing landscape, it is time to equip yourself with the essential pricing strategies in marketing and sales. Here, we will delve into four key approaches, each offering a unique perspective on setting the right price.

1. Value-Based Pricing: The Customer at the Heart

Value-based pricing shifts the focus from production costs to the perceived value your product or service delivers to the customer. In essence, you are asking, “What problem does my offering solve? How much is that solution worth to my customers?” By understanding your customer’s needs and quantifying the value you provide, you can justify a higher price point.

Communicating the Value Proposition

Effectively communicating your value proposition is paramount for success with value-based pricing. Here are some strategies:

  • Highlight quantifiable benefits: Do not just list features; showcase how they translate into concrete benefits for the customer. For example, instead of simply stating “increased productivity,” quantify it as “saves X hours per week.”
  • Focus on customer pain points: Address the challenges your target audience faces and demonstrate how your product alleviates those pain points. This creates a sense of urgency and willingness to pay a premium for the solution.
  • Use customer testimonials and case studies: Real-world examples from satisfied customers can powerfully illustrate the value your product delivers.

Real-World Example: Dollar Shave Club

Dollar Shave Club disrupted the razor market with a value-based pricing strategy. They focused on the frustration of expensive, over-hyped razors and offered a high-quality, convenient alternative at a significantly lower price. By clearly communicating the value proposition which is quality razors delivered directly to your doorstep at a fraction of the cost, Dollar Shave Club achieved immense success.

2. Competitive Pricing: Navigating the Market Currents

Competitive pricing involves setting your price based on what similar products or services cost in the market. These types of pricing methods in marketing and sales can be a good starting point, especially when entering a new market or targeting a price-sensitive audience.

Common Competitive Pricing Strategies in Marketing and Sales

  • Price Matching: Match the prices of your direct competitors to remain competitive and gain customer consideration.
  • Leader Pricing: Offer a low introductory price to attract new customers and gain market share. This can be effective for new product launches or subscription services.
  • Premium Pricing: Position your product or service as high-end and luxurious, justifying a higher price point through superior quality, exclusive features, or exceptional customer service. Think Apple products or high-end designer clothing.

Case Study: Amazon and Price Matching

Amazon is a master of competitive pricing. They constantly monitor competitor prices and use dynamic pricing algorithms to adjust their own prices in real time. This ensures they remain competitive and often offer the lowest price, attracting a vast customer base.

3. Cost-Plus Pricing: A Straightforward Approach

Cost-plus pricing method in marketing and sales involves adding a markup to your product’s production cost to arrive at a selling price. This strategy is simple to implement, but it has limitations.

Limitations of Cost-Plus Pricing

  • Neglects customer value: This approach does not consider the value proposition and may not reflect what customers are willing to pay.
  • Price wars: If solely focused on covering costs, you might end up in a race to the bottom with competitors, sacrificing profitability.

Scenarios for Cost-Plus Pricing

While generally not the most strategic approach, cost-plus pricing can be relevant in specific situations:

  • New businesses: If you are a new company with limited market data, cost-plus pricing can provide a starting point while you gather customer insights.
  • Commoditised products: For basic, undifferentiated products, cost-plus pricing might be sufficient as competition focuses primarily on price.

4. Psychological Pricing: The Power of Perception

Psychological pricing leverages the way human minds perceive prices to influence buying behaviour. These tactics tap into subconscious biases to make customers feel like they are getting a good deal.

Common Psychological Pricing Strategies in Marketing and Sales

  • Charm Pricing: Ending prices in $.99 creates the perception of a lower price compared to a rounded number.
  • Price Bundling: Offer multiple products at a discounted price compared to buying them individually. This creates a sense of value and encourages customers to purchase more.
  • Anchoring: Set a high initial price followed by a lower “sale” price. The initial price creates a reference point, making the sale price seem more appealing. Think MSRP vs. “sale price” on clothing.

Examples of Psychological Pricing

Many companies use these techniques effectively. Grocery stores strategically place higher-priced items at eye level, while airlines often display a high initial price for a desirable route or seat, followed by a seemingly endless list of lower-priced options with more restrictions (e.g., extra legroom, checked baggage) to make their base price seem more attractive. Here are a few examples:

  • Limited-time offers: Scarcity and urgency can trigger impulse purchases. Phrases like “limited-time offer” or “only X left in stock” create a sense of missing out and encourage customers to buy quickly.
  • Free shipping thresholds: Offering free shipping above a certain purchase amount incentivises customers to spend more to reach that threshold.

Choosing the Right Core Pricing Strategy

The ideal pricing strategy depends on your specific business model, target audience, and product or service offering. Consider these factors when making your decision:

  • Value proposition: How much value does your offering provide to customers?
  • Target market: Are you targeting a price-sensitive or value-conscious audience?
  • Competition: How are your competitors priced?
  • Product differentiation: What makes your offering unique and worth a premium price?

Sales and marketing courses can help you learn how to choose the right pricing methods in more detail. 

Pricing and the Bridge Between Marketing and Sales

Your pricing strategy is not an island and it plays a vital role in both your marketing and sales efforts. By fostering a strong connection between pricing, marketing, and sales, you create a cohesive strategy that positions your product or service effectively, attracts the right customers, and ultimately drives sales growth. Here is how to leverage pricing to bridge the gap and fuel success:

Marketing and Pricing Methods

  • Targeted Messaging: Pricing strategy informs your marketing message. Value-based pricing allows you to highlight the unique benefits your product offers, justifying your price point. Conversely, competitive pricing might require emphasising features that differentiate you from competitors.
  • Segmentation Savvy: Customer segmentation becomes even more potent when combined with pricing. You can tailor marketing campaigns and messaging to resonate with different price sensitivity levels within your target segments.
  • Campaign Calibration: Pricing strategy directly impacts your marketing campaigns. For instance, promoting a premium product might require a more sophisticated marketing approach compared to a budget-friendly option.

Sales and Pricing Methods

  • Negotiation Navigation: Understanding customer price sensitivity empowers your sales team to navigate negotiations effectively. They can anticipate objections and tailor their approach based on a customer’s willingness to pay.
  • Value-Based Selling: Value-based selling techniques become crucial when justifying your pricing. Equipping your sales team to translate product features into quantifiable benefits strengthens their ability to demonstrate the value proposition and secure deals.
  • Sales Savvy: Sales training should integrate pricing strategies and objection handling. Role-playing exercises can equip your team to confidently address customer concerns about price and highlight the value your offering delivers.

Advanced Pricing Tactics for the Modern Marketplace

The core pricing strategies we have explored are a solid foundation, but the pricing landscape offers even more possibilities. Exploring these advanced techniques, alongside the core strategies, empowers you to craft a truly dynamic pricing approach that adapts to market fluctuations and maximises profitability in the ever-evolving digital landscape. Remember, the optimal pricing strategy is a continuous exploration, and staying informed about these advancements can give your business a significant edge.

For businesses seeking a competitive edge, consider venturing into these advanced pricing methods:

  • Dynamic Pricing: This approach adjusts prices based on real-time factors like demand, competitor pricing, and customer behaviour. Airlines and ride-sharing services often leverage dynamic pricing to optimise revenue.
  • Freemium Model: This strategy offers a basic version of your product or service for free, with premium features or functionalities available for a fee. This can be a great way to attract a large user base and convert some to paying customers.
  • Subscription Pricing: This model provides access to your product or service for a recurring fee, often monthly or annually. Subscription pricing creates predictable revenue streams and fosters customer loyalty.

Wrapping Up

In this guide, we have covered the core pricing strategies in marketing and sales while exploring how to leverage them for both marketing and sales. You now know exactly how important these pricing strategies are for businesses. Always remember that pricing is not a one-time decision, it is an ongoing journey of exploration and refinement. 

I also want you to remember that you should continuously monitor market trends, gather customer feedback through surveys or A/B testing, and finally, do not be afraid to experiment. The perfect pricing strategies in marketing and sales are the one that optimises profitability, align with your business goals, and resonate with your target audience. 

Enrol in the Chief Business Officer Programme by Imarticus Learning in collaboration with IIM Udaipur to take your career to new heights. This programme will teach you everything you need to know about the essential pricing strategies for marketing and sales. 

Frequently Asked Questions

  • I am overwhelmed by all these pricing strategies. Which one should I use?

There is no one-size-fits-all answer. The best pricing strategy depends on several factors such as your product or service, target market, competition, and business goals. This course will equip you to analyse these factors and choose the strategy that optimises your profitability and sales.

  • My competitors are offering lower prices. How can I compete without sacrificing profit?

Understanding your competitor’s pricing strategy is crucial. However, focusing solely on undercutting them can lead to a price war. This course explores value-based pricing, which helps you set prices based on the perceived value your product offers to customers, allowing you to compete effectively without compromising profit margins.

  • How can I ensure my sales team effectively communicates the value proposition to justify our pricing?

Pricing goes hand-in-hand with effective communication. This Chief Business Officer program emphasises how to translate pricing strategies into clear messaging for your sales team. You’ll learn how to communicate the unique value your product or service delivers to customers, justifying your pricing decisions and closing more deals.

  • Is this Imarticus program relevant for B2B (business-to-business) sales as well?

While some strategies might require adaptation, understanding core pricing concepts is essential for B2B sales as well. The sales, marketing and business course explores strategies relevant to negotiating with businesses, considering factors like cost structures and long-term contracts when developing your pricing approach.

Essentials of Asset Management: Current Assets vs. Non-Current Assets

The financial world can be very complex with resources, strategies and stakeholders all playing critical roles. At the heart of company finances lie assets, the very foundation upon which a company builds its success.

We will explore current assets that keep a company’s day-to-day operations running smoothly as well as non-current assets that are the building blocks of a company’s future. This guide will not be just about basic definitions, it will also be about uncovering hidden insights such as introducing the “liquidity spectrum” to rank current assets based on their convertibility to cash.

By the end of this article, you will understand how asset management strategies impact stakeholders, from investors and creditors to the company’s management team itself. You will gain a deeper appreciation for interactions between different asset classes and their role in driving financial stability and long-term growth. Let us dive in.

Tangible, Intangible, and Financial Assets

Before we get into what are current assets or what are non current assets, we must first find out what assets really are. The dry textbook definition of assets is simply “resources owned by a company”. In the real world, assets are the lifeblood of a business, playing a critical role in its financial health and operational capabilities. Let us first move beyond the one-dimensional view of assets.

There are three key asset classifications that paint a more nuanced picture:

Tangible Assets

These are the physical resources you can see and touch. Think of buildings, machinery, equipment, inventory or even land. A manufacturing company’s production line, for example, is a tangible asset that directly contributes to its ability to produce goods.

Intangible Assets

These assets are non-physical but hold significant value. They include intellectual property like patents, trademarks, copyrights, brand reputation, or even customer data. A pharmaceutical company’s patented drug formula is an intangible asset that grants a competitive edge and drives future revenue.

Financial Assets

These represent claims of ownership or value held by a company. They encompass cash equivalents (highly liquid assets like checking accounts or short-term investments), accounts receivable (money owed by customers), or even investments in other companies. A retail chain’s inventory of unsold clothing is a tangible asset, while the money owed by customers who have not paid yet is a financial asset (accounts receivable).

Current Assets Explained

What are what are current assets? Current assets are the dynamos that keep a company’s engine running smoothly. They represent the resources a company expects to convert into cash within one year or its operating cycle (whichever is longer). We can think of them as the company’s readily available reserves to meet short-term obligations like rent, salaries, and supplier payments. Let us explore how they function within the vital business cycle:

The Liquidity Cycle in Action

A company’s operations as a continuous loop is known as the liquidity cycle. It starts with cash used to purchase inventory (raw materials or finished goods). This inventory is then sold to customers, generating accounts receivable (money owed by customers). Once these receivables are collected, the cash flows back into the company, ready to start the cycle again. Current assets play a starring role in each stage:

  • Inventory: The raw materials or finished goods waiting to be sold.
  • Accounts Receivable: The money owed by customers for purchases made on credit.
  • Cash and Cash Equivalents: Highly liquid assets like checking accounts or short-term investments that can be easily converted to cash.

The Liquidity Spectrum

Not all current assets are created equal. The “liquidity spectrum” helps us understand how quickly each type can be converted to cash:

  • Highly Liquid Assets (at the top of the spectrum): Cash and cash equivalents sit at the top, readily available to meet immediate needs.
  • Moderately Liquid Assets: Marketable securities (short-term investments) fall here, easily convertible to cash but potentially with slight price fluctuations.
  • Less Liquid Assets: Accounts receivable come next. While they will eventually turn into cash, there might be a delay in collection depending on customer payment terms.
  • Least Liquid Assets (at the bottom of the spectrum): Inventory takes the bottom spot. While it will be sold eventually, the conversion process takes time.

Real-world Scenarios

  • A grocery store needs to ensure it has enough cash on hand (highly liquid) to pay its suppliers for fresh produce (inventory) before selling it to customers (generating receivables).
  • A manufacturing company might hold readily convertible marketable securities to cover unexpected expenses while waiting for customer payments on large orders (receivables).

Red Flags on the Horizon

Inefficiencies in current asset management can create potential problems:

  • High Inventory Turnover: While some turnover is healthy, excessively high rates might indicate overstocking, leading to storage costs and potential obsolescence.
  • Slow Receivables Collection: Long delays in customer payments can strain cash flow and limit a company’s ability to meet short-term obligations.

Non-Current Assets Explained

Current assets keep the daily operations humming, but what about the company’s long-term growth? So what are non current assets? Enter non-current assets, the sturdy backbone that provides a foundation for future success. These assets are not readily convertible to cash within a year but hold immense value in driving long-term profitability and competitive advantage.

Building Blocks for the Future

Think of non-current assets as investments in a company’s future potential. They encompass:

  • Property, Plant, and Equipment (PP&E): This includes buildings, machinery, factories, and vehicles – the physical infrastructure that enables production and operations. A manufacturing company’s production line exemplifies a non-current asset that directly contributes to its long-term production capacity.
  • Intangible Assets (Long-Term): Patents, trademarks, copyrights, and brand reputation all fall under this category. These assets create a competitive edge and drive future revenue streams. A pharmaceutical company’s patented drug formula is a prime example, offering a long-term advantage in the market.

Depreciation

Non-current assets have a useful life, and their value diminishes over time due to wear and tear, obsolescence, or market changes. Depreciation is an accounting concept that reflects this decline in value, spreading the cost of the asset over its useful life. Here are two common depreciation methods:

  • Straight-Line Depreciation: This method allocates an equal amount of depreciation expense to each year of the asset’s useful life. Think of a building with a 10-year lifespan, its value is depreciated evenly over those 10 years in the financial statements.
  • Accelerated Depreciation: This method recognises a higher depreciation expense in the earlier years of an asset’s life, reflecting the faster rate of decline in value during that initial period. Think of high-tech equipment that becomes outdated quickly. Accelerated depreciation acknowledges this faster value decrease.

Maximising the Backbone’s Potential

Effective management of non-current assets is crucial for maximising their long-term returns:

  • Proper Maintenance: Regular maintenance extends the life of non-current assets and reduces the need for premature replacements. A well-maintained factory can operate efficiently for decades.
  • Strategic Upgrades: Investing in upgrades to non-current assets can improve efficiency, enhance capabilities, and maintain a competitive edge. Modernising manufacturing equipment can lead to increased production output.
  • Optimising Utilisation: Ensuring non-current assets are used to their full potential maximises their return on investment. Utilising factory space efficiently translates to higher production volume.

Current vs. Non-Current Asset Management Strategies

Companies must achieve a healthy balance between current and non-current assets to ensure both financial stability and long-term growth. Let us delve into the art of this balancing act.

The Golden Ratio

An excess of current assets might appear safe, offering readily available cash. However, it can also indicate underinvestment in long-term growth opportunities. Conversely, an overemphasis on non-current assets can lead to cash flow problems if a company struggles to convert them to cash quickly enough to meet short-term obligations. Finding the optimal balance is key.

Industry Matters: Tailoring the Asset Mix

The ideal ratio of current to non-current assets varies depending on the industry:

  • Manufacturing companies: Often require a significant investment in property, plant, and equipment (non-current assets) to maintain production capacity. They might hold a slightly lower proportion of current assets compared to service industries.
  • Retail companies: Need to maintain a healthy level of inventory (current asset) to meet customer demand while also having enough cash flow to cover operating expenses. They might strike a more balanced approach between current and non-current assets.

Financial Forecasting and the Asset Roadmap

Effective asset management strategies are intricately linked to financial forecasting. By analysing the current and projected future needs of the business, companies can make informed decisions about asset allocation:

  • Future Growth Plans: Expansion plans might necessitate additional investments in non-current assets like new factories or equipment. Asset management strategies should adapt to accommodate such growth.
  • Debt Management: High-interest debt obligations might require a focus on maintaining a strong current asset position to ensure sufficient cash flow for repayments. Asset management strategies should consider debt servicing needs.

The Balancing Act: A Continuous Process

Maintaining a healthy balance between current and non-current assets is an ongoing process. Companies need to constantly evaluate their asset mix and adjust strategies based on market conditions, industry trends, and future business goals. By mastering this balancing act, companies can navigate the path towards financial stability and sustainable long-term growth.

A solid CFA course will teach you everything you need to know about current and non-current assets as well as how to effectively use them for business. Enrol in the Chartered Financial Analyst (CFA) Program by Imarticus and become a CFA in the coming months.

Unconventional Assets and the Future of Management

The world of assets is no longer confined to traditional categories. As the economy evolves, new asset classes are emerging, presenting both opportunities and challenges for asset managers. This section dives into these hidden gems and explores the future landscape of asset management.

Beyond Brick and Mortar: Unconventional Asset Classes

  • Intellectual Property (IP): Patents, copyrights, and trademarks are no longer just intangible concepts. They are increasingly recognised as valuable assets, requiring specialised management strategies for protection, licensing, and potential monetisation.
  • Digital Assets: Cryptocurrencies, digital art (NFTs), and other digital collectables are gaining traction, introducing a new asset class with unique valuation challenges and security considerations.

Unique Management Challenges

These unconventional assets present unique management hurdles:

  • Valuation: Unlike traditional assets with established valuation methods, unconventional assets might require specialised expertise and innovative approaches to determine their fair value.
  • Risk Management: The inherent volatility of some unconventional assets, like cryptocurrencies, demands robust risk management strategies to mitigate potential losses.
  • Regulation and Legal Considerations: The regulatory landscape surrounding some unconventional assets is still evolving, requiring asset managers to stay updated on legal frameworks and compliance requirements.

Emerging Trends: Technology Reshaping Asset Management

Technology is transforming the asset management landscape:

  • Blockchain: This distributed ledger technology offers increased transparency, security, and efficiency in tracking and managing ownership of assets, particularly digital assets.
  • Artificial Intelligence (AI): AI algorithms can analyze vast datasets to identify investment opportunities, optimise asset allocation strategies, and predict potential risks associated with unconventional assets.

Future-proofing Asset Management

To thrive in this dynamic environment, asset managers need to adopt best practices:

  • Embrace Continuous Learning: Staying updated on emerging asset classes, technological advancements, and regulatory changes is crucial.
  • Develop Specialised Skills: Building expertise in unconventional asset valuation, risk management, and technology integration will create a competitive edge.
  • Adaptability and Innovation: The ability to adapt strategies and embrace innovative approaches will be essential for navigating the ever-evolving world of assets.

Wrapping Up

From the tangible tools to the intangible treasures, current and non-current assets both play crucial roles in a company’s success. By understanding their classifications, managing them strategically, and adapting to the evolving world of unconventional assets and technology, you have gained the knowledge to navigate this intricate maze.

Remember, effective asset management is a continuous journey, and this guide has equipped you with the tools to become a master strategist on that path. Wish to become a CFA? Enrol in the Chartered Financial Analyst (CFA) Program by Imarticus. This CFA course will teach you how everything you need to know about domains such as asset management, financial analytics and financial planning.

Frequently Asked Questions

  • What is the main difference between current assets and non-current assets?

The key difference lies in liquidity, which refers to how easily an asset can be converted into cash.

  1. Current assets: These are assets that can be converted into cash within one year (or the operating cycle, if longer). Examples include cash, inventory, and accounts receivable.
  2. Non-current assets: These are assets that are not expected to be converted into cash within one year. They are held for long-term use and contribute to the company’s ongoing operations or future value. Examples include land, buildings, equipment, and long-term investments.
  • Why is understanding the difference between these assets important?

Knowing the breakdown of current vs. non-current assets helps assess a company’s financial health in several ways:

  1. Short-term liquidity: A healthy balance of current assets ensures a company can meet its short-term obligations like paying bills and covering operating expenses.
  2. Long-term solvency: Non-current assets represent a company’s long-term investment and contribute to its future earning potential.
  3. Efficiency: Analysing how efficiently current assets are managed (e.g., inventory turnover) provides insights into operational effectiveness.


  • How does Imarticus Learning’s CFA course cover current and non-current assets?

This CFA course delves into the different types of current and non-current assets, explaining their characteristics and importance within asset management. You’ll learn how to identify and value these assets, analyse their impact on financial statements, and understand their role in financial planning and decision-making.

  • Is this CFA course only for aspiring asset managers?

This CFA course is valuable for anyone interested in understanding the fundamentals of asset management. It is particularly beneficial for finance professionals, business owners, and investors who want to improve their ability to analyse a company’s financial health and make informed investment decisions.

Applications of Blockchain in Fintech

In the past few years, the popularity of fintech has seen a sudden rise around the globe although this concept has existed from the cusp of the 21st century. Companies have witnessed huge success after switching to newer technology from traditional methods. 

The concept of blockchain applications in fintech is still relatively new and it is rapidly evolving. Nowadays, various brand-new finance applications appear every day, providing updated and creative approaches for handling and processing payments. 

Read on to explore the applications of blockchain in the fintech industry and how it transforms the way people send, receive, store and manage their money.

What is Fintech Blockchain?

Blockchain is a decentralised ledger or a peer-to-peer (P2P) ledger that is used to study data and transactions of various public computer networks. Various industries have adopted the usage of blockchain technology including the fintech industry. This adoption by the fintech industry has given birth to a new blockchain model that is known as decentralised finance (DeFi).

Decentralised finance (DeFi) is the perfect amalgamation of fintech and blockchain technologies. There are various similarities between these two technologies hence many companies are investing in the further growth of DeFi. This growth of blockchain applications in the fintech industry will eventually eliminate all third parties and will create a stronger security system with the help of a decentralised and transparent digital ledger.

The market value of blockchain is going to grow rapidly and most of the companies will become extremely dependent on this technology. Therefore, it is advisable to learn more about blockchain from various online certification courses to sustain in the competition.

Why has the Fintech Industry Adopted Blockchain?

In recent years, plenty of fintech companies have adopted blockchain applications in their business management. Previously there were various challenges like delayed targets, immense losses, and failed fundraising that fintech companies used to face. With the help of blockchain technology, fintech companies have overcome those challenges.

Here is a list of challenges that a company can overcome by using blockchain technology:

Inflated Operational Cost

Operational cost in a fintech market is usually very high. The work related to operation is often dealt with by various third parties which usually takes a lot of time. In this industry, time is considered to be money hence eliminating the third parties will save a lot of time as well as money.

Blockchain applications allow a fintech company to eliminate these third parties as a result, these companies can easily save half of the capital they were spending for the operational cost. This technology also saves a lot of time which the third parties use to take.

High Dependency on Third Parties

High dependency on third parties is one of the most common challenges that the fintech industry often faces. Most of the transactional and operational power is in the hands of the third parties which creates a huge problem with commitments and deadlines. Currently, this challenge has been optimised and resolved as the fintech industry has adopted blockchain technology.

Lack of Reliability

Previously the performers who were using the fintech applications did not have any knowledge about the operations that were taking place on the other side. Therefore, gradually people lost their trust in such fintech applications. However, after the incorporation of various blockchain applications, the fintech companies are more transparent and reliable.

Hence, this challenge that was frequently faced by fintech was easily solved by the latest blockchain technology.

Slow Procedures

Previously, the operational procedures were extremely slow as the entire fintech industry depended heavily on third parties. These third parties had contracts to work for various fintech companies. This resulted in slow procedures and poor outcomes along with client dissatisfaction.

However, this challenge was easily solved with the help of blockchain technology.

Importance of Blockchain in Fintech Industry

Importance of Blockchain in Fintech

Blockchain applications are extremely important for the fintech industry, here are a few points that will justify this statement.

  • Transparency

Various blockchain applications often update the information of various procedures and standards with the client as well. This creates a transparent relationship between the company and its clients. Transparency helps a company enhance its data integrity along with customer experience.

  • Top-Notch Performance

Blockchain technology usually works with hybrid and private networks while dealing with financial works. This increases the rate of transaction to a hundred per second. Hence, blockchain enhances the performance and scalability of a company.

  • Privacy

Fintech companies are adopting blockchain applications as they provide better privacy with the help of various tools. This technology can easily enhance the privacy of a company while making it extremely transparent for consumers and clients.

  • Uniform Data

Blockchain applications make sure that a company has uniform data by implementing the same rule for data transmission and data nodes. This method also keeps the data unalterable.

  • Reduction of Fees and Settlement Time

Blockchain applications allow a fintech company to eliminate all the third parties with whom it used to work earlier. This shift from the traditional financial system to the blockchain system reduces the service fees of such companies by almost 80%.

With the assistance of blockchain applications, a fintech company can reduce its settlement time as well. Waiting time for certain transactions has been reduced from three or four days to a few seconds.

  • Trust and Security

Blockchain applications have improved security for various fintech companies. Due to this reason consumers and clients have re-gained their trust in such fintech companies. Blockchain technology allows the usage of security code that can not be easily tampered with by any hacker or third party.

This makes it impossible for the hacker to hack the system. This kind of security and transparency by blockchain technology automatically builds trust among the clients as well as the customers. Blockchain also acts as a trusted ledger that can be used for managing, storing, and transmitting data.

Real-Life Blockchain Use Cases in Fintech Industry

There are various real-life blockchain use cases in the fintech industry. These cases have been elucidated below:

  • Digital Payments

Fintech companies use various blockchain applications to make digital payments easier with the assistance of certain services. These services are cross-border money transactions, security settlements, trading of cryptocurrency, etc. In real life, some platforms like Coinbase allow users to buy and transfer digital currencies like cryptocurrency. 

  • Trading

With the introduction of the decentralised finance (DeFi) system, trading has become decentralised from various exchanges. The technology no longer allows intermediaries to intervene during a trading procedure. It also supervises the demand and supply of a trade before creating a rate.

Uniswap is a real-life decentralised trading company that allows users to trade independently without involving intermediaries. 

Conclusion

Blockchain technology is going to stay and evolve in the fintech industry. Hence, companies are steadily hiring employees who are well-versed with blockchain. To stay in the competition various companies are enrolling their senior employees in the senior leadership programme that will provide knowledge about blockchain.

Imarticus Learning in collaboration with the Indian School of Business (ISB) has a senior leadership programme in fintech. This programme is ideal for those who want to learn more about blockchain and fintech. Enrol now to boost your career.

Frequently Asked Questions (FAQs)

  • What is Fintech Blockchain?

The amalgamation of fintech and blockchain together is known as fintech blockchain or decentralised finance (DeFi). It assists in creating a new and stronger security and operation system for a fintech company.

  • What are the various blockchain tools?

The various blockchain tools are solidity, geth, Web3.js, ganache, embark, remix, etc.

  • What are the most common blockchain use cases in the fintech industry?

There are various blockchain use cases in the real world. Blockchain can be used in healthcare, cross-border payment, asset management, cryptocurrency, etc.

  • What are the different types of Blockchain?

There are four various types of blockchains. These are plain blockchain, private blockchain, hybrid blockchain, and consortium blockchain.

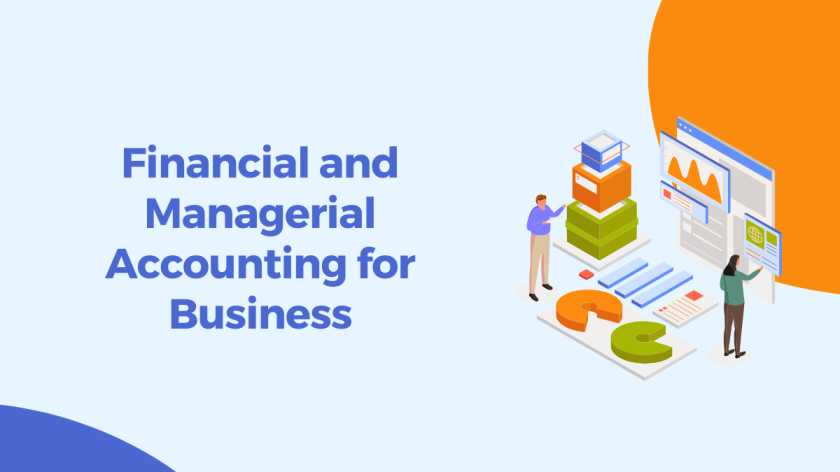
A Look into the Combined Approach of Financial and Managerial Accounting for Business: For the Public vs. for the Company/Management

The financial well-being of a business is a dynamic landscape, requiring a multifaceted approach to navigate. Financial accounting acts as the foundation, meticulously recording a company’s financial activities and generating standardised reports for external users like investors and creditors.

Managerial accounting, on the other hand, empowers internal decision-making. It leverages historical data along with non-financial metrics and future projections to provide a more nuanced and adaptable view. For instance, in cases such as adding depth and future-oriented details to the financial map.

In this article, we will discuss how the two accounting systems can be integrated into businesses for even greater financial insights. We will also cover the importance of clear communication between departments using financial and managerial accounting data. You’ll see how financial and managerial accounting, working in harmony, act as a strategic compass, guiding businesses towards informed decision-making and sustainable growth.

Financial and Managerial Accounting in Business

The financial health of a business is a complex puzzle, requiring a multifaceted approach. By understanding the strengths of each approach, businesses can achieve both transparency for external stakeholders and informed decision-making for internal success.

What is Financial Accounting?

Focused on transparency, it meticulously records a company’s financial activities. Adhering to standardised principles (GAAP or IFRS), it generates reports like income statements, balance sheets, and cash flow statements. These reports, aimed at external users like investors and creditors, showcase a company’s profitability, financial position, and cash flow.

What is Management Accounting?

Internally focused, it empowers decision-making. More flexible than financial accounting, it utilises historical data alongside non-financial metrics and future projections. Cost accounting, budgeting, performance management, and product costing are all areas where managerial accounting shines. This information is critical for internal stakeholders like management and department heads as they navigate resource allocation, product development, and overall operational efficiency.

Financial accounting provides a clear, historical outline, while managerial accounting adds depth and future-oriented details. This duality is what unlocks a truly comprehensive understanding of a company’s financial health.

Here is a table summarising the key differences:

Feature Financial Accounting Managerial Accounting
Focus External users (investors, creditors) Internal stakeholders (management, department heads)
Purpose Transparency & accountability Decision-making & planning
Data Historical & standardised Historical, future projections, non-financial metrics
Flexibility Less flexible (adheres to GAAP/IFRS) More flexible
Reporting Standardised reports (income statement, balance sheet, cash flow statement) Internal reports & analysis

In the next sections of this article, we will discuss the concept of duality, where these two systems work together to paint a complete financial picture. Furthermore, we will delve into the specific areas where each accounting system shines.

Financial Accounting in Detail

Financial accounting acts as the cornerstone of financial transparency, providing a standardised and clear picture of a company’s financial health for external users. Investors, creditors, and other external stakeholders rely on this information to make informed decisions.

Here’s where Generally Accepted Accounting Principles (GAAP) or International Financial Reporting Standards (IFRS) come into play. These are established frameworks that dictate how financial transactions are recorded and reported. Adhering to these principles ensures consistency and comparability between companies. It is like comparing apples with other apples and it is easier to spot inconsistencies as well. GAAP/IFRS allows investors to analyse the financial performance of different companies using the same “language” of accounting.

Financial accounting translates a company’s financial activities into three key statements:

  • Income Statement: Often referred to as the profit and loss statement, this report measures a company’s profitability over a specific period (usually a quarter or a year). It details revenues earned, expenses incurred, and ultimately, the net income (profit) or net loss generated by the company’s operations.
  • Balance Sheet: This statement provides a snapshot of a company’s financial position at a specific point in time. It categorises everything the company owns (assets) and owes (liabilities) along with shareholder equity (the difference between assets and liabilities). Think of it as a financial photograph capturing the company’s net worth at a specific moment.
  • Cash Flow Statement: Unlike the income statement, which focuses on profitability, the cash flow statement highlights how a company generates and uses cash. It categorises cash inflows (from operations, investments, or financing activities) and cash outflows (for operations, investments, or financing activities). Understanding a company’s cash flow is crucial for external stakeholders as it indicates its ability to meet financial obligations and invest in future growth.

By providing these standardised financial statements, financial accounting plays a vital role in building trust and attracting external stakeholders. Investors can use this information to assess a company’s risk profile and potential for future returns. Creditors can evaluate the company’s ability to repay loans. Overall, financial accounting lays the foundation for transparency and accountability, facilitating healthy interactions between businesses and the external world.

Managerial Accounting in Detail

While financial accounting shines a light on the past for external audiences, managerial accounting turns the spotlight inwards, empowering internal stakeholders like management and department heads to make informed decisions. Unlike its financial counterpart, managerial accounting is less rigid and embraces flexibility. It incorporates not only historical financial data from financial accounting but also non-financial metrics and future-oriented projections. This allows for a more nuanced and adaptable view of the company’s financial landscape.

Managerial accounting serves as a versatile toolbox, equipping internal stakeholders with valuable insights across several key areas:

  • Cost Accounting: This crucial discipline delves into the identification, analysis, and control of various business costs. It dissects production costs, marketing expenses, and other operational expenditures. By understanding these cost drivers, managers can identify areas for cost reduction and optimise resource allocation, ultimately improving profitability.
  • Budgeting and Forecasting: Managerial accounting does not just focus on what has happened, it helps predict what might happen. Through budgeting and forecasting techniques, managers can create financial projections for future periods. These projections guide strategic planning, allocate resources and anticipate potential challenges. It is kind of like navigating a foggy road as budgeting and forecasting provide a sense of direction for the company’s future journey.
  • Performance Management: Effective decision-making hinges on understanding how well a company is performing. Managerial accounting steps in with performance management techniques. By tracking key performance indicators (KPIs) aligned with strategic goals, managers can identify areas exceeding expectations or falling short. This data-driven approach allows for course correction, ensuring the company stays on track to achieve its objectives.
  • Product Costing and Pricing: Determining the optimal price for a product or service is a critical business decision. Managerial accounting plays a key role here by helping calculate product costs associated with production, materials, and labour. With a clear understanding of these costs, businesses can set competitive pricing strategies that ensure profitability.

Managerial accounting empowers internal stakeholders to make informed choices regarding resource allocation, product development, pricing strategies, and overall operational efficiency. It equips them with the knowledge to navigate the ever-changing business landscape and make strategic decisions that drive growth and success.

The Power of Duality: Combining Financial and Managerial Accounting

Now that we know what is financial accounting and what is management accounting in detail. Let us now understand how to combine these two accounting systems effectively. Financial and managerial accounting, often viewed as separate entities, are in fact two sides of the same coin. When used together, they create a powerful synergy, offering a comprehensive and dynamic understanding of a company’s financial health.

We can think of financial accounting data as the foundation such as the historical data gleaned from income statements, balance sheets, and cash flow statements. This data serves as a crucial starting point for managerial accounting analysis.

For example, declining profits revealed by an income statement (financial accounting) might trigger a cost analysis using managerial accounting techniques. By identifying areas of cost inefficiency, managers can implement cost-saving measures. These measures, in turn, can lead to improved profitability reflected in future financial statements (financial accounting). This cyclical relationship highlights the interdependence of the two systems.

Here’s a glimpse into how businesses leverage the power of the duality of financial and managerial accounting in real-world scenarios:

  1. Sales Data Informs Production Planning: Analysing historical sales data (financial accounting) can reveal top-selling products. Armed with this information, managers (managerial accounting) can optimise production planning, ensuring sufficient inventory to meet customer demand while avoiding excess stock that ties up capital.
  2. Profitability Drives Cost Control: Financial statements (financial accounting) might reveal a concerning trend of declining profits. This prompts managers to utilise managerial accounting tools like cost analysis. By pinpointing areas of high expenditure, they can implement cost-reduction strategies. This, in turn, improves the company’s bottom line reflected in future financial statements.
  3. Cash Flow Analysis Guides Investment Decisions: The cash flow statement (financial accounting) provides insights into a company’s cash inflows and outflows. Managerial accounting can then build upon this data by analysing potential investment opportunities and their impact on future cash flow. This integrated approach empowers management to make informed investment decisions that ensure the company’s long-term financial health.

The power of duality extends beyond data analysis. Clear communication between departments using financial and managerial accounting data is paramount. For instance, the finance department (financial accounting) might share profitability projections with the marketing department (managerial accounting) to inform their marketing budget allocation. This collaborative approach ensures that all departments are working towards achieving the same financial goals.

By embracing the power of duality, businesses gain a holistic view of their financial landscape. They can not only understand past performance but also make informed decisions that drive future success. Financial accounting provides the historical context, while managerial accounting injects future-oriented insights. Financial and managerial accounting together offer a powerful and dynamic perspective, fueling informed decision-making at all levels of the organisation.

Going Beyond the Basics: Advanced Techniques

While financial and managerial accounting offers a robust foundation together, the journey does not end there. Businesses can delve deeper by incorporating advanced techniques like Activity-Based Costing (ABC) or Value Chain Analysis. ABC goes beyond traditional costing methods, pinpointing costs to specific activities rather than just departments. This granular level of detail empowers managers to make more informed decisions about resource allocation and pricing strategies. Value Chain Analysis dissects a company’s operations, identifying areas that add value for the customer.

By understanding these value drivers, businesses can optimise their processes and gain a competitive edge. These are just a few examples, and the world of advanced accounting techniques continues to evolve, offering even greater opportunities for insightful decision-making. You can enrol in the Postgraduate Financial Accounting and Management Course by Imarticus Learning to master advanced concepts in accounting.

Wrapping Up

Financial and managerial accounting, though seemingly distinct, are two sides of the same financial coin. By embracing their duality, businesses gain a comprehensive view of their financial health. Financial accounting provides the historical foundation, while managerial accounting injects future-oriented insights. Together, they offer a powerful and dynamic perspective.

This combined approach empowers informed decision-making at all levels, from resource allocation and cost control to product development and pricing strategies. With a clear understanding of both past performance and future potential, businesses can navigate the complexities of the marketplace with confidence. In essence, financial and managerial accounting, working in unison, act as a strategic compass, guiding companies towards sustainable growth and long-term success.

Enrol in the Postgraduate Financial Accounting and Management Program by Imarticus Learning to become an expert in the two systems of accounting. This financial accounting and management course covers everything you know about business accounting and financial management.

Frequently Asked Questions

  • What is the difference between financial and managerial accounting?

Financial accounting focuses on historical financial data and standardised reporting for external users like investors and creditors (think transparency and accountability). Managerial accounting, on the other hand, caters to internal stakeholders (management, department heads) with a more flexible approach. It utilises historical data alongside non-financial metrics and future projections to empower informed decision-making.

  • Why is financial accounting so strict with GAAP or IFRS?

Imagine comparing apples to oranges. GAAP (Generally Accepted Accounting Principles) and IFRS (International Financial Reporting Standards) are like universal measuring tools. By adhering to these frameworks, financial statements from different companies become comparable. This consistency allows investors to analyse the financial health of various businesses using the same “language” of accounting.

  • How does managerial accounting help with cost control?

Managerial accounting delves into the world of cost analysis. It identifies, analyses, and controls various business costs (production, marketing, etc.). By pinpointing areas of high expenditure, managers can implement cost-saving measures. This can involve streamlining operations, negotiating better deals with suppliers, or optimising resource allocation.

  • Is there anything beyond basic financial and managerial accounting?

The world of accounting is constantly evolving. Businesses can leverage advanced techniques like Activity-Based Costing (ABC) or Value Chain Analysis. ABC goes beyond traditional costing methods, assigning costs to specific activities rather than just departments. Value Chain Analysis helps identify areas within a company’s operations that add value for the customer. These advanced techniques provide even greater insights for informed decision-making.

Financial vs. Management Accounting: Discover the 5 Key Differences That Could Save Your Business Thousands!

Numbers can be powerful tools for business success, but sometimes accounting terminology can feel like a foreign language. When it comes to financial and management accounting, the confusion is real. Both deal with numbers, but they serve distinct purposes and cater to different audiences. Let us break down the jargon and unveil the core purposes of each accounting discipline.

By understanding the distinct purposes and audiences of both financial and management accounting, you can unlock their true potential. In this article, we will delve deeper into the unique strengths of each discipline and explore how they work together to empower your business for success. After finding out the difference between financial accounting and management accounting, we will discuss the scope of financial accounting and management accounting.

The Purpose of Financial Accounting

What is financial accounting? Financial accounting is the framework for providing a clear and standardised picture of the company’s financial performance for an external audience. Financial accounting, with its standardised reporting and focus on transparency, lays the foundation for informed decision-making by external stakeholders.

Core Purpose: To create financial statements (income statement, balance sheet, cash flow statement) that adhere to Generally Accepted Accounting Principles (GAAP) or International Financial Reporting Standards (IFRS). These statements offer a standardised snapshot of a company’s financial health, profitability, and cash flow.

Target Audience: Primarily external stakeholders like regulatory agencies, creditors and investors. These groups rely on financial statements to make informed decisions. Investors assess a company’s investment potential, creditors evaluate creditworthiness, and regulators ensure companies comply with financial reporting rules.

The Purpose of Management Accounting

What is management accounting? Management accounting is the framework that constantly monitors the operations of a company, ensuring everything runs smoothly. Management accounting is an ongoing process, creating a continuous feedback loop. The information generated helps internal decision-makers make data-driven choices, optimise operations, and ultimately steer the company towards achieving its strategic objectives.

Core Purpose: To generate reports and analyses that are specific to a company’s needs. These reports go beyond historical data and provide insights for future planning, budgeting, and optimising operations.

Target Audience: Internal stakeholders like managers, department heads, and executives. These individuals use management accounting reports to make strategic decisions, allocate resources efficiently, measure performance against goals, and identify areas for improvement.

Difference Between Financial Accounting and Management Accounting (5 Key Points)

Let us discuss the main points of difference between financial accounting and management accounting before delving into what these two systems are.

Focus

Financial Accounting: External stakeholders (creditors, investors) and historical data for transparency and compliance.

Management Accounting: Internal stakeholders (managers) and future-oriented information for decision-making.

Purpose

Financial Accounting: Creates standardised financial statements (income statement, balance sheet, cash flow statement) following GAAP or IFRS.

Management Accounting: Generates reports and analyses specific to a company’s needs for strategic planning, budgeting, and optimising operations.

Data Source

Financial Accounting: Primarily relies on historical financial data.

Management Accounting: Utilises data from financial statements along with additional internal data (e.g., sales trends, customer behaviour).

Reporting

Financial Accounting: Reports are standardised and publicly available.

Management Accounting: Reports are customised, confidential, and tailored to internal decision-making needs.

Techniques (Example)

Financial Accounting: Ratio analysis of financial statements.

Management Accounting: Cost-volume-profit (CVP) analysis, activity-based costing (ABC).

Real-World Example: The Case of the Expanding Bakery

Let’s see how these two accounting disciplines work in practice:

  1. Financial Accounting: Shreya owns a successful bakery. To secure a loan for expansion, she needs to present financial statements prepared according to GAAP. These statements show her bakery’s revenue, expenses, profits, and overall financial health. Investors and the bank will analyse these statements to assess the risk of lending her money.
  2. Management Accounting: Once the loan is secured, Shreya utilises management accounting. She might generate cost-volume-profit (CVP) analysis reports to understand how changes in production volume or pricing will affect her bakery’s profits. This information helps her make informed decisions about pricing strategies, production levels, and staffing needs for the new location.

Financial Accounting Concepts and Why They Are Different (and Important)

Now that we know the difference between financial accounting and management accounting, let us learn more about what is financial accounting. Financial accounting acts as the window into a company’s financial health, providing a clear picture for external stakeholders. This transparency is crucial for building trust and ensuring smooth financial operations. Let us learn about the scope of financial accounting

GAAP & IFRS

Think of a world where every company reported its finances differently. Analysing a company’s performance would be like trying to read a story written in a different language each time. To ensure consistency and comparability, financial accounting adheres to established frameworks:

  • GAAP or Generally Accepted Accounting Principles: This is the primary framework used in the United States. It dictates how financial transactions are recorded, classified, summarised, and reported in financial statements.
  • IFRS or International Financial Reporting Standards: This framework is widely adopted globally and promotes consistency in financial reporting across international borders.

By adhering to these standardised principles, financial statements become a universal language, allowing investors, creditors, and other external parties to make informed decisions regardless of a company’s location.

Compliance and the External Audience

Financial accounting is not just about transparency, it also ensures compliance with regulations. Companies are legally obligated to prepare financial statements according to GAAP or IFRS. These statements are then audited by independent professionals to verify their accuracy and adherence to the chosen framework.

External stakeholders such as the ones below rely heavily on financial statements:

  • Investors: They use financial statements to assess a company’s profitability, risk profile, and potential for future growth. This information helps them decide whether to invest in the company’s stock.
  • Creditors: Banks and other lenders analyse financial statements to determine a company’s creditworthiness and the likelihood of repaying a loan. This information is crucial for loan approval decisions and setting interest rates.
  • Regulatory Agencies: Government agencies use financial statements to monitor companies’ financial health and ensure compliance with accounting regulations.

Financial Statement Analysis

Financial statements are treasure troves of information, but deciphering them requires some basic analysis techniques. Here are a few key ratios to get you started:

  • Profitability Ratios: These metrics, like return on equity (ROE) or net profit margin, measure a company’s ability to generate profits from its assets and sales.
  • Liquidity Ratios: Ratios like the current ratio or quick ratio assess a company’s ability to meet its short-term financial obligations.
  • Solvency Ratios: Debt-to-equity ratio or times interest earned ratio provide insights into a company’s ability to meet its long-term debt obligations.

By analysing these ratios and trends over time, external stakeholders can gain valuable insights into a company’s financial performance, stability, and future prospects.

Management Accounting Concepts and Why They Are Different (and Important)

We found out about the scope of financial accounting but now let us discuss the concepts of management accounting. The core difference between financial accounting and management accounting is that financial accounting shines a light on the past, but not as effectively for the future. That is where management accounting steps in. It acts as a powerful tool for internal decision-makers, providing forward-looking information and insights to navigate the ever-changing business landscape. That is the main difference between financial accounting and management accounting. Let us learn about the scope of management accounting.

Future-Oriented Reporting

Let us imagine that you are the captain of a ship. Financial statements might tell you how much fuel you have left (past performance), but management accounting reports are like your compass and weather forecast, helping you chart the best course for the future. Here’s how:

  • Strategic Planning and Budgeting: Management accounting reports provide data and projections to support strategic planning. This might involve analysing market trends, forecasting future sales, and creating budgets that align with long-term goals.
  • Scenario Planning and Risk Management: These reports can be used to model different business scenarios (e.g., launching a new product line) and assess potential risks and rewards. This helps companies make informed decisions and develop strategies to mitigate potential risks.

Cost Management and Optimisation

Management accounting delves deep into the world of costs. It utilises various techniques to analyse costs and identify areas for improvement:

  • Cost-Volume-Profit (CVP) Analysis: This technique helps understand the relationship between production volume, sales price, variable costs, and overall profit. By analysing CVP, companies can make informed decisions about pricing strategies, production levels, and cost-control measures.
  • Activity-Based Costing (ABC): Unlike traditional costing methods that allocate overhead costs uniformly, ABC assigns costs to specific activities within a company. This provides a more accurate picture of how activities contribute to overall costs, allowing for better resource allocation and process optimisation.

Performance Measurement

Management accounting reports are not just about future planning, they also play a vital role in measuring performance against established goals.

  • Performance Metrics and Dashboards: Companies define key performance indicators (KPIs) aligned with their strategic goals. Management accounting reports track these KPIs, providing a clear picture of progress and highlighting areas that might need adjustments.
  • Identifying Improvement Opportunities: By analysing variances between actual performance and budgeted goals, companies can identify areas for improvement. This could involve streamlining operations, reducing costs, or implementing new marketing strategies.

How Financial & Management Accounting Work Together

Financial and management accounting, though distinct disciplines, are like two sides of the same coin. Despite the difference between financial accounting and management accounting, they work together in a powerful synergy to provide a comprehensive view of a company’s financial health and propel it towards success.

Building on a Solid Foundation

Imagine building a house. Financial accounting data acts as the foundation – the historical financial statements showcasing a company’s past performance and current financial position. Management accounting then builds upon this base, utilising the data to create forward-looking reports and analyses.

Here’s how the data bridge connects the two disciplines:

  • Financial Statements as Source Material: Management accounting reports heavily rely on data extracted from financial statements, such as revenue, expenses, and asset values. This data serves as the starting point for further analysis and projections.
  • Standardised Data for Consistent Reporting: Financial accounting’s adherence to GAAP or IFRS ensures consistency in the data used for management accounting reports. This consistency allows for reliable comparisons and trend analysis.

Data-Driven Decisions

By combining financial and management accounting data, companies gain a holistic perspective that empowers informed decision-making across all business functions:

  • Marketing & Sales: Sales data from financial statements can be combined with customer behaviour insights from management accounting reports to develop targeted marketing campaigns and optimise pricing strategies.
  • Operations & Production: Management accounting’s cost analysis techniques, combined with financial data on production costs, can help identify areas for operational efficiency and resource optimisation.
  • Human Resources (HR): Financial data on labor costs can be integrated with employee performance metrics from management accounting reports to make informed decisions about staffing, training, and compensation.

Real-World Synergy in Action: Case Studies

Let’s see how some companies leverage the power of both accounting disciplines:

  • Case Study 1 (The Expanding Retail Chain): A retail chain uses financial statements to analyse past sales trends. Combining this data with customer behaviour insights from management accounting reports, they identify a growing demand for a specific product category. This empowers them to optimise inventory management and allocate resources towards expanding that product line, driving future sales growth.
  • Case Study 2 (The Innovative Tech Startup): A tech startup uses financial statements to track research and development (R&D) costs. Management accounting reports then analyse the return on investment (ROI) for these R&D projects. This combined data helps the startup make informed decisions about resource allocation for future innovation and product development.

By fostering collaboration between financial and management accounting teams, companies can leverage the power of data to make strategic decisions, optimise operations, and achieve sustainable financial success.

Beyond the Basics

Financial and management accounting are powerful tools, but the journey does not end here. This section dives into advanced applications and emerging trends that will set you apart and help you in your career. If you wish to become an expert in financial or management accounting, you can enrol in the Financial Accounting and Management Program Imarticus. This financial accounting and management course will teach you everything you need to know about these two accounting systems. Let us now learn about emerging trends and advanced applications.

Financial Forecasting and Modeling

Imagine navigating a vast ocean. Financial statements provide historical data, like your ship’s current location. But to reach your destination, you need a map and compass. Financial forecasting and modelling come into play:

  • Leveraging Historical Data: Financial accounting data on past performance serves as the foundation for financial forecasts. By analysing trends and market conditions, companies can create projections for future revenue, expenses, and cash flow.
  • Building Financial Models: These models are digital simulations that allow companies to test different scenarios (e.g., launching a new product line, entering a new market) and assess their potential financial impact. Financial accounting data provides the inputs for these models.

By combining historical data with future projections, companies can make informed strategic decisions and chart a clear course for achieving their financial goals.

Management Accounting Tailored for Success: Industry-Specific Applications

Management accounting is not a one-size-fits-all approach. Different industries have unique needs and utilise management accounting practices accordingly:

  • Retail: Retailers leverage management accounting techniques like inventory turnover analysis to optimise stock levels and minimise the risk of stockouts or excess inventory. They might also use customer behaviour data to develop targeted promotions and loyalty programs.
  • Manufacturing: Manufacturing companies heavily rely on cost-volume-profit analysis to understand how production volume impacts costs and profits. Activity-based costing helps them identify areas for operational efficiency and cost reduction within the manufacturing process.

Understanding these industry-specific applications empowers businesses to leverage management accounting for maximum impact.

The Future of Accounting: Embracing Transformation

The world of accounting is constantly evolving, and emerging trends are poised to reshape both financial and management accounting practices:

  • Data Analytics: The increasing volume of financial and operational data allows for advanced data analytics. This can be used to identify hidden patterns, predict future trends, and generate more accurate financial forecasts and management accounting reports.
  • Automation: Repetitive tasks like data entry and reconciliation are becoming automated, freeing up accounting professionals to focus on higher-level analysis and strategic decision-making. This will enhance the efficiency and effectiveness of both financial and management accounting functions.

By embracing these trends and continuously developing their skill sets, accounting professionals can stay ahead of the curve and ensure their organisations are well-positioned for future success.

Wrapping Up

Financial and management accounting, when used together effectively, offer a powerful toolkit for informed decision-making, strategic planning, and achieving long-term financial goals. 

By learning financial and management accounting in more detail, you can unlock their full potential. Remember, the world of accounting is an ongoing exploration. Stay curious, embrace new technologies, and keep learning to become a master of this dynamic and ever-evolving field.

If you wish to become an expert professional accountant, you can enrol in the Financial Accounting and Management course by Imarticus Learning. This financial accounting and management course will help you reach greater heights in your finance and financial management career.

Frequently Asked Questions

Who uses the reports generated by each type of accounting?

Financial Accounting: Primarily used for external stakeholders like investors, creditors, and regulatory agencies. These reports provide a standardised overview of a company’s financial health.

Management Accounting: Primarily used for internal stakeholders like managers, department heads, and executives. These reports offer detailed, customised information to support decision-making within the company.

What kind of information do they focus on?

Financial Accounting focuses on historical financial data, adhering to strict reporting standards (GAAP or IFRS) to ensure consistency and comparability between companies. Reports include income statements, balance sheets, and cash flow statements. Management Accounting focuses on both historical and future-oriented data. It’s more flexible and allows for customisation to address specific needs within the company. Reports can include cost analyses, budgeting forecasts, and variance analyses.

How can these differences save my business money?

Management Accounting: By providing in-depth cost analyses and identifying areas of inefficiency, management accounting empowers businesses to optimise resource allocation, reduce waste, and ultimately save money.

Financial Accounting: While not directly saving money, accurate financial reporting builds trust with investors and creditors, potentially leading to lower borrowing costs and better investment opportunities.

Do I need both types of accounting in my business?

Most businesses benefit from both. Financial accounting ensures compliance with regulations and attracts external financing, while management accounting provides the critical internal insights needed for informed decision-making and cost optimisation.

The Process of Business Analytics in Detail

Business analytics lets us transform raw data into actionable insights, driving informed decision-making across all levels of an organisation. While often confused with Business Intelligence (BI) and data analytics, business analytics takes things a step further.

BI focuses on historical data visualisation and reporting, while data analytics encompasses a broader range of techniques for analysing data. The process of business analytics, however, leverages these insights to answer specific business questions and solve real-world problems. Let us learn about the process of business analytics in detail.

The Growing Importance of Business Analytics in Today’s World

In today’s data-rich world, every business decision can be enhanced by business analytics. From optimising marketing campaigns to streamlining operations and managing risks, business analytics empowers businesses to gain a competitive edge and thrive in a dynamic marketplace.

For instance, think of a retail company struggling with declining sales. Traditional methods might involve hunches and guesswork. The process of business analytics, however, empowers them to analyse customer purchase history, identify buying trends, and optimise product offerings. They might discover a hidden demand for a specific product category they were not previously catering to. By leveraging the process of business analytics, they can make data-driven decisions to adjust inventory, personalise marketing campaigns, and ultimately boost sales.

The Process of Business Analytics in Detail

The business analytics life cycle is a structured approach that ensures businesses extract maximum value from their data. Here is a breakdown of the key stages:

Stage 1: Defining Business Needs and Goals

This first stage of the business analytics life cycle sets the foundation for your business analytics journey. Here, you identify the specific challenges or opportunities you are trying to address. Are you looking to improve customer retention, optimise marketing campaigns, or streamline internal processes? Clearly defined goals ensure your business analytics initiatives are aligned with your overall business strategy.

Stage 2: Data Collection and Exploration

Data is the fuel for business analytics. This stage involves identifying relevant data sources, both internal (sales figures, customer data) and external (industry reports, market trends). Techniques like data mining and web scraping can be used to gather the necessary information. However, data quality is paramount. Techniques for cleaning and preparing data, such as handling missing values and removing duplicates, ensure the accuracy of your analysis.

Stage 3: Data Analysis and Modeling

Now it is time to unlock the secrets hidden within your data. This stage of the business analytics life cycle involves applying various data analysis techniques. Descriptive analytics helps you understand what happened (e.g., average customer lifetime value). Predictive analytics goes a step further, using statistical models to forecast future trends (e.g., predicting customer churn). Prescriptive analytics takes it to the next level, suggesting optimal actions on the data (e.g., recommending targeted marketing campaigns to retain at-risk customers).

Common statistical methods like correlation analysis and regression modelling are used as core data analytics steps in business analytics.

Stage 4: Data Visualisation and Communication

Data can be overwhelming. This stage focuses on transforming complex data insights into clear and concise visualisations. Charts, graphs, and interactive dashboards tailored for your audience (technical or non-technical) are key tools for effective communication. Remember, a well-designed visualisation can speak a thousand words, enabling stakeholders to easily grasp the story your data tells.

Stage 5: Decision-Making and Outcome Measurement

The ultimate goal of business analytics is to translate insights into actionable decisions. This stage of the business analytics life cycle involves leveraging the knowledge gained from data analysis to make informed choices that drive business growth. It is also crucial to establish metrics to track the effectiveness of your business analytics initiatives. Did your data-driven decision to personalise marketing campaigns lead to an increase in conversions? Measuring outcomes allows you to continuously refine your business analytics approach and maximise its impact.

If you wish to become an expert in the process of business analytics, you can enrol in the postgraduate business analytics course by Imarticus Learning and XLRI to become an expert in this field.

Advanced business analytics Techniques in the Process of Business Analytics

The core business analytics techniques are a powerful foundation, but the real magic happens when you delve deeper. Here are some cutting-edge approaches that unlock even greater potential from your data:

Graph Analytics

Think of a complex web of connections, like social media interactions or financial transactions. Graph analytics allows you to analyse these relationships within intricate data networks. It is perfect for tasks like identifying influential users in social media campaigns, detecting fraudulent activity in financial systems, or understanding how different departments within a company collaborate.

Natural Language Processing (NLP)

The world is awash with unstructured text data such as customer reviews, social media posts and emails. NLP empowers you to extract valuable insights from this goldmine of information. By using advanced algorithms, NLP can analyse sentiment (positive, negative, neutral opinions), identify key topics, and even generate summaries of large text datasets. Imagine gaining a deeper understanding of customer satisfaction through social media analysis or uncovering emerging market trends from online news articles.

Big Data and AI

The ever-growing volume, variety, and velocity of data, known as big data, requires advanced tools for analysis. Here is where big data analytics and Artificial Intelligence (AI) come into play. Big data analytics helps store, process, and manage massive datasets, while AI techniques like machine learning leverage these datasets to identify patterns and make predictions. This powerful combination fuels applications like personalised product recommendations on past purchase history or dynamic pricing strategies that adjust to real-time market conditions.

These are just a few examples. Emerging techniques like sentiment analysis, which gauges the emotional tone of text data, and time series forecasting, which helps predict future trends on historical patterns, further expand the business analytics toolkit. By embracing these advanced approaches, businesses unlock deeper insights, solve complex problems, and gain a significant competitive edge.

Choosing the Right Business Analytics Tool for the Job

With a vast array of business analytics techniques available, selecting the right tool is crucial for maximising your data’s potential. Here are some key factors to consider:

  1. Business Problem: Are you trying to understand historical sales data (descriptive analytics) or predict future customer churn (predictive analytics)? The problem you are trying to solve will guide your choice of technique.
  2. Data Type: Not all data is created equal. Structured data (like sales figures) requires different tools compared to unstructured text data (like customer reviews) which might benefit from NLP. Additionally, real-time data streams necessitate tools designed for continuous analysis.
  3. Available Resources: Consider your computational power, technical expertise within your team, and budget constraints. Some advanced techniques require specialised software and significant processing power, while others might be accessible through user-friendly cloud-business platforms.

Here is a simplified framework to get you started:

  • Define Your Business Problem and Data Type.
  • Identify Techniques Aligned with Your Needs (descriptive, predictive, etc.)
  • Evaluate Available Resources (skills, budget, software).
  • Choose the Tool that Best Fits Your Requirements.

Remember, there is no one-size-fits-all solution. By understanding these factors and utilising this framework, you can select the business analytics tool that unlocks the most valuable insights from your data.

Wrapping Up

Remember, the key to unlocking the true potential of business analytics lies in selecting the right technique for the job, considering your business problem, data type, and available resources. By leveraging this diverse toolkit, you can transform raw data into actionable intelligence that fuels informed decision-making across all levels of your organisation.

Do not be afraid to experiment. Explore different business analytics techniques, embrace emerging trends, and empower your teams to harness the power of data. The potential for innovation and growth through business analytics is limitless. So, start your data-driven journey today and unlock the hidden potential within your organisation’s most valuable asset, its data.

Enrol in the Postgraduate Certificate in Business Analytics offered by Imarticus in collaboration with XLRI to become an expert in the process of business analytics. This business analytics course will teach you everything you need to know to utilise data for high-level business problems and strategic decision-making.

Frequently Asked Questions

  1. What is the difference between business analytics, BI, and data analytics?

They are all data-focused disciplines, but with nuances:

  • Business Analytics: Uses data to answer specific business questions and solve real-world problems. It goes beyond reporting (BI) and incorporates analysis and modelling to make data-driven decisions.
  • Business Intelligence (BI): Focuses on historical data visualisation and reporting, providing insights into past performance.
  • Data analytics: A broader umbrella term encompassing various techniques to analyse data, including those used in business analytics.
  1. Why is data quality so important in business analytics?

Imagine building a house on a shaky foundation. Inaccurate or incomplete data can lead to misleading results and poor decision-making. Business analytics relies on clean, high-quality data to ensure the insights it generates are reliable and actionable.

  1. What are some cool, advanced business analytics techniques?

The world of business analytics is constantly evolving. Here are a few exciting examples:

  • Graph Analytics: Untangles complex data networks, useful for tasks such as fraud detection or understanding customer relationships.
  • Natural Language Processing (NLP): Extracts insights from text data like customer reviews or social media posts, helping you understand customer sentiment and trends.
  • Big Data and AI: Analyse massive datasets and leverage machine learning to make predictions and personalise experiences (e.g., product recommendations).
  1. How can I get started with business analytics in my business?

Start by defining your business goals and identifying the challenges you want to address. Then, explore beginner-friendly business analytics techniques and tools. There are many online resources and courses available to equip you with the foundational knowledge. Do not be afraid to experiment and learn from the data you have.

The Essentials of Financial Analysis for a Solid Career in Finance

Financial analysts help their organisations or clients make informed investment decisions and also perform in-depth research. These jobs are common in big businesses such as insurance organisations and investment banks and require strong mathematical and analytical skills. Aspirants can opt for additional financial certification courses like CPA to land financial analysis roles and command a high CPA salary in India.

With that said, let us take a further look into the essentials of financial analysis.

What is financial analysis?

Financial analysis is the process of evaluating companies, projects, budgets, and other finance-related transactions to determine their viability and suitability.

It is used to determine whether a business is financially sound, stable, able to pay off debt, and profitable enough to warrant investment.

How to Pursue a Career as a Financial Analyst

You can become a financial analyst through education and early professional experiences; for example, you can invest in a financial analysis course to pursue finance career options.

The majority of entry-level jobs in the finance sector require a bachelor’s degree in business administration, finance, accounting or a related discipline such as general business, economics, or statistics.

Senior financial analysts often focus on direct engagement with high-level clients, managing firms, and creating marketing strategies to acquire new customers.A Certified Public Accountant is one of the many jobs that come under the financial analyst umbrella. The job is lucrative as the average CPA salary in India for freshers is around INR 6.8 LPA.

Necessary Skills and Education 

Some of the skills that you need to thrive in jobs in the finance sector include various technical and soft skills, such as:

Technical skills

Financial statement analysis 

As a financial analyst, it’s important to have extensive knowledge of income statements, balance sheets, and cash flow statements. Knowledge of these aspects can help you analyse a company’s liquidity, solvency, and profitability.

Financial modelling: 

If you want to delve into finance career options then it is important that you know how to build and interpret various financial models, as they can help you forecast a company’s future performance based on a variety of situations.

Soft skills

Attention to detail 

Jobs in the finance sector require a keen eye, as serious compilation errors might result from overlooking a minor detail. This can lead to significant miscalculations. Therefore, it is important to be careful.

Communication 

All the best careers in finance require solid communication skills, as good communication helps you easily communicate data with stakeholders.

Importance of Financial Analysis

Financial analysis is important for various reasons, with some of them being:

  • Assessing a business’s profitability and earnings prospects: Financial analysis helps verify whether a company’s earnings meet or exceed the set expectations. It also helps determine profit trends and assess the company’s earning potential.
  • Evaluate the financial robustness of the business: Financial analysis helps evaluate a company’s financial health and its impact on the market.
  • Beneficial for the management: With financial analysis, you can gain thorough insight into a company’s management and help it make vital business decisions.

Categories of Financial Analysis

Some of the common types of financial analysis are:

1. External analysis

This type of analysis is performed by investors, stakeholders, and researchers who depend on information published in reports like the Statement of Profit and Loss and Balance Sheet, as they lack access to internal and confidential business data.

2. Internal analysis

In comparison to external analysis, you can use this kind of analysis to carry out internal management and conduct a thorough analysis to access precise and in-depth information since you have full access to confidential business data.

3. Horizontal analysis

You can use horizontal analysis from multiple years to determine how profitable your company is and how fast it is expanding. This process is also known as time series analysis or dynamic analysis.

4. Vertical analysis

Vertical analysis, also known as cross-sectional analysis or static analysis, is the study of a single year’s worth of financial statements. It includes examining the connections between balance sheets, statements of profit and loss, and other things within a single financial year.

5. Ratio analysis

You can use ratio analysis to examine the correlations between several financial parameters to learn more about a business’s efficiency, financial health, and performance. It mainly helps assess a business’s liquidity, profitability, operational efficiency, and solvency.

Conclusion

A career as a financial analyst is lucrative since financial analysis is growing rapidly, and so is the hiring demand for financial analysts.

Meanwhile, thanks to an increase in access to education opportunities, you can easily find various online and offline courses to polish your skills or learn more about financial analysis.

So, if you want to start a career in financial services or corporate finance, why not enrol in Imarticus Learning’s Postgraduate Financial Analysis Programme! Visit Imarticus Learning and join our financial analysis course today to kickstart your financial analyst career and find the best path to your preferred jobs in the finance sector.

FAQs

  1. What are the three types of financial analysis?

The three most vital financial analyses are horizontal, vertical, and ratio analysis.

  1. What are the roles of a financial analyst?

As a financial analyst, you can work in some of the best careers in finance, including roles in insurance companies, pension funds, banks, and various other businesses. Financial analysts mainly assess stock performances, investments, and various types of bonds.

  1. What are the three main financial statements called?

The three main financial statements are called income statement, balance sheet, and statement of cash flow. These aforementioned functions are informative tools that traders use to assess a company’s financial well-being and offers a concise overview of the company’s worth.

  1. What is financial analysis also known as?

Financial analysis is also known as accounting analysis, financial statement analysis, or analysis of finance. All of these refer to the assessment of stability, viability, and profitability of a project, business, or sub-business.

A Complete Guide to Horizontal Analysis

Horizontal analysis is a significant aspect of the world of finance. It is a systematic approach to analysing financial statements by drawing conclusions by comparing financial information for an accounting period while comparing the specific information with other accounting periods. it is usually analysed as the growth in the percentage of a specific item in a year while comparing it with the base year.

Horizontal analysis is important for companies as it helps to easily spot trends and analyse the growth patterns of specific items. Learning horizontal analysis is a must. Acquiring the knowledge of horizontal analysis is a must for individuals who want to build a career in finance.

Read on to understand “what is meant by horizontal analysis?” And how it impacts the finances of an organisation.

What is Meant by Horizontal Analysis?

Horizontal analysis is a key aspect of financial statement analysis which allows users to compare a specific line of item of an accounting period with that of other accounting periods. It is basically done to draw conclusions about the growth or fall of an item.

Horizontal analysis can be used in two ways. One is absolute comparison and another is percentage comparison. Here, the baseline is taken as a hundred percent and a comparison of other accounting periods is drawn accordingly. Hence, this approach is also known as base year analysis.

Horizontal analysis of financial statements is crucial for determining the growth of an organisation when compared to its competitors. It is a way of asserting historical trends which helps organisations to know which part is profitable and which is incurring losses.

Horizontal Analysis in Reporting Standards

As stated in the generally accepted accounting principles (GAAP), financial statements should be projected in such a manner that the information is consistent and comparable in order to evaluate the company’s financial performance. Individuals trying to build a career in finance should be well versed in the GAAP principles and draft the financial statements accordingly.

Here, consistency implies that if a company is following a certain method of accounting in the base year, it must follow the same accounting method in the consecutive years. Therefore, the results remain authentic and constant over the accounting periods.

Secondly, by comparability, the standards dictate an organisation to maintain its financial statements and other relevant documents in such a manner that can be evaluated and compared with other companies in the same industry. 

Hence, horizontal analysis of financial statements allows the companies to improve the consistency and comparability constraint as outlined by the GAAP.

Key Metrics in Horizontal Analysis

A company’s financial performance is reflected by its financial statements which consist of the balance sheet, profit and loss statement and cash flow statement. These financial statements project a clear picture of the organisational performance for that accounting period. At the same time, emerging trends, strengths and weaknesses, critical operational aspects and improvement areas of a company can be ascertained by analysing the various factors such as return on equity, profit margin and inventory turnover ratio.

For instance, an organisation’s management may project that the sudden growth of profit or the decline of the cost of goods sold is the reason for the growth per share. After performing horizontal analysis for interest coverage ratio and cash flow to debt ratio the company may conclude whether there has been sufficient liquidity for the accounting year or not. A horizontal balance sheet can also used to compare the growth rate, profitability, losses and overall business performance of various companies and in the same company for various accounting periods. 

How Horizontal Analysis Works?

Horizontal analysis of financial statements provides a clear picture to the investors and the shareholders of the company of how the organisation has performed for a particular accounting period. It allows investors to ascertain what has been the driving force of the company and what results it has yielded in their favour. They can easily identify the loopholes and see the growth trend by comparing the relative changes.

For building a career in finance, it’s important to perform a proper analysis of the financial statements of a company such as cash flow statement, income statement and balance sheet. These reveal the company’s operating efficiency along with the operational results.

The analysis of critical aspects of a company’s finances, such as its return to equity, inventory turnover, and profit margins depends upon horizontal analysis. Coverage ratios show the liquidity capacity of a company and its ability to meet its current debts. With effective horizontal analysis, the growth and profitability of a company can also be evaluated.

To know more about horizontal analysis and its working structure, one may enrol on an insightful financial analysis course. The Postgraduate Financial Analysis Programme by Imarticus is a great pick where you can gain hands-on knowledge about the said topic. 

How to Perform a Horizontal Analysis?

The procedure of horizontal analysis is short and crisp. However, it involves three major steps that need to be followed with precision. 

The following other steps that one needs to follow to perform horizontal analysis of financial statements:

Step 1: gather financial information

To proceed with the process of horizontal analysis, financial individuals need to gather financial information about a company for various accounting periods. This is generally done by drawing annual financial statements during various accounting years. Thereafter, specific account balances in the balance sheet or cash flow statement are looked upon to uphold a specific line analysis.

Individuals need to ensure that the gap between each financial statement remains consistent. Otherwise, the calculation and conclusion will not be accurate. However, the interval of the accounting period is at the discretion of the organisation, it can be done on a monthly, quarterly or yearly. However, the difference between each iterative accounting period should remain equal and consistent for precise comparison of financial information.

Step 2: determine comparison methods

After successfully gathering the financial information of an entity for various accounting periods, the next step is to decide on the comparison method. There are several primary comparison methods such as direct comparison, variance analysis, horizontal analysis, vertical analysis, and so on.

Here, the chosen approach is horizontal analysis where the comparison is strong by the change in percentage of one accounting period to another. However, all the percentage change is calculated while considering the base year chosen by the organisation. As the company’s operation grows, it becomes difficult to maintain the same growth rate. 

In order to identify changes over a longer period, the percentage method proves to be very useful. This method also provides indications of significant deviations in the current period when compared to the base year.

Step 3: identify trends and patterns

After the entire calculation process is done, and the financial information is verified, it is time to analyse the outcomes. However, the identification of growth, trends and patterns is characterised by taking into account some specifically guided concerns.

For instance, the management may want to know how well the cost of goods sold for a particular region has been. In that case, the financial analyst needs to provide the result for that specific line of item for various accounting periods. It helps to understand the comparison and also identify the growth rate.

Example of Horizontal Analysis

Horizontal analysis of financial statements is a way to measure the changes in dollars or percentages for various accounting periods by drawing a comparison with the base year. When people having a career in finance state that the revenue has gone up by 10% for the quarter, it means that such individuals are talking about the outcome of horizontal analysis. 

The percentage change is calculated by dividing the dollar change between the base year and the year in question by considering the line item. The quotient is then multiplied by 100.

To calculate horizon analysis in percentage the following formula has to be used:

Horizontal analysis (%)= {(amount in comparison year – amount in base year)/ amount in base year} * 100

For example, if an investor wants to invest in ABC company, the investor will want to know how the company has performed over the past years. let’s say that in company ABC, the base year reported the net revenue to be $10 million and retained income of $50 million. 

The current year, that is the question of the same company has reported net revenue of $20 million and retained income of $52 million. As a consequence, the net increase has been $10 million, and the earnings retained for that particular particular year is $2 million.

Therefore, the net worth of the company shot up by 100%. 

That is, 

($20 million -$10 million)/$10 million * 100

Whereas, its retained income only grew by 4%.

That is,

($52 million -$50 million)/ $50 million * 100

  period 1 (base year) period 2 (current year) change % change
Net revenue $10 million $20 million + $10 million 100%
Retained income $50 million $52 million + $2 million 4%

Advantages of Horizontal Analysis

Horizontal analysis offers very few disadvantages in financial reporting and financial analysis. The following are the benefits of horizontal analysis:

  • It provides a clear picture of the company’s financial performance and health.
  • It helps to easily identify growth patterns and trends by comparing financial information of different accounting periods.
  • It states whether the company is in a growth stage or facing a decline.
  • Horizontal analysis helps the management of a company to make informed decisions.
  • It helps to identify the irregularities and anomalies within the company.
  • It helps to elevate benchmarking against competitors and industry-standard standards.
  • It allows an in-depth examination of the financial information of the company, which leads to a better understanding of the company’s financial health.
  • The outcomes of horizontal analysis aid in strategic planning and sustainable business growth.

Criticism of Horizontal Analysis

Horizontal analysis is considered a beneficial approach for companies to ascertain their financial performance, but it is characterised by certain criticism as well. A financial analyst can manipulate the conclusions of horizontal analysis based on the year he chooses as the base year and how many accounting periods he takes into consideration for drawing the comparison.

For instance, the current accounting year’s profit may outshine the ones with which it is compared. On the other hand, it may prove to be relatively poor when compared to the profits of the preceding years which has not been taken into consideration. Hence, it is important for individuals wanting to build a career in finance to know that in such scenarios, leaving a footnote about the financial statement and its consistency is one of the best practices.

Another issue with horizontal analysis of financial statements is that the aggregation of financial information in those statements may have changed over time. It means that the expenses, revenues, assets and liabilities may have changed in different accounting periods. Hence, these changes can cause variations when comparing the account balances of one accounting year to another. 

Precise horizontal analysis thus gets affected due to these variations and meticulous selection of the base year and consecutive accounting years for comparison.

Conclusion

Horizontal analysis is an amazing approach to financial analysis that is used to analyse a company’s financial performance over time. It compares previous and current financial performance for various accounting years, which helps to provide a clear picture of how the company is doing. With horizontal analysis, an organisation can spot growth trends and deviations with much accuracy.

If you are a finance professional or you want to step into the field of finance then becoming a financial analyst is a great career option. There are multiple financial analyst courses that you can take to improve your skill set. The Postgraduate Financial Analysis Program by Imarticus is an insightful course that will help you leverage your abilities in the field of finance.

Frequently Asked Questions

  • How to do horizontal analysis step-by-step?

There are three major steps involved in the process of horizontal analysis. The first step is to gather financial information, followed by determining the comparison methods. Lastly, identified trends and patterns.

  • What is the formula used to complete a horizontal analysis?

For calculating horizontal analysis, the formula is: 

Horizontal analysis (%)= {(amount in comparison year – amount in base year)/ amount in base year} * 100

  • What is another name for horizontal analysis?

Horizontal analysis is also known as trend analysis where individuals compare the change in the financial statements of one accounting year with another.

  • How to calculate the current ratio?

One can calculate the current ratio by dividing a company’s total current assets by its total current liabilities. The current ratio is a resource that can easily be converted into cash and cash equivalents within one year or less than that.

What are the Different Types of Big Data Analytics?

The digital age has ushered in an era of unprecedented data generation. From social media interactions and sensor readings to customer transactions and financial records, businesses are constantly accumulating vast amounts of information. This data, often referred to as “big data” due to its volume, velocity, and variety, holds immense potential for uncovering valuable insights and driving strategic decision-making.

However, harnessing the power of big data requires specialised techniques and a comprehensive understanding of different analytics approaches. Big data analytics empowers businesses to sift through this complex data landscape, transforming raw information into actionable intelligence. By leveraging various analytical tools, companies can gain a deeper understanding of customer behaviour, identify emerging trends, and optimise operations for improved efficiency and profitability.

In this article, I will delve into the different types of big data analytics, exploring their unique applications. This guide will also equip you with the knowledge to choose the right analytical approach for your specific needs, empowering you to unlock the hidden potential within your data and push businesses towards data-driven success.

The Different Types of Big Data Analytics

Let us learn about the different types of big data analytics as well as check out some of their applications and real-world examples. We will also explore some of the key types of data analysis techniques used for working with big data. These analysis techniques are various applications of data science types that are used in carrying out advanced analytics on big data.

Understanding the Past: Descriptive Analytics

Descriptive analytics forms the foundation of big data exploration. Its primary focus is summarising historical data to gain insights into past events and identify trends. Think of it as painting a clear picture of what has already transpired. Descriptive analytics relies on a variety of techniques to achieve this:

  • Measures of Central Tendency: These metrics, like mean (average), median (middle value), and mode (most frequent value), provide a snapshot of the typical values within a dataset. For instance, a retail company might use the average sales figures over the past year to understand their baseline performance.
  • Measures of Dispersion: Variance and standard deviation quantify the spread of data points around the central tendency. This helps identify outliers and assess the consistency of data. For example, analysing the standard deviation of daily website traffic allows an e-commerce platform to understand how much traffic fluctuates throughout the week.
  • Data Visualisation: Charts and graphs bring data to life, making it easier to identify patterns and trends. Descriptive analytics utilises various visualisations like bar charts, pie charts, and line graphs to showcase key insights from the data. A social media company might use bar charts to visualise user engagement metrics like likes and shares across different social media platforms.

Real-World Example: Optimising Inventory Management with Descriptive Analytics

Take a large retail chain struggling with inventory management as an example. Using descriptive analytics, they can analyse historical sales data to identify peak sales seasons and products with higher demand. By calculating average sales figures and analysing seasonal trends, they can predict future demand and optimise inventory levels accordingly. This reduces the risk of stockouts during peak seasons and prevents excess inventory holding costs during slow periods.

Diagnosing the Root Cause: Diagnostic Analytics

While descriptive analytics paints a picture of the past, diagnostic analytics delves deeper, asking “why” things happened the way they did. This approach helps identify the root causes of problems or phenomena observed in the data.

Here are key techniques used in diagnostic analytics:

  • Data Mining: This process uncovers hidden patterns and relationships within large datasets. Advanced algorithms sift through vast amounts of data to identify previously unknown correlations that might explain specific trends or issues. For example, a manufacturing company experiencing a rise in product defects could use data mining to identify correlations between specific machine operators, production times, or raw material batches and the occurrence of defects.
  • Drill-Down Analysis: This technique involves progressively zooming in on specific data points or segments within a larger dataset. This allows for a more granular exploration of potential causes behind observed trends. Let us take a hospital analysing patient readmission rates as an example. Through accurate types of data analysis such as drill-down analysis, they can identify specific diagnoses or patient demographics with higher readmission rates, allowing them to investigate the underlying reasons.
  • Anomaly Detection: This technique focuses on identifying data points that deviate significantly from the expected pattern. These anomalies can signal potential problems or areas requiring further investigation. For instance, a financial institution might use anomaly detection to identify unusual customer transactions that could be indicative of fraudulent activity.

Real-World Example: Predicting Machine Failures with Diagnostic Analytics

A manufacturing company experiencing frequent machine breakdowns can leverage diagnostic analytics to identify root causes and predict potential failures. By analysing sensor data from the machines, such as temperature readings and vibration patterns, data mining algorithms can uncover correlations between specific data points and machine failures. This allows for preventive maintenance scheduling, preventing costly downtime and ensuring smooth production operations.

Predicting the Future: Predictive Analytics

Moving beyond the past and present, predictive analytics takes centre stage. This powerful approach leverages historical data and statistical models to forecast future trends and events. Think of it as using the past to predict what is likely to happen next.

Here are some key techniques used in predictive analytics:

  • Regression Analysis: This technique establishes a mathematical relationship between dependent variables (what we want to predict) and one or multiple independent variables (factors that influence the dependent variables). For instance, a marketing team might use regression analysis to predict future sales based on historical data points like advertising spend and product pricing.
  • Time Series Forecasting: This technique analyses data collected over time to predict future values in a time series. It’s particularly useful for forecasting trends in areas like website traffic, stock prices, or customer demand. Think of an e-commerce platform using time series forecasting to predict upcoming sales peaks based on historical seasonal trends.
  • Machine Learning Algorithms: These algorithms learn from existing data patterns to make predictions on new data. They are particularly powerful for complex data sets and can identify non-linear relationships that might be missed by traditional statistical methods. For example, a travel company might use machine learning algorithms to predict customer travel preferences and personalise travel recommendations based on past booking behaviour and demographic data.

Real-World Example: Assessing Creditworthiness with Predictive Analytics

Financial institutions rely heavily on predictive analytics to assess customer creditworthiness and identify potential loan defaults. By analysing a borrower’s credit history, income data, and other financial information, machine learning algorithms can predict the likelihood of a customer repaying a loan. This allows banks to make informed lending decisions and minimise the risk of bad debt.

Optimising Decisions: Prescriptive Analytics

Predictive analytics tells you what might happen, but prescriptive analytics goes a step further. This approach leverages data and potential future scenarios to suggest optimal courses of action. Think of it as using data-driven insights to determine the best way to move forward.

Here are some key techniques used in prescriptive analytics:

  • Optimisation Algorithms: These algorithms identify the best solution within a defined set of constraints. They can be used to optimise logistics routes, resource allocation, or pricing strategies based on various factors and potential outcomes. For instance, a delivery company might use optimisation algorithms to find the most efficient delivery routes for drivers, considering factors like traffic patterns and delivery locations.
  • Simulation Modeling: This technique involves creating a digital model of a real-world system. By simulating different scenarios and their potential outcomes, businesses can make informed decisions about resource allocation, marketing strategies, or product development. A pharmaceutical company using simulation modelling to test the potential effectiveness of a new drug before investing in large-scale clinical trials would be an example.
  • Decision Trees: These are flowchart-like structures that represent a sequence of decision-making steps. Decision trees can be used to model complex decision-making processes and identify the optimal course of action based on different conditions. For instance, a retail company might use decision trees to personalise product recommendations for customers based on their past purchase history and browsing behaviour.

Real-World Example: Optimising Delivery Routes with Prescriptive Analytics

A transportation company struggling with inefficient delivery routes can leverage prescriptive analytics to optimise operations. By considering factors like traffic patterns, delivery locations, and driver availability, optimisation algorithms can suggest the most efficient routes for each delivery. This reduces delivery times, minimises fuel costs, and improves overall customer satisfaction.

Analysing in Real-Time: Real-Time Analytics

The world of big data is not static, information is constantly being generated. Real-time analytics allows businesses to analyse data streams as they are produced, enabling immediate insights and actions. Think of it as having a live feed of insights that can be used to react to situations in real time.

Here are some key techniques used in real-time analytics:

  • Stream Processing: This technique involves processing data streams as they are generated, allowing for near-instantaneous analysis. This is crucial for applications like fraud detection or stock market analysis, where immediate action might be necessary.
  • Apache Spark: This is a popular open-source framework for processing large datasets in real time. It allows businesses to analyse data streams efficiently and extract valuable insights quickly.
  • Real-Time Dashboards: These dashboards provide a visual representation of key metrics and data trends as they occur. They enable real-time monitoring of critical business processes and facilitate data-driven decision-making at the moment. For example, a social media platform that uses real-time dashboards to monitor brand sentiment and identify potential PR crises as they unfold.

Real-World Example: Monitoring Brand Sentiment with Real-Time Analytics

A social media platform can leverage real-time analytics to monitor brand sentiment and identify potential PR crises. By analysing social media posts and online conversations as they occur, real-time sentiment analysis tools can detect negative brand mentions and assess the overall public perception of the brand. This allows for proactive social media engagement and rapid response to negative feedback, minimising reputational damage.

Exploring Advanced Analytics Techniques

The world of big data analytics is constantly evolving, with new techniques emerging to address increasingly complex data challenges. While the core functionalities explored above provide a solid foundation, venturing into advanced approaches can unlock even greater potential:

  • Graph Analytics: This technique focuses on analysing relationships between data points within a network. It is particularly useful for social network analysis, fraud detection, and understanding complex system dynamics. Think of a social media platform using graph analytics to identify influential users within their network and optimise marketing campaigns accordingly.
  • Natural Language Processing (NLP): This technique empowers machines to understand and process human language. It is another popular application of mainstream data science types. NLP allows businesses to extract insights from unstructured text data like social media posts, customer reviews, and even financial documents. For instance, a travel company might use NLP to analyse customer reviews and identify emerging travel trends or areas for improvement in their services.
  • Big Data and AI: Big data analytics plays a crucial role in fueling Artificial Intelligence (AI) applications. Machine learning algorithms rely on vast amounts of data for training, and big data analytics helps provide the necessary fuel for AI to learn, evolve, and make increasingly accurate predictions. You can think of a self-driving car using big data analytics to analyse real-time traffic data and optimise its route for maximum efficiency and safety.

You can enrol in a solid data science course to learn everything you need to work with advanced data analytics.

The Future of Big Data Analytics

The big data analytics landscape is constantly in flux, with innovative techniques emerging to address the ever-growing complexity of data. While the core functionalities explored earlier provide a solid foundation, venturing into these new frontiers can unlock even greater potential.

One such advancement is graph analytics. This approach delves into the relationships between data points, treating information as interconnected nodes within a network. For example, in a social media platform, graph analytics can identify influential users and their connections, allowing for targeted marketing campaigns. It also proves valuable in fraud detection, uncovering hidden patterns within financial transactions that might indicate suspicious activity.

Another exciting frontier is natural language processing (NLP). Here, machines gain the ability to understand and process human language. This empowers businesses to extract valuable insights from unstructured text data like social media posts, customer reviews, and even emails. For example, a travel company could leverage NLP to analyse customer reviews and identify emerging travel trends or areas for improvement in their services.

Finally, big data analytics plays a critical role in the ever-evolving world of Artificial Intelligence (AI). Machine learning algorithms require massive datasets for training, and big data analytics steps in to provide the fuel. Think of a self-driving car where big data analytics processes real-time traffic data, allowing the car to optimise its route for efficiency and safety. By staying informed about these advancements and exploring techniques that align with their specific needs, businesses can unlock a treasure trove of knowledge from their data and gain a significant competitive edge.

Choosing the Right Types of Big Data Analytics

The different types of big data analytics allow us to utilise a solution for every challenge. However, the key to unlocking its true power lies in selecting the right tool for the job. By carefully evaluating these factors, you can choose the big data analytics technique that best equips you to tackle your specific business challenges and unlock the hidden potential within your data. Consider these factors when making your choice:

  • Business Problem: Clearly define the issue you are trying to address. Are you looking to understand past trends (descriptive analytics) or predict future outcomes (predictive analytics)?
  • Data Type: The nature of your data (structured, unstructured) will influence the appropriate technique. For instance, real-time analytics is ideal for analysing data streams, while NLP is best suited for extracting insights from text data.
  • Available Resources: Consider the computational power and technical expertise required for different techniques. Some approaches, like machine learning, might require significant resources and specialised skills.

Wrapping Up

From understanding past trends with descriptive analytics to predicting future outcomes and optimising operations with advanced approaches, big data analytics empowers businesses to transform raw data into actionable intelligence. Remember, in today’s data-driven world, information is power. By leveraging big data analytics, businesses across all industries can gain a deeper understanding of their customers, optimise operations, and make data-driven decisions that propel them towards success. 

Also, by staying informed about these emerging trends and exploring advanced techniques that align with their specific needs, businesses can unlock even greater value from their data and gain a significant competitive edge in the ever-evolving big data landscape.

So, embark on your big data analytics journey today by enrolling in Imarticus Learning’s Postgraduate Program in Data Science and Analytics. With the help of this data science course, you will be able to explore the techniques that resonate with your specific needs and unlock the hidden potential within your data to gain a significant competitive edge. If you wish to know more about the core data analytics meaning, enrol today.

Frequently Asked Questions

  1. What is the difference between descriptive and predictive analytics?

Descriptive analytics focuses on summarising past data to understand what happened. It uses techniques like calculating averages and creating charts to identify trends. Predictive analytics, on the other hand, leverages historical data and statistical models to forecast future events. It helps businesses anticipate what might happen and make informed decisions based on those predictions.

  1. How can big data analytics help my business?

Big data analytics can benefit businesses in numerous ways. It can help you:

  • Understand your customers: Analyse customer behaviour patterns and preferences to personalise marketing campaigns and improve product offerings.
  • Optimise operations: Identify inefficiencies and bottlenecks in your processes to streamline operations and reduce costs.
  • Make data-driven decisions: Gain insights from data to support strategic decision-making across all departments.
  • Manage risk: Analyse data to identify potential problems and take proactive measures to mitigate them.
  1. Is big data analytics too complex for my small business?

Not necessarily. While some advanced techniques require significant resources, there are many basic big data analytics tools available that are affordable and user-friendly for businesses of all sizes. You can start by focusing on techniques that address your most pressing business needs and gradually expand your analytics capabilities as you gain experience.

  1. Where can I learn more about big data analytics?

There are many online data science courses available to help you learn more about big data analytics. You can enrol in Imarticus Learning’s Postgraduate Program in Data Science and Analytics to learn about big data analytics.

From Data Collection to Insights: The Data Analytics Lifecycle

In today’s data-driven world, organisations are bombarded with information. But data itself is meaningless without the ability to transform it into actionable insights. This is where data analytics comes in. It is a process that takes raw data and extracts knowledge that can inform strategic decisions and drive business growth.

In this article, we will dive deep into the data analytics lifecycle, going beyond the surface level. We will explore the hidden gems within all the phases of data analysis lifecycle, offer practical tips and techniques, and showcase cutting-edge trends that will set your data analysis apart. By the end of this read, you will be equipped to transform raw data into actionable insights that unlock real business value.

Stage 1: Data Discovery

The data analytics lifecycle begins with data discovery, a critical stage that lays the foundation for your entire analysis. In this first phase of the life cycle of data analytics, we will move beyond simply defining the problem you are trying to solve. We will delve into techniques that help you uncover hidden data needs within your organisation and identify the most valuable data sources to address them.

Uncovering Hidden Needs

Data storytelling isn’t just about captivating presentations, it is a powerful tool for data discovery. By crafting narratives that showcase the potential of data to address business challenges, you can spark conversations and uncover hidden data needs across departments. User interviews also play a crucial role. Talking directly to stakeholders allows you to understand their specific challenges and information gaps, helping you identify data-driven solutions they might not have even considered.

Unconventional Data Sources

Traditionally, data analysis has relied on structured data stored in databases. But the world is brimming with unconventional data sources waiting to be explored. Sensor data from IoT devices can reveal valuable insights into equipment performance or customer behaviour patterns. Social media sentiment analysis can provide a real-time pulse on brand perception or identify emerging trends. By incorporating these unconventional sources, you can paint a more holistic picture and gain a deeper understanding of the business landscape.

Ensuring Data Integrity

Data cleaning is a vital first step, but true data quality goes beyond removing typos and missing values. Advanced data quality checks like anomaly detection can help identify outliers that might skew your analysis. Additionally, data bias is a growing concern. Techniques like bias identification can help you uncover potential biases within your data and develop strategies to mitigate their impact. By ensuring the quality and integrity of your data from the very beginning, you lay the groundwork for reliable and trustworthy insights.

Stage 2. Data Preparation

Data discovery has unearthed a treasure trove of information, but it likely exists in a raw and unrefined state. Data preparation is the stage where you transform this rough ore into a usable form, ready for analysis. Here, we will explore practical techniques and best practices to ensure your data is clean, consistent, and ready to yield valuable insights.

Wrangling the Data: Practical Tips and Tools

Data wrangling might sound like wrangling cattle, but it’s a crucial process for shaping your data into a usable format. Here are some practical tips and tools to help you navigate this stage:

  • Data Transformation: This might involve converting data types (e.g., changing dates from text to a consistent format), standardising units of measurement, or creating new calculated fields based on existing data. Tools like spreadsheets or programming languages (Python, R) can be used for these tasks.
  • Handling Missing Values: Missing data points can be a headache, but there are strategies to address them. Depending on the data and the analysis, you can choose to remove rows with missing values, impute missing values using statistical methods, or group similar data points together.
  • Data Integration: Often, valuable insights lie at the intersection of data sets from different sources. Data integration tools can help you seamlessly merge data from various databases, spreadsheets, or even external APIs.

Version Control for Peace of Mind

Data is a living entity, and it’s likely to evolve throughout the analysis process. Data version control systems, similar to those used in software development, are essential for keeping track of changes made to your data. This ensures you can revert to previous versions if needed and facilitates collaboration within data teams, allowing everyone to work on the same, up-to-date version of the data.

Protecting Privacy With Anonymisation

In today’s data-driven world, privacy is paramount. When working with sensitive data, anonymisation techniques can help protect individual identities while still allowing you to extract valuable insights. Common anonymisation methods include removing personally identifiable information (PII) like names or addresses or using techniques like k-anonymity, which ensures there are at least k records with similar attributes for each data point.

Stage 3. Data Exploration and Modeling

With your data wrangled and ready, we now embark on a journey of discovery. This stage, data exploration and modelling, is where you delve into your data to unearth hidden patterns, identify key relationships, and ultimately build models that can make predictions or inform decisions. Here, we will explore techniques that go beyond the basics and delve into the heart of uncovering the secrets your data holds.

Exploratory Data Analysis (EDA)

Exploratory Data Analysis is often the first step in this phase. But we will move beyond simply calculating basic statistics and generating histograms. Techniques like dimensionality reduction can be immensely valuable, particularly when dealing with high-dimensional data. These techniques help identify underlying structures and reduce the number of variables without losing significant information. Additionally, advanced outlier visualisation methods can help you spot anomalies that might hold hidden insights or indicate potential data quality issues. By incorporating these advanced EDA techniques, you gain a deeper understanding of your data’s characteristics and relationships.

Feature Engineering

Think about building a house, you would not use random bricks, you would select and prepare the ones that best fit your design. Feature engineering plays a similar role in data modelling. Here, you identify the most relevant features (variables) from your data and potentially transform them to improve the performance of your model. Feature selection techniques help you choose the most informative features, while transformation techniques like scaling or encoding can ensure all features are on a similar scale and contribute equally to the model’s learning process. By carefully crafting your features, you lay the groundwork for building robust and accurate models.

Model Selection and Interpretability

Machine learning offers a vast array of models for different purposes. We will explore various models beyond the basic classification and regression algorithms. Decision trees, for example, can be powerful for understanding the logic behind a model’s predictions. Additionally, with the growing emphasis on explainability, interpretable models are gaining traction. These models allow you to understand not just what the model predicts, but also why it makes those predictions. This transparency is crucial for building trust in your models and ensuring they are aligned with ethical data usage principles.

Stage 4. Data Analysis and Interpretation

You have explored your data, unearthed hidden patterns, and built powerful models. Now comes the crucial step which is transforming these insights into actionable knowledge that can inform decisions and drive business value. In this stage of the life cycle of data analytics, we will delve into techniques for analysing and interpreting your data effectively, along with strategies for communicating your findings to a wider audience.

Hypothesis Testing: Beyond Textbooks, Real-World Applications

Statistical hypothesis testing is a cornerstone of data analysis, but textbooks often present it in a sterile, theoretical way. In the real world, hypothesis testing plays a vital role in answering critical business questions. Let us explore practical applications:

  • Marketing Campaign Effectiveness: You might run an A/B test with two versions of a marketing email to see which one generates a higher click-through rate. Hypothesis testing can help you determine if the observed difference is statistically significant or simply due to random chance.
  • Product Feature Optimisation: You might analyse user behaviour data to see if a new feature on your website is leading to increased engagement. Hypothesis testing can help you decide whether the observed change is a true effect of the feature or just a random fluctuation.

By understanding how to apply hypothesis testing in real-world scenarios, you can draw statistically sound conclusions from your data and make data-driven recommendations with confidence.

Data Visualisation: The Art of Storytelling with Data

Data visualisation is not just about creating charts and graphs, it is about storytelling. Advanced techniques like interactive dashboards allow users to explore your data dynamically, uncovering hidden trends and relationships on their own. Storytelling principles like using clear visuals, concise text, and a logical flow can help you effectively communicate complex insights to stakeholders, even those without a strong data background.

A/B Testing & Causal Inference: Going Beyond Correlation

While data analysis can identify correlations, it cannot always prove causation. A/B testing, as mentioned earlier, is a powerful tool for establishing causality in controlled settings. But what about observational data, where you cannot manipulate variables? Causal inference techniques can help you draw more robust conclusions from observational data by accounting for confounding factors that might be influencing the relationships you observe.

Stage 5. Communication and Action (Final Stage)

You have navigated the data science life cycle, transforming raw data into a treasure trove of actionable insights. But the journey does not end here. This final chapter of the data analytics lifecycle focuses on putting your insights to work, fostering a data-driven culture within your organisation, and ensuring responsible data usage practices.

Data Democratisation: Empowering Everyone with Data

Data should not be confined to the realm of data analysts. Data democratisation is the process of making data accessible and understandable to everyone in your organisation. Here are some strategies to empower non-technical stakeholders:

  • Develop data literacy programs: Equip employees with the basic skills to understand data concepts, interpret visualisations, and ask data-driven questions.
  • Create user-friendly data dashboards: Design interactive dashboards that allow users to explore data independently and discover insights relevant to their roles.
  • Encourage data storytelling: Foster a culture where people translate data insights into clear, concise narratives that resonate with different audiences.

By empowering everyone with data, you unlock the collective intelligence of your organisation and unlock the full potential of your data analysis efforts.

Building a Data-Driven Culture: Decisions Rooted in Evidence

Data should not just be used for reactive problem-solving, it should be ingrained in your organisation’s DNA. Here is how to cultivate a data-driven culture:

  • Lead by example: Senior leadership needs to champion data-driven decision-making and actively seek data insights to inform strategic choices.
  • Integrate data into workflows: Embed data analysis practices into existing workflows across departments, ensuring data informs decisions at every level.
  • Celebrate data-driven success stories: Recognise and reward instances where data analysis has led to positive outcomes, reinforcing the value of data-driven decision-making.

By fostering a data-driven culture, you create an environment where data is valued, trusted, and actively used to achieve organisational goals.

Ethical Considerations and Potential Biases: Responsible Data Usage

The power of data comes with a responsibility to use it ethically. Here are some key considerations:

  • Data privacy: Ensure compliance with data privacy regulations and implement robust data security practices to protect user information.
  • Algorithmic bias: Be aware of potential biases that might creep into data collection, analysis, or model development. Implement strategies to mitigate bias and ensure fair and equitable outcomes.
  • Transparency and explainability: Strive for transparency in your data analysis process and build models that are interpretable. This fosters trust and allows stakeholders to understand the rationale behind data-driven decisions.

By prioritising ethical considerations and responsible data usage, you ensure your data analytics efforts not only drive business value but also operate within a framework of trust and fairness. You can enrol in a solid data analytics course so that you can learn all of the steps in more detail.

Wrapping Up

The data analytics lifecycle is not a linear process, but rather a continuous loop of exploration, refinement, and communication. As you gain experience with each stage, you will develop a keen eye for identifying hidden opportunities within your data and translating them into actionable insights.

Remember, data is a powerful asset, but its true value lies in its ability to drive informed decision-making. By mastering the data analytics lifecycle and embracing the hidden gems of insights within each phase, you can transform data into a competitive advantage for your organisation.

So, start your data exploration journey with Imarticus Learning’s Postgraduate Program in Data Science and Analytics so that you can unlock the power of data to achieve remarkable results. This data analytics course will teach you everything you need to know to become an expert data scientist or analyst.

Frequently Asked Questions

  • I have a lot of data, but I do not know where to start. What is the first step in the data analytics lifecycle?

The first step is defining your goals. What questions are you trying to answer with your data? Once you know your objectives, you can determine the type of data you need to collect.

  • Data cleaning sounds complicated. How important is it?

Data cleaning is crucial. Dirty data leads to inaccurate insights. Techniques like identifying and correcting errors, removing duplicates, and formatting inconsistencies ensure the quality of your analysis.

  • What are some common data analysis techniques?

There are many, but some popular ones include descriptive analytics (summarising data), predictive analytics (forecasting future trends), and prescriptive analytics (recommending actions based on insights). The best technique depends on your specific goals.

  • How can I turn data insights into actionable steps for my business?

Communication is key. Present your findings in a clear and concise way, highlighting actionable recommendations. Collaborate with stakeholders to translate insights into concrete strategies and implement changes to drive business value.