7 ways how big data is used in social media

Almost all of us are familiar with social media in 2021. There are many social media platforms run by different companies in the world. Not to forget, the large number of social media users that have been added in recent years. With the rise of social media, the amount of data produced by different platforms is unmatchable.

The likes, shares, and comments across social media platforms contain information regarding user behavior. It is why business organizations are using big data analytics to make the best use of the data available on social media platforms. Big data analytics is widely used in social media to shape marketing strategies and much more. Read on to know seven ways how big data analytics is used in social media.


  • Omnichannel presence


Many business applications and websites have a social media integration. Customers can log in to a business application using their social media credentials. It helps businesses to collect customer data from social media platforms and use them to provide better services. You can get access to social media posts, browser history, and much more. Since customers have an omnichannel presence, you can collect data from all sources to know more about the preferences of customers.


  • Real-time activity monitoring


Social media is a place where you immediately get to know when someone has liked a post or shared a product link. Businesses monitor the activity of customers on social media to know about their current mood. If a social media user is liking your product posts, you can show them an email quickly to convert them into a customer. No other platform can inform customer preferences in real-time other than social media. Big data is used extensively to collect real-time activity reports on social media.


  • Forecasting


When big data is mixed with modern-day technologies like ML and AI, it can predict customer preferences. Based on customer habits on social media, AI/ML algorithms predict their demands. Businesses then focus on releasing new products/services as per the future demands. For example, when a customer buys something online, the chances of them buying similar products increase.


  • Security


Data vendors cannot illegally transfer customer data to the wrong hands. When customers share data on social media, that data can only be used for business purposes. Your social media data cannot be placed in the wrong hands by business organizations. Big data is used for enhancing the security of social media platforms based on customer suggestions.


  • Campaign monitoring


Marketers run social media campaigns to boost their ROI (Return on Investment). Using big data, marketers can know how well a social media campaign has performed. Young aspirants can go for big data training to know more about how to run social media campaigns and study high-end analytics. business analytics certification course

  • Product pricing


When a firm launches its product on social media, customers give their valuable opinions. Social media is widely used to determine whether customers are satisfied with the pricing of a product or not. Big data training includes data collection from social media channels and how to analyze them.


  • Ad creation


Social media is used to collect info about customer preferences. Based on that info, targeted, and personalized advertisements are displayed on social media channels. Technologies like Hadoop programming and Python programming are also used by big data analysts in social media.

Young aspirants can go for the big data analytics programs launched by Imarticus Learning. Its PG Program in ML and Data Analytics can help working professionals in getting a raise. It also offers a Data Science Prodegree course is also for future data scientists. Start your big data course and learn Python and Hadoop programming!

9 trends in the data visualization job market

Do you love to solve problems by going through huge amounts of data? Do you dream of coming up with strategies and tactics that could take businesses and companies to new heights? If the answer to these questions is yes, then a data analytics course is rightfully suited for you.

When you enroll for a data analytics certification you will oftentimes come across the term data visualization. Before we understand data visualization and what some of the hottest topics trending are, let us quickly browse through the basic idea of data analytics. 

business analytics certification courseWhat is Data Analytics?

Data analytics is the process by which one analysis raw data to draw conclusions about the acquired data. Most of the processes and methods that go into the science of data analytics have been automated into algorithms that analyze data quickly and efficiently for ready human consumption.

The word data analytics is an all-encompassing term that includes diverse data types. The technique of data analytics is useful to reveal metrics and ongoing trends that would at other times be lost in the vast ocean of existing information. The ocean accumulated can aid in optimizing processes for greater efficiency and productivity.

There are 4 types of data analytics explained briefly for your better understanding:

  1. Descriptive Analytics:

Evaluates and describe what has occurred over a fixed time

  1. Diagnostic Analytics:

Focuses on the why with greater emphasis on the diversity of data inputs

  1. Predictive Analytics:

As the name suggests, it tries to predict what is going to happen in the coming term

  1. Prescriptive Analytics:

Makes a suggestion about the possible course of action

9 Trends in Data Visualization Currently

Once you have acquired and analyzed your data, you need to be able to graphically and pictorially represent it in a way that is easily understandable. Data visualization presents you with the technologies and tools required to analyze a massive corpus of data. Here are a few ongoing trends in the field of data visualization that can help you get greater clarity on things:

  1. Big Data

This kind of data visualization will need high-performing devices that will be able to gather data, process it, and transform it into graphical representations that people can quickly draw insights from.

  1. DataOps and Self-Service BI

The term coined by Gartner enhances the quality and reduces the cycle time that goes into the operational aspect of data management. Together, these two tools aid in the smooth flow of information/data across pipelines over the entire supply chain system.

  1. Hybrid Enterprises

After the pandemic hit the world, more and more businesses are opting for cloud-based computing which signals the fact that there is an emergence and rise of product features that is hybrid in nature.

  1. Data Storytelling

This is a crucial angle of business intelligence wherein data analytics helps to revolutionize the art of data storytelling. As organizations strive to build a thriving culture, data storytelling methods enable conversations to be nurtured around data.

  1. Adaptable BI Ecosystem

Developers have made it easy to personalize experiences with respect to a company’s flow of data. Analytic apps have enriched the system reducing the time required for data-based actions over BI loops. With the help of the BI ecosystem, the workflow would run more smoothly making it feel as if it were a unified system.

  1. Agile Strategies

As data is moving at a break-neck speed, firms and organizations would need to re-evaluate how they can strategize data to make it more agile and flexible. Cloud computing can be highly useful in this regard.

  1. Non-Technical Professionals

Non-Technical Professionals also referred to as Citizen Data Communicators, are scientists who can communicate with data effectively and easily. Post-2021 will see an epic rise in data scientists as data visualization becomes the norm and the universal language across business ventures.

  1. Operationalized Data Lake

Data Lake is a popular concept that acts as a storage area for enterprises. A data lake is highly preferred because it offers an economical way of storing a massive amount of data similar, yet, different from the cloud.

  1. Personalized Conversations

Updated NLP systems help data owners to engage with data in a more economical and direct manner.

Benefits of Data Analytics Course

Now that we have gone over in a concise manner what is data visualization, data analytics, and the various trends of data visualization, let us see how a business analytics course can be helpful in the current job market:

  •         It is highly in-demand
  •         The job opportunities are immense
  •         Big data analytics is very important these days
  •         You can explore new revenue streams
  •         Opens up wider freelancing opportunities

These are the various ways data analytics certification can help you in your professional life.

Wondering how to enter the data-driven in 2022? Learn Hadoop Online

The world is changing, and the data-driven economy is becoming more critical every day. If you are willing to be a part of this economy, you need to learn Hadoop. This powerful open-source platform can help you manage and analyze large amounts of data. In this blog, we will discuss the basics of Hadoop and how you can learn Hadoop online.

An overview of Hadoop

Hadoop is a powerful tool for analyzing and storing vast amounts of data. It’s an open-source project started by the Apache Software Foundation. 

Hadoop has two main components: HDFS (Hadoop Distributed File System) and MapReduce.

HDFS stores large files across a cluster of nodes, whereas MapReduce processes data in parallel.

Many large companies also use Hadoop, such as Facebook, Yahoo, and Google. It’s an excellent tool for analyzing big data sets.

Here are a few benefits of learning Hadoop:

  • Hadoop is an open-source platform, which means it’s constantly improving with the community’s help.
  • It’s a very versatile tool that you can use for various tasks such as data mining, web indexing, and log processing.
  • Its scalability makes it perfect for big data projects.
  • You can use Hadoop on various devices, from laptops to servers.

So if you want to make a career out of data-driven, learning Hadoop is a great place to start. And with so many online resources available, it’s easier than ever to get started.

How to learn Hadoop online: some tips for getting started?

Data is increasingly essential in today’s business world. It is vital to have a strong understanding of data and use it effectively to stay competitive. Hadoop is the most popular tool for managing and analyzing large amounts of data. If you’re looking to enter the data-driven world in 2022, learning Hadoop is a great place to start.

But where do you start? Learning Hadoop can be overwhelming, especially if you’re new to the topic. There are dozens of online courses and tutorials, and it can be challenging to know which one is right for you.

 Here are some tips for getting started:

It will be the best option if you decide what you want to learn. Hadoop is a complex tool, and there’s a lot of material to cover. It’s essential to focus on one or two specific topics first, rather than learning everything all at once.

Once you’ve decided what you wish to learn, do some research and find the best course or tutorial for you. There are many different options available, so it’s crucial to find one that fits your needs and learning style.

Discover data analytics courses with Imarticus Learning

This data visualization program is by industry specialists to help students master real-world Data Science applications from the ground up and construct challenging models to deliver relevant business insights and forecasts. 

Course Benefits For learners:

    • Learn data analytics and machine learning fundamentals and the most in-demand data science tools and methodologies to become job-ready.

    • Study data analytics certification courses by participating in 25 in-class real-world projects and case studies from business partners.

    • Business analytics courses are for recent graduates and early-career professionals who want to advance their jobs in Data Science & Analytics, the most in-demand job skill.


Here’s How Creating a Data Analytics Culture Can Start Changing the Conversation About Data

A data analytics culture is beneficial in the current times. Data is generated in every business and when rightly used, it can benefit the entire company. The change in the conversation around data can start from PGA programs. A well-rounded data analytics course with placement ensures that students are able to make data-driven decisions. It also encourages a data analytics culture from a very early stage.

How to Create a Data Analytics Culture

Candidates with data analytics certification can use their expertise to introduce this in companies that are yet to embrace data analytics. To create a data analytics culture, one can use the following points.

  • Ask Team Leaders to Use and Promote the Data Analytics Culture

Team leaders need to understand the use of data analytics and promote the culture among their team members. The stakeholders of a company also need to assess how a data analytics culture will enable business development based on data-driven decisions. Once the employees see the leaders promoting this culture, they will be more inclined towards following the same.

  • Introduce Data Democratization

Data democratization enables inexperienced employees to analyze data for their own use. It makes data more accessible and when introduced, it can help employees become more productive.

  • Set Achievable Goals

When the data analytics culture is set up in a company, it should focus on showing what usable and available data looks like and how the company can benefit from the analysis of that data. These are the basic goals that should be set. As stakeholders and employees start understanding the culture, other goals can be set that is based on the utilization of data analytics in different departments.

  • Organize Data Literacy Workshops for All Team Members

Data literacy involves teaching teams to utilize and analyze data for the benefit of the business. Companies can conduct sessions or hands-on workshops so that employees become more comfortable in applying the available insights for the overall improvement of the company. Data scientists can be asked to conduct these sessions and help departments benefit from the use of data analytics.

  • Obtain Constructive Criticism and Positive Feedbacks

Positive responses to a new culture can make it easier for employees to transition, especially if there has been a pre-established method of working. Constructive criticism can also help to build the culture and optimize business processes that benefit from data analytics.

  • Boost Employee Morale and Get More Benefits

While data analytics can help with business development, it needs to focus on the employee community as well. Employee performances can be analyzed. The insights generated can be used to improve interactions and optimize their daily tasks. This will boost morale and encourage them to work better.

Bringing Change in Conversation About Data

To introduce the use and analysis of data in every sector, the conversation needs to change. The best way to ensure that more people are aware of the impact of data analytics, one can encourage students to engage in the study of data science and analytics.

Imarticus Learning offers data analytics certification for graduate students who wish to learn about the implementation of analytics. The curriculum of the postgraduate program in Data Analytics and Machine Learning is created and monitored by industry experts. Therefore, students can work on several industry case studies that allow them to understand the practical uses of data analytics.

Imarticus Learning’s data analytics course with placement is a great way to start one’s career and open up the conversation around data. It is ideal for freshers as well as professionals who wish to advance their careers.

What are the Big Data Use Cases That Explains Digital Transformation?

The business world is transforming. Big data is influencing business decisions, marketing optimizations, business predictions, and day-to-day operations. Big data is expected to reach $300 billion by 2023. Though the term ‘Digital Transformation’ is loosely used as a euphemism for the modernization of data infrastructure, the true meaning of the word is becoming vital for the business world.

big data analytics courses in IndiaIt is true that the organizations are increasingly becoming data-centric, that they allot nearly 40 percent of their technology budget for digital transformation.

Data analysis courses facilitate faster, better, and smarter business decisions helping to achieve better operational efficiency, building a loyal client base, and leading to higher profit. Let us have a look at some use cases that explain this transformation.

Banking

Banks need to deal with a massive amount of financial information. Big data is used in banking to structure the collected data, organize them based on the business needs and analyze the data to derive insights on spending patterns, storing historical data like the transactions, payment records, etc. It also helps in identifying fraudulent actions and ensuring preventive measures are in place to block such frauds.

Another area of big data application is to prevent identity thefts. The banks use big data to keep a tab on customer actions. For example, if a customer follows regular spending patterns using the credit card such as groceries and general shopping, and all of a sudden there is a change in the behavior, such as spending money in gas stations and convenience stores from multiple locations across the city, the bank suspects something unusual. In this case, the bank may try to call the customer and find out if the card is stolen.

Online Shopping

Imagine you visited an online store and added some products to your cart. On second thought, you abandoned the cart and signed out without making any purchase. After some time, upon casual browsing, you see an advertisement for the same product you had planned to purchase.

The next day, you receive a mail with a discount offer for the same item. Targeted advertising is another application of big data. Online stores watch every movement of their customer from the moment they enter the store. They keep track of the pages you visited, the product you intended to buy by adding to the cart, etc. They use all this data to show targeted ads with irresistible offers that finally nudge you to purchase them.

Travel and Logistics

Big data facilitates the smooth running of logistics and transportation. It helps in scheduling flights, to show the booking status and seat availability, seasonal fluctuation in booking, etc. It also collects data regarding weather across the globe to predict flight delays. Big data is also used to analyze user trends and to predict the number of airplanes needed to cater to the increasing number of passengers. It could also be used to perform competitor analysis.

big data analytics courses in IndiaGiven above are some use cases that explain the application of big data in various industries. Apart from this, education, healthcare, digital advertising, environmental studies, human rights, etc. are some prominent areas that use big data to streamline their actions.

If you aspire to start a career in big data, this is the perfect time to enroll in a big data analyst course and secure a lucrative career.

Augmented Analytics: The Future of Data & Analytics!

Augmented analysis simplifies data analysis and helps in getting insights. It is used by firms/companies to forecast better and to automate data analysis processes. Augmented analyses use enabling technologies like AI and machine learning to help speed up and automate data analysis processes.

You can manage your business data up to an extent when the data generated is large one needs augmented analysis to manage big data sets and extract insights. Less time will be spent on understanding the data with the help of augmented analysis. Let us see how augmented analysis is the future of data & analytics.

Benefits of Augmented Analysis

The pros of augmented analysis are as follows:

  • You can automate data analysis processes like data cleaning, forecasting, data management, etc. with the help of augmented analysis.
  • Expert developers can build better business models with the help of insights via augmented analysis. The accuracy of predicting trends and business opportunities increases.
  • Data preparation under which the data is classified and arranged in a structured manner is a very tedious chore. This process can be automated via augmented analysis.
  • The augmented analysis will help you in cost optimization as it will help you in using less human labor and more automation. Your developers can provide you with more insights with the help of augmented analysis.
  • Risk identification and management can be done properly with the help of augmented analysis.
  • Data insights can be represented in natural language statements to people who are not into data analysis. In organizations, augmented analysis helps in conveying business insights and forecasting results to all employees.
  • Data security and privacy can be managed better via augmented analysis. Any anomaly in the data set can be identified immediately and can be managed. It also helps in adhering to data regulations laid by the regulatory authorities.

 Why Big Data Management is Necessary?

The augmented analysis helps in big data management as such a large amount of data cannot be managed manually. Big data management is done by firms to know about market trends, opportunities, market volatility, etc. It also helps in knowing about the buying habits of customers/clients. You can target an audience of any particular age group, locality, gender, by using data insights. You will stay ahead of your competitors and grab potential opportunities.

big data analytics courses One can learn big data management via Big Data Analytics Course from a trusted source like Imarticus Learning.

Data Analytics Future

The latest technologies like machine learning, deep learning, AI, etc. are shaping the way the data analytics industry worked.

Companies and firms are producing more data every day and a lot of businesses are shifting online, to manage this data augmented analysis is being adopted by firms. Developers can boast a more successful Big Data Analytics Career via augmented analysis as it will increase their analytics ability.

Conclusion

Data analytics is one of the fastest-growing sectors recently. Companies and firms are investing in data analytics to gain profits in the long run. One can learn from Big Data Analytics Courses available on the internet to build a successful Big Data Analytics Career. Grab your online course now!

What is the Technical Data Analyst Skillset for The Digital Enterprise?

As data science is regarded as the “new oil” for the technology industry, there is a surge in the demand for skilled professionals. Data Analytics is finding its application in nearly all aspects of life, from education to healthcare, social media, e-commerce, and fintech, to mention some. As a professional, data scientist plays a pivotal role in the business ecosystem and influence business decisions.

data analytics coursesAnalytics, in general, has three important components – business context, technological intentions, and data science.

Data science is a broad term that encompasses different expertise like research – both operations research and statistical research, machine learning algorithms, and deep learning.

No matter which aspect of data science are you planning to focus on, you need to understand the key skills that make up a good data analyst. Read on to learn about the skills you need to excel in a data analyst career.

MS Excel

One of the most widely used app for data visualization as well as financial, statistical, and mathematical calculations, excel is the basic tool one needs to master while looking for a career in data science. The pivot tables are one of the most popular tools used in data analytics. Charts are excellent tools for data visualization. Slicers and filters allow organizing data while the formula-based techniques are great for creating aggregate reports, while other features like Vlookup help process a large number of data bits into a well-organized structure, enabling easy comprehension.

Data Warehousing

In simple words, data warehousing involves the collection of data, organizing them, and storing them. Data analysts and projects managers are usually responsible for data warehousing, where they handle the safekeeping of the data, ensure that the privacy rules are strictly adhered to, and monitor them. Data analysts should be able to integrate the data collected from different sources, analyze and create analytical reports, and support decision-making.

Data Retrieval Skills – SQL

The Structured Query Language (SQL) is used to connect with the database. Whether updating a database or retrieving data from it, SQL is the standard language used by Relational Database Management Systems (RDMS).  SQL skills are mandatory if you wish to have a career in Big Data. However, learning SQL is simple, even non-technical people can learn it. It has become a basic skill used in many organizations to create, maintain and modify database structures and storing the collected data.

Coding and Programming Skills

Data analysts should master coding and programming to practice their knowledge. You don’t need to be a hard-core programmer, but you need to know the basics and should be comfortable with coding and programming to excel in this role.

While the primary responsibility of a data analyst is to analyze the data and derive meaningful insights from the, understanding the concepts such as functions, loops, if-else, and programming logic would be an advantage while dealing with a large amount of data.

Artificial Intelligence (AI) and Machine Learning

AI and machine learning help enhance data analytics. When you prepare a machine learning algorithm and provide it with a model, it gives you an output based on the model provided. For instance, if you train a machine learning algorithm and provide it with a predictive model, it will provide you with predictive analysis based on the data feed.

There is no absolute definition of skills needed to excel as a data analyst. Most data analyst courses cover the basic skills needed to secure a data analyst job. There is a buzz about big data and its application. Almost all industries are espousing data analytics. As technology improves, there could be overlaps in the job role, or the job roles could encompass wider aspects of data science. The better skilled you are the more are the chances to excel in a data analytic job.

How Analytics Is Being Used In Data Journalism?

Growing technology leaves an impact on every industry. As people want to upgrade, they allow the integration of computation in their fields. The current trends in journalism are no different from any other. There is an intersection between computation and journalism, which we will widely discuss here.

AI is expediting the process of analyzing data and synthesizing them into stories. For example, automatic story writing involves Natural Language Understanding and Processing for synthesizing reports. AI also helps generate images and videos for data journalism.

Why do journalists need to learn data analytics?

There is a shift in the digitalization of media publications, and companies who couldn’t bring the change collapsed. Simultaneously, the ones that could are now exploring data and computation tools to make journalism more economical.

The process of computational journalism is using analytical tools for reporting. Data journalism is much different from traditional journalism, and journalists need to keep up with the trends. If you plan to work in media, you will also need to gather knowledge from a data analytics course to work more efficiently.

The job of a journalist is to take unstructured data and creating a structure. They have to be convincing enough to catch people’s attention. Structured data is not always informed about different people or events. It can also include factual numbers like tracking money, the effects of an election, and so on.

One of the most prominent examples of how data journalism worked is the exposition of the Panama Papers. Global journalists came together and exposed famous names, which led to resignations and legal trials.

Among all media companies reporting, a German newspaper, Süddeutsche Zeitung, revealed the most extensive dataset. The company had an anonymous source report of 11 million documents to them. The company then teamed up with 370 journalists across 76 countries and carried out a year-long investigation to expose influential people.

Without the help of analytics, it is impossible to have evidence regarding such matters of corruption.

Data journalism makes way for democratic storytelling

People who join the data analytics career work with the science of analyzing raw data for drawing conclusions. When you add this to journalism, it creates a more straightforward approach for the media as well.

Nowadays, computer-assisted reporting is standard, and technology helps us gather information, analyze, and create stories. Thus, open data is democratic, factual, and engaging.

Every industry is taking efforts to make data more available to people. For example, data regarding the government, census, demography are all on the internet. Thus, it helps journalists who like to dig deeper into their research and come up with fact-based reports.

One such example will be the Stanford Open Policing Project. The university’s journalism department allowed its students to register freedom of information act requests. All the states were asked to report the electronic version of the stop data of State Police. In two years, they garnered records from 31 states with 130 million records.

The data helped students understand what makes a policeman pull over someone.

The university opened the data for any media house or local reporter to download this information. The revelation helped people understand the state police better. It also highlighted how the police take actions across racial demographics and a pattern to understand how they work.

Visualization is vital for journalism

Data visualization is an essential part of journalism as it engages people. Journalists take complex data and convert them into exciting visuals. People don’t have much time to read lengthy content nowadays. Attractive visuals with short content are more engaging.

Visualization is another aspect of why journalists need to know how to use tools to create them. There are many such tools available to create compelling visuals with complex datasets. It goes onto show the varied skillset a journalist needs to have for surviving in this field.

Take Advantage of This Once-In-A-Lifetime Opportunity To Express Your Ideas And Win Fantastic Prizes.

Are you a Data science blogger? Imarticus Data Science is proud to announce our Data Science Blogging contest. This contest will reward the best Data Science blog posts of 2021 with fantastic prizes with up to 10,000 gifts vouchers.  

Do you feel like you have many insightful thoughts to share as a blog on Data Science & Analytics? If you enjoy writing about data science, there is a once-in-a-lifetime opportunity to put your ideas in front of countrywide audiences. And the best blog post author stands to win a prize for their work!

data science and analytics blogging contestShare your blog on any of the following topics: 

  • Data science
  • Data Analytics
  • Machine Learning
  • Data Engineering
  • Deep Learning
  • Computer Vision
  • Python Programming and many more related to Data Analytics topics. 

 The Criteria to Participate in Data science Blogging contest

  • All blogs should be 500 to 1000 words in length.
  • The content must be original, well-researched, plagiarism-free, and informative.
  • Do not entertain duplicate posts.
  • The deadline is August 31st, 2021, at 11:59 pm IST.
  • The number of article contributors is restricted to three members.
  • blog.imarticus.org will host all the articles with credit given to the contributor(s). Blog entries are considered Imarticus Learning intellectual property from this point onward.

 How to enter in the Data science Blogging contest and the process

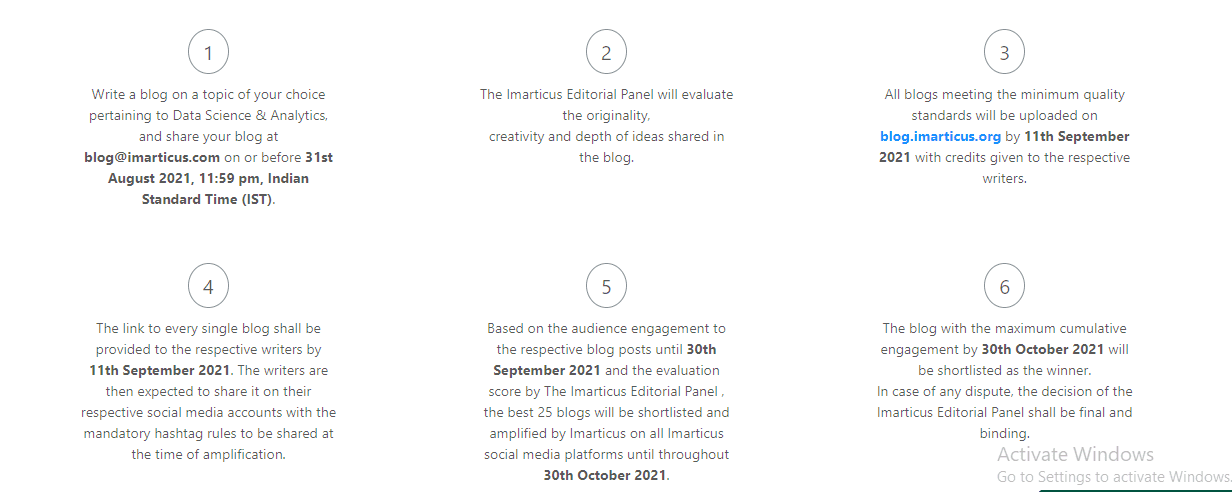
  1. Write a blog on a topic of your choice pertaining the data science and analytics. After completion, share your blog at blog@imarticus.com on or before August 31st, 2021, 11:59 pm, Indian Standard Time (IST).
  2. The originality, creativity, and level of depth in all blog articles.
  3. The content should meet the minimum criteria explained above and be submitted before the given deadline.
  4. Will upload all the eligible blogs on or before September 11th, 2021.
  5. The writers will receive the respective blog links by September 11th, 2021. The individual should share the blog link on their social channels with mandatory hashtag rules.
  6. Imarticus team will evaluate the engagement on the individual blog posts until September 30th, 2021. The Imarticus panel team will shortlist the best 25 blogs and promotes them on their social channels until October 30th, 2021.
  7. The blog that receives the most engagement by October 30th, 2021, is shortlisted as the winner. Imarticus Editorial Panel’s decision is final and binding in case of any dispute.data science and analytics blogging contest

 Why should you participate in the Imarticus Blogger of Year Contest?

  1. Imarticus Social recognizes your skill and is eager to help promote your blog.
  2. Exiting winning amount to motivate and encourage your effort.
  3. The winner details will get necessary coverage within the media promoted and supported by Imarticus Learning.
  4. We will promote the interview of the top 25 selected bloggers on different social channels of Imarticus Learning. 

Apart from the 10,000 gift voucher to the winner, Imarticus Learning will give prizes to the other participants. The details are as follows:

  • Winner: 10,000
  • Runner Up: 7,500
  • 3rd Place: 5,000
  • 4th to 10th Position: 2,000
  • 11th to 20th Position: Imarticus Hall of Fame Entrydata science and analytics blogging contest

T&C Apply.
Imarticus Learning shall own the Intellectual Rights of the blog content shared with us at blog@imarticus.com with due credits to the writer(s) till perpetuity. Imarticus Learning reserves all the rights to use, publish or remove the content on all our platforms.

The decision of the Imarticus Editorial Panel shall be final and binding in all matters. Any dispute will fall under the jurisdiction of Mumbai. The winners will receive Gift Vouchers.
To know more – Click here 

Conclusion: 

If you are interested in data science and want to share your ideas with the world, then this is a once-in-a-lifetime opportunity. Entering our #ImarticusBlogLikeAPro Season 1 Championship Award along with a cash prize of INR 10,000/ will not only is fun, but it could also win you fantastic prizes! Professional tone required for submission.

How Can Data Analytics Help You Become a Better Entrepreneur?

The data analytics industry has grown exponentially in the past decade, and more data is being generated every day. This is due to the increasing need for data and data analysis that companies are facing as their dependence on data increases exponentially.

This data, when analyzed, can be used to make important decisions for businesses and individuals alike. Data analysts not only have a skill set that can be applied to any business but also possess the ability to think critically and identify innovative solutions for problems.

The time is now for you to join a data analytics course so you, too, can reap the benefits of this thriving industry! Let’s see how.

How do Data Analytics Skills Help you Become a Better Entrepreneur?

One of the important skills for entrepreneurs is knowing how to handle data, i.e., learning data analytics skills. These skills are very versatile and practical that will enable you to handle your business & its data efficiently. Data analytic skills have not only increased in importance over the last few years but also have grown to be one of the leading industries, so it’s no surprise that individuals who know data analytics skills are in demand and have a lot of career opportunities.

Data analytics skills give you a new way to compete in the job market, one that does not hinge on your education or even some sort of innate talent. There’s always a need for more data analysts and statisticians as businesses are coming up with ways to mine their databases for insights. Nearly 50% of Data Scientists say they created statistical models last year despite having no formal training in statistics.

best data analytics courses in IndiaLearning how to efficiently analyze large sets of data can help make you stand out from other applicants who might have an impressive resume but lack experience with big data tools like Excel and R programming language.

Employers know there is value in someone who has the ability to work quickly through raw information without any previous knowledge about what it all means, which makes learning Data Analytics an attractive option for students and professionals alike.

Data Analytics skills can help with this by providing an easy-to-read breakdown of campaign success and failure rates. This will allow you to take action on your most profitable campaigns while cutting funding for any that are not profitable.

best data analytics courses in IndiaFurthermore, it can help you by providing reports on the time spent on each campaign or task that will enable you to measure how much effort is put into work. Thus, learning how to utilize data analytics training can help you become a better entrepreneur by learning what actions need to be taken or prioritized differently in order to grow your business more effectively.

Become a New-Age Data Entrepreneur with Imarticus Learning

If you want to be a better entrepreneur, it is time for you to join the Data Analytics course at Imarticus Learning. The data analytics course at Imarticus Learning is designed to keep the specific needs of today’s data-driven world in mind and will teach you the skills that can help make your business more successful.

best data analytics courses in IndiaThe curriculum includes a range of topics, from basic statistics and probability theory to advanced machine learning techniques. You can learn data analytics online at your own pace, so there’s no need to put off enrolling until you have more time or money!

This program will help you move forward in your career! For more details on Data Science Course, contact us through the Live Chat Support system or visit any of our training centers based in – Chennai, Mumbai, Thane, Pune, Bengaluru, Hyderabad, Delhi, Gurgaon, and Ahmedabad.