A guide to understanding Tableau concepts

A guide to understanding Tableau concepts

When you analyze data in Tableau, you have a choice. You can either choose to display the data continuously or discretely.

Continuous – A continuous chart is easy to read. The bars or lines in the chart never indicate a break in the data. If you’re comparing two or more sets of data, the continuous manner of displaying the data is the best choice. If you want to see how one number affects another, this is the best way to do it.

Discrete – A discrete chart is one in which the data is broken into discrete bars or lines. This is the best choice when you want to compare two or more sets of data. It’s also a good choice when you want the viewer to know that there is a difference. This may be something like comparing the sales numbers of two stores.

What are row level, aggregate level, and table level in Tableau?

This is probably the most confusing aspect of Tableau for beginners.

By row level, we mean that the data is organized in rows.

By aggregate level, we mean that the data is organized at the level of aggregates.

For example, we have company names and numbers at the row level. At the aggregate level, we would group the numbers under one name.

Tables can add visual interest and can provide another layer of data that can be used to understand your data further.

At the table level, we would join all the data from the previous examples under one name, “Technology.” This name could be a column in the table or a filter on the view.

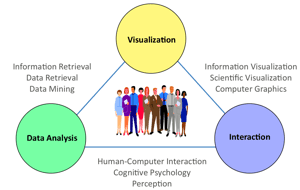
A quick overview of Tableau features

Decision Trees – A powerful tool you can use to see the relationship between different data sets. For example, let’s say you want to see what your customers like the most about your products. A decision tree will help you visualize this data. You can either use Tableau’s built-in decision tree tool or create your own.

Visual Crosstabs – This is a great way to create a table that shows the breakdown by category or by a specific value in a column. With this table, you can compare two columns or two columns and a value.

Heatmaps – This is a great way to visualize your data like the crosstabs. All you need to do is select a measure and create a bar chart. Then, you can add a visual pattern to the bars.

Time-Series Charting – This is great for visualizing a history of data. You can use an actual time series or create a visual that spans multiple data points.

Interactive Charts – This is the blending of interactive and visual data. You can use this feature to create dashboards that support complex queries and deliver dynamic visuals.

Advanced Reporting – Tableau’s reporting features are some of the best out there. You can create custom reports or use their built-in report templates.

Linking to Data Sources – Like many data visualization tools, Tableau allows you to connect to external data sources. You can access your SQL database, Excel spreadsheets, Amazon machine learning model, or Google Spreadsheets.

What are the Dimensions and measures in Tableau?

When you create a visual in Tableau, you are creating a visual using dimensions and measures. A dimension is a way to categorize your data. Let’s say you have a marketing team that tracks different metrics related to their work. You could create a dimension to store this information. Let’s say you create a dimension called “Metrics” that contains the following information:

Tableau features

You can integrate Tableau with many data sources, including SQL databases, Excel spreadsheets, Google Spreadsheets, Amazon Web Services, and more.

– Tableau has a free software product and a low-cost subscription product.

– Tableau’s subscription-based product has more functionality.

– Tableau can be used for data discovery, analysis, reporting, and visualization. – Data sources can be internal or external.

– Tableau can be used for self-service BI or for managing a BI project.

– Tableau can be used for data hygiene, wrangling, quality, modeling, and more.

– Tableau is available on all major operating systems, including Windows, macOS, and Linux.

– Tableau is highly customizable and offers different charting and visualization styles.

With this knowledge, we know you can get an idea of data visualizations when using business intelligence software like Tableau. So what are you waiting for? Apply for an Imarticus Learning course today by visiting our training centers in Mumbai, Thane, Pune, Chennai, Bengaluru, Delhi, Gurgaon, or Ahmedabad or contact us through chat support.

5 mistakes to avoid while working with Tableau

5 mistakes to avoid while working with Tableau

Tableau is a powerful data visualization tool that can help you make better decisions and improve your business. But what is a tableau, and why is it so important?

Its business intelligence software allows you to see and understand data in new ways. For example, tableau can easily create stunning visuals that help you see patterns and trends in your data. This can be extremely helpful in making decisions about your business.

Learn Tableau, as it can help you answer questions like:

-What are the most critical trends in my data?

-Which parts of my data are most important to me?

-What conclusions can I draw from my data?

Tableau can also help you create visual representations of your data that are easy to understand and share with others.

It is very user-friendly, even for people who are not data experts. This is because tableau makes it easy to connect to data sources and create beautiful and informative visuals.

Using tableau in decision support includes quickly and easily visualizing data, understanding relationships within it, identifying trends and patterns, and assessing risks and opportunities. Tableau can also be used in planning processes by helping managers see how individual decisions may impact the organization as a whole.

Before you get started, keep the following pointers in mind

5 mistakes to avoid in tableau

  1. Making too many forecasts – Tableau is a data visualization tool, not an investment modeling or forecasting tool. As such, don’t over-forecast your data or try to model every outcome in your dataset. Your table will become cluttered and less effective overall. Instead, try to focus on one or two key metrics you want to analyze while leaving the rest of the data untouched.
  2. Focusing exclusively on numeric values – Tables ensure powerful visualizations. Still, they can be incredibly misleading if they rely only on numerical values without other supporting information (e. g. labels, visual representations). Instead, try to use other visualizations (e.g., bar charts) and data types (text, pie charts) to help supplement your table’s information and better communicate your findings.
  3. 3. Ignoring axis labels – Tableau will automatically create column headers based on the names of each field in your dataset. Still, you can also add additional text labels to make the axes more visible and easier to understand. Label every axis, so everyone who looks at it understands what they see.

The problem with ignoring axis levels is that it can make it difficult to understand how the data relate. For example, if you have two axes (say, Sales and Cost), it’s easy to see which column corresponds to which axis by looking at the labels on the y-axis (Sales) and x-axis (Cost). However, if you only have one axis level (say, Country), it’s much harder to see which column corresponds to which axis.

  1. Not linking fields – When two or more fields in a dataset are related (e.g., a column that is the result of grouping multiple fields), Tableau will create a link between them so that users can quickly see how those fields are related. Make sure you add appropriate links between your data fields so that readers can see exactly what information is displayed in each cell.
  2. Creating duplicate data – One common mistake table creators make is to include duplicate data within their tables – copying the same values across different cells or even across other rows and columns. This duplication can be visually unpleasing and make it more difficult for readers to understand your data and make informed decisions. Remove any duplicate data from your tables before you upload them to Tableau.

Overall, Tableau is an incredibly powerful tool that can help you boost your business. If you haven’t already started using tableau, now is the time. Learn Tableau

Imarticus Learning offers a postgraduate data analytics program that covers all the concepts of Tableau to help you get skilled. Click Here to know more about it.

Contact us through our chat support on our website, or walk into our training centers and get yourself enrolled in a data analytics course with placement and have a bright future.

Steps to create a dashboard in Tableau

If you are having trouble with the excel sheets and finding it hard to create complex formulas to deal with the data, the Data Visualisation tools such as Tableau are here for the rescue! It can help use unmanageable data into beautifully crafted interactive dashboards. Those who have Tableau certification are hot properties in the Data Analysis and Data Science fields. 

Tableau is easy to use, works faster, and is also easy to set up. The tool is available in both paid and free versions. Knowing how to operate this will be an added advantage while doing any Artificial Intelligence and Machine Learning course

Getting this software and creating a dashboard is required to get a simplified version of the raw data that you are dealing with. SO, here are the steps to create a dashboard in tableau. 

Step #1 Creating a dashboard

Download and install the Tableau software to start the process. Once it is set up, open it and click on the ‘New Dashboard’ button to create a fresh one. Give an appropriate name to this dashboard so that it is easy to identify.

Step #2 Adding sheets to the board

The next step is to bring in the excel sheets with the data that you need to work on. Drag the required sheet onto the dashboard space. Alternatively, you can also select the most relevant data from a sheet, instead of the whole sheet. 

Step #3 Add additional sheet(s)

Tableau dashboard allows adding as many sheets as required for the data analysis. The additional sheets may be added in the relevant space and can process the data on all or selected sheets, as required.  

Step #4 Customization

The next step is where you customize or filter the data as per the requirement to create an interactive dashboard. Choosing layouts, adding images or texts, navigation to move from one data to another set, etc can be done at this stage. 

Step #5 View and share the data

Once all the customization is complete, view the data in full-screen mode and see if any changes are needed. Once satisfied, you can share the dashboard with others for review and discussion. 

Why is Tableau important?

Tableau is a data simplifying tool that helps manage a vast data resource. It can easily blend with AI to make faster and smarter decisions regarding the data. It also assists in integrating the data to work directly with various models of Machine Learning. Having a Tableau certification will be an asset, especially one pursuing an IIT Artificial Intelligence course or an Artificial Intelligence and Machine Learning course. Integrating the results of data interpretation decisions made using AI and ML into visualized data using Tableau helps people understand it better. 

best artificial intelligence courses by E&ICT Academy, IIT GuwahatiTableau opens a way for qualifying and quantifying the data while also identifying any particular pattern with the missing data. It is one of the robust tools that is required while implementing the machine learning models or solutions so that the business side can also understand and visualize the analysis or predictions. 

Conclusion

While the top-rated Artificial Intelligence course by E&ICT Academy, IIT Guwahati can develop a qualified and faster data analyst, the Tableau tool helps them be smarter. The drag and drop spaces on the Tableau dashboard allow you to investigate and relate the data with the intended outcome. It can work with multiple external data resources, not just the excel sheets. In other words, a single dashboard can combine data from various sources. Here, the visualization is possible with the help of charts, graphs, maps, tables, and some advanced methods.   

best Artificial Intelligence courses by E&ICT Academy, IIT Guwahati

Tableau: Accelerating Decision-making with the Power of Visual Analytics!

Tableau is one of the most frequently used data analytics tools. It is used for data visualization where the data is represented in a pictorial or graphical form. The raw data is converted into an understandable format by Tableau which can be further used for data analytics.

Firms use Tableau to understand the data and to use data analytics for empowering their business. Tableau helps in decision-making via forecasting, analytics, risk assessment, etc.

Let us see more about Tableau and how it helps in decision making & data visualization.

Importance of Visual Analytics

Visual analytics is the analytical reasoning of data via interactive visual interfaces which in this case is Tableau. Visual analytics helps in understanding the data better, finding outliers in the dataset, discovering insights, etc.

You can identify new opportunities for your business if you are visualizing your data via a good platform like Tableau. The benefits of using Tableau for visual analytics are as follows:

  • Tableau has excellent visualization capabilities and it helps in converting unstructured data into absolute logical results that are interactive. It is far better and powerful than its equivalent tools available in the market.Data Visualization
    The easy-to-use interface of Tableau provides data analysts to work faster and better. The drag-and-drop way of arranging unstructured data into diagrams and graphs makes it easier for beginners.Tableau is powerful and provides high performance of big data sets too. Beginners can easily complete Tableau training in less time and can get fluent in using it.
  • You can create a unified dashboard on Tableau where you can connect to multiple data sources. You can connect your dashboard with Hadoop, SAP, DB, etc., and can visualize data better.
  • There are a lot of Tableau users throughout the globe and one can find a helpful Tableau community on online forums. Tableau also provides a mobile application through which you can keep your visualized data at your fingertips.

How Tableau Accelerates Decision Making?

Tableau helps in visualizing and analyzing data. The structured data can be used for risk identification & management, increasing ROI, business forecasting, etc. You are well informed about your firm’s situation via data analytics and get to know about the upcoming market trends. You access the risk involved in any new opportunity via data analysis and then obtain it if is going to boost your business.

Tableau training in data visualization

Data analysis introduces clarity in your organization with a data-driven approach to obtain business objectives. Decision-making is hugely impacted via the use of data visualization tools and you will stay ahead of other firms in the market.

One can easily create and share analytics reports to your employees via Tableau, giving a sense of clarity. You can also use customer data to provide better services to them in the future. One can complete Tableau training online to understand how to use it.

Conclusion

Tableau is a powerful data visualization tool that can boost your business with better market predictions & risk assessment. Recent innovations in data analysis due to AI & machine learning have taken data analysis to a next level. You can learn more about data analysis via analytics courses available online. Start using Tableau for your business now!