Data Collection Methods: How Do We Collect and Prepare Data?

Understanding the complexities of data-collecting methods is critical for anybody interested in harnessing the power of data. This blog intends to look into and clarify the various approaches used in data collection and preparation.

The importance of gathering data effectively cannot be stressed enough. It serves as the foundation for essential thoughts and conclusions. Data validity is crucial for scientific research, market analysis, and policy development.

This blog will look at various data-collecting methods, such as surveys and interviews, alongside observational research and data mining. The blog demystifies the complexity of data collecting, providing readers with a thorough guide to help them in their search for reliable and relevant data. 

If you want to pursue a career in data science or take up a data analytics certification course, you can use this blog to understand various data collection methods. 

What is Data Collection?

Data collection is a systematic means of gathering and combining information or data from numerous sources for purposes of analysis, research, or decision-making. It is a vital stage in both professional and academic settings, laying the groundwork for significant discoveries and informed choices.

Data collection is the envisioned and systematic acquisition of data, which includes numerical facts, qualitative details, or other pertinent information. These data can be obtained using primary methods such as surveys, interviews, and experiments, and via secondary sources such as existing databases, literature studies, and historical records.

To ensure the validity, dependability, and relevance of the obtained data, the procedure requires meticulous preparation and execution. This approach incorporates principles of ethics, data security, and quality control techniques.

Data collecting is an initial step on the road toward understanding complicated events, finding patterns, making evidence-based decisions, and increasing knowledge in a variety of domains. Its significance cannot be emphasised, since the quality of obtained data has a significant impact on the validity and reliability of future studies and results.

Different Methods of Data Collection

If one wants to pursue a data science course, one should know the different methods of data collection. They are: 

1. Primary Data Collection 

Primary data gathering is a qualitative way of data collecting. It entails acquiring fresh and unique information directly from sources such as surveys, interviews, observations, or experiments. This method allows researchers to personalise data gathering to their individual requirements and study objectives, assuring data accuracy and relevance while minimising any biases that might occur when using pre-existing data sources.

2. Secondary Data Collection 

Secondary data collection entails acquiring previously collected information from sources such as published research papers, government reports, and databases. This strategy is used by researchers to analyse and understand current data without collecting new data. It provides insights into historical patterns, comparisons, and large-scale statistical analysis, making it a powerful tool for informed decision-making and study validation in a variety of sectors ranging from academia to industry.


Types of Data Collection Tools and Methods 

Types of Data Collection Tools and Methods 

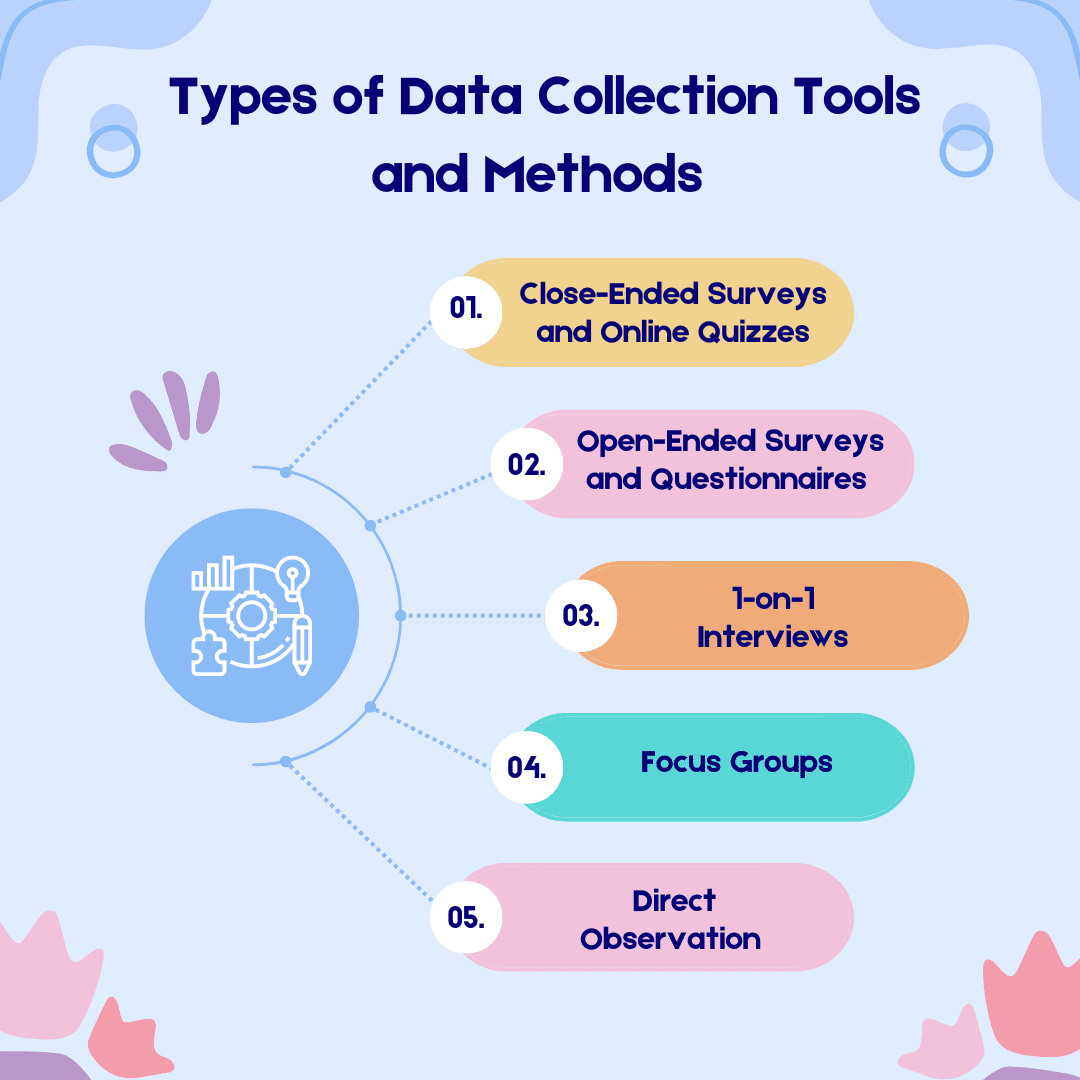
Data analytics course and data science training comes with various methods and tools for data collection. If one aspires to become a data analyst and take up a data analytics certification course, these methods would help them immensely. 

1) Close-Ended Surveys and Online Quizzes

Closed-ended surveys and online quizzes are data-collecting methods that employ structured questions with preset answer alternatives. Participants select from these alternatives, which simplifies data analysis. Closed-ended questionnaires are often used in market research and consumer feedback. 

Online quizzes, which are often used in education and evaluations, effectively gather data and offer immediate responses. Both strategies are useful for acquiring quantitative data in a timely and efficient manner.

2. Open-Ended Surveys and Questionnaires 

Questionnaires and open-ended surveys are significant techniques of data collection. They pose open-ended questions that stimulate comprehensive, free-text replies, resulting in rich qualitative data. These strategies are used by researchers to gather in-depth insights, opinions, and viewpoints on complicated issues. They are useful for exploratory research, qualitative analysis, and revealing unexpected discoveries because, unlike closed-ended questions, they allow for flexibility and investigation of participant opinions.

3. 1-on-1 Interviews 

One-on-one interviews are an effective method for collecting data. They entail an experienced interviewer conversing with a single respondent, asking predefined questions or delving into certain themes. This strategy yields rich qualitative data, revealing personal experiences, views, and feelings. One-on-one interviews are commonly used in social sciences, market research, and qualitative investigations because they provide a thorough knowledge of individual viewpoints and nuanced information.

4. Focus Groups

Focus groups are a qualitative data-collecting method in which a moderator leads a small group of participants in a discussion on a particular topic or issue. This strategy generates a wide range of viewpoints, ideas, and insights. Focus groups are very effective for investigating complicated social problems, customer behaviour, or product feedback. They give detailed qualitative data that assists in understanding underlying motives, attitudes, and views, allowing for more informed decision-making and research findings. 

5. Direct Observation 

Direct observation is a type of data-collecting method in which researchers watch and document events, behaviours, or phenomena as they occur. This method provides real-time, unfiltered insights into the activities of individuals, making it useful in domains such as psychology, anthropology, and market research. It reduces reliance on self-reports from participants and improves data accuracy. Structured procedures are used by researchers to methodically record and analyse observations, assuring objectivity and reproducibility.

Ethical Considerations in Data Collection Methods 

To comply with Indian legislation, ethical concerns in data-gathering procedures are critical. Researchers must acquire informed permission from participants, ensuring that they understand the goal of the study and any potential dangers. 

Privacy and secrecy must be strictly adhered to, by legislative laws such as the Information Technology Act and the Personal Data Protection Bill. Furthermore, data anonymisation and secure storage practises are critical for safeguarding sensitive information. Maintaining ethical standards in data collecting creates confidence, ensures legal compliance, and protects the rights and dignity of all engaged.

Conclusion 

The art of data collection and preparation is an indispensable skill needed to sustain in this data-driven environment. It enables individuals and organisations to get useful insights, make educated decisions and advance in a variety of disciplines. They leverage the power of data to design a more informed future by mastering these approaches and sticking to best practices.

If you wish to become a data analyst and have a budding career in data science, check out Imarticus Learning’s Postgraduate Program In Data Science And Analytics. You will get 100% job assurance with this data science course and learn in detail about various data collection methods.

To know more, check out the website right away.


Engineering and Modelling Data for ML-Driven Systems

A key component of data-driven research and engineering is designing and modelling data for ML-driven systems. Understanding the significance of developing and modelling data for ML-driven systems is crucial, given the expanding use of machine learning (ML) in many industries.

A subset of artificial intelligence (AI) known as machine learning involves teaching computer experts to learn from data and form conclusions or predictions. Since ML-driven systems are built and trained on data, the ML model and algorithm must also be adjusted when the underlying data changes. To become a data analyst, enrol in a data science course and obtain a data analytics certification course.

Data Engineering

Data engineering is designing, creating, and maintaining the infrastructure and systems that enable businesses to gather, store, process, and analyse vast amounts of data. Data engineers are responsible for building and managing the pipelines that carry data from multiple sources into a data warehouse, where data scientists and analysts can convert and analyse it.

Techniques for Data Cleaning and Preprocessing

Data cleaning and preprocessing are key techniques in data engineering that comprise detecting and rectifying flaws, inconsistencies, and missing values in the data. Some typical techniques for data cleaning and preprocessing include:

  • Removing duplicates
  • Handling missing values
  • Standardising data types
  • Normalising data Handling outliers
  • Feature scaling

Tools for Data Engineering

There are numerous tools available for data engineering, and the most often used ones vary depending on the firm and the particular demands of the project. Some of the most prominent data engineering tools include:

Python: It is a powerful and easy-to-use programming language commonly employed for data engineering projects.

SQL: A language used for managing and accessing relational databases.

Apache Spark: A distributed computing solution that can rapidly process enormous volumes of data.

Amazon Redshift: A cloud-based data warehousing system that can handle petabyte-scale data warehouses.

PostgreSQL: An open-source relational database management system.

MongoDB: A NoSQL document-oriented database.

Apache Kafka: A distributed streaming infrastructure that can manage enormous volumes of real-time data.

Apache Airflow: A programmatic writing, scheduling, and monitoring platform.

Talend: An open-source data integration platform.

Tableau: A data visualisation programme that can connect to multiple data sources and build interactive dashboards.

Data Modelling

Data modelling is developing a visual representation of a software system or sections of it to express linkages between data. It entails building a conceptual representation of data objects and their connections. Data modelling often comprises numerous processes, including requirements collecting, conceptual design, logical design, physical design, and implementation.

Data modelling helps an organisation use its data efficiently to satisfy business demands for information. Data modelling tools aid in constructing a database and enable the construction and documenting of models representing the structures, flows, mappings and transformations, connections, and data quality. Some standard data modeling tools are ER/Studio, Toad Data Modeler, and Oracle SQL Developer Data Modeler.

There are several types of data models used in data modelling. Here are the most common ones:

types of data models

  • Relational data model: This paradigm groups data into “relations” tables organised in rows and columns. All the rows or “tuples” have a series of connected data values, and the table name and column names or characteristics explain the data.
  • Hierarchical data model: This model represents one-to-many relationships in a tree-like structure. It is useful for displaying data with a clear parent-child connection.
  • Network data model: This model is similar to the hierarchical model but allows for many-to-many relationships between nodes. It is handy for representing complex data relationships.
  • Entity-relationship (ER) model: This model represents entities and their relationships to each other. It is effective for describing complex data relationships and is often used in database architecture.
  • Dimensional data model: This model is used for data warehousing and business intelligence. It organises data into dimensions and metrics, allowing for easier analysis and reporting.
  • Graph data model: This model represents data as nodes and edges, enabling complicated relationships to be easily expressed and evaluated.

Machine Learning

Machine learning is a discipline of artificial intelligence that focuses on constructing algorithms and models that allow computers to learn from data and improve their performance on a specific job. Machine learning algorithms utilise computer technology to learn straight from data without depending on a predetermined equation as a model.

Machine learning may be roughly classified into two basic types: supervised and unsupervised. Supervised learning includes training a model using known input and output data, enabling it to make predictions for future outputs. In contrast, unsupervised learning identifies latent patterns or underlying structures within incoming data.

Machine learning starts with data obtained and produced to be utilised as training data. The more info, the better the tools. Machine learning is highly adapted for scenarios involving masses of data, such as photos from sensors or sales records. Machine learning is actively applied today for various purposes, including tailored ideas on social networking sites like Facebook.

Integration of Data Engineering, Data Modelling, and Machine Learning

For data science initiatives to be successful, data engineering, data modelling, and machine learning must all work together. Data modelling guarantees that data is correctly structured and prepared for analysis, whereas data engineering creates the infrastructure and basis for data modelling and machine learning. Machine learning algorithms leverage data from data engineering and modelling to extract insights and value from data.

Examples of how data engineering, data modelling, and machine learning may be coupled include as follows:

  • Data engineers’ creation of data pipelines allows for the training and prediction of machine learning algorithms using data.
  • In addition to ensuring that the data is appropriately arranged and displayed, data modelling may be used to develop a model that accurately reflects the data utilised by machine learning algorithms.
  • Data analysis and insight-providing capabilities of machine learning algorithms may be used to enhance data engineering and data modelling procedures.

Conclusion

The success of ML-driven systems is based on the engineering and modelling of data used in these systems. While smart data modelling enables the development of strong machine-learning models that can make accurate predictions and generate insightful information, effective data engineering ensures that the data is clean, relevant, and accessible.

Imarticus Learning provides a Postgraduate Program in Data Science and Analytics that is meant to assist learners in creating a strong foundation for a career in data science or a career in data analytics. The data science training curriculum is 6 months long and includes Python, SQL, data analytics, machine learning, Power BI, and Tableau. The data analytics course also provides specific programmes to focus on various data science employment opportunities. Upon completing the data science course, learners receive a data science certification from Imarticus Learning.

How to Become a Data Analyst in 2024: A Step-by-step Guide

The worldwide market is undergoing an exponential surge in data output. And, businesses are realising the value of leveraging data analytics to make smarter choices. However, specific skills and procedures must be complied with in order to become a data analyst

Notably, big data analytics firms are flourishing, with a compound annual growth rate of nearly 30% expected in the upcoming years. The market’s entire revenue in 2019 was set at $15 billion. However, it is predicted to grow further by 2025, with sales exceeding $68 billion. This tremendous growth reflects the significantly growing requirement for qualified data analysts, making 2023 an ideal period to begin a profession as a data analyst.

Once you begin your journey to become a data analyst, remember that your success is a testimonial to your effort and the growing relevance of information in everyday life.

So, let’s proceed with this fascinating journey towards a data-driven future where your ability to analyse can make a huge difference.

Unveiling Mysteries: A Thorough Guide to Pursuing a Data Analyst Career

Isn’t it impressive how information capacity can empower decision making and tackle complex questions? In our tech-driven world, the role of a data analyst has never been more vital, with so many tech transformations taking place globally.

These unsung professionals operate behind the scenes across myriads of fields like healthcare, marketing, finance, advertising, and sports, effectively transforming raw data into actionable insights.

If you wish to become a data analyst, then here is a step-by-step guide you can go through to navigate this path.

  1. Understanding the Role

A data analyst is a professional who obtains, analyses, cleans and evaluates data to help businesses make decisions based on compiled datasets. Their significance spans several areas, including telecommuting, medical care, financial services, and innovation.

A data analyst’s primary tasks include the following:

  • Data collection and organisation from multiple sources
  • Data cleaning and preparation for analysis
  • Using analytical methods and tools to analyse data
  • Identifying data trends, patterns, and oddities
  • Creating visual representations of discoveries
  • Providing stakeholders with ideas and suggestions

    2. Develop Essential Skills

To be a successful data analyst, you must master a variety of technical and soft skills. The following are the important abilities you should concentrate on:

  • Data Processing and Cleaning: Discover how to clean, preprocess, and modify data before analysing it. This includes coping with values that are unavailable, anomalies, and inconsistencies in data.
  • Data Visualisation: Use tools such as Matplotlib, Python, or ggplot2 (R) to produce relevant and useful graphical and visual representations of information.
  • Statistical Analysis: Gain skills in analysing data using statistical methods such as testing hypotheses, regression evaluation, and statistical analysis.
  • Machine Learning Fundamentals: Learn the fundamentals of machine learning to deploy prediction and classification methods.
  • Structured Thinking and Solving Challenges: Develop excellent analytical and critical thinking abilities to approach complicated challenges and obtain practical insights from data.

3. Gain Practical Experience

To demonstrate your abilities, work on individual or cooperative data analysis projects. Make a portfolio demonstrating your ability to work with practical data and deliver insights. Look for internships or entry-level jobs that enable you to use your talents professionally. These opportunities provide substantial exposure and connection.

4. Constructing Your Portfolio

Once you’ve developed your data abilities, the next thing to do is to put it to use by compiling a portfolio of data tasks. These initiatives will show prospective employers your experience and skill in dealing with current data challenges.

Here are some pointers for developing a convincing data analytics portfolio:

  • Select projects that correspond to your interests and professional objectives.
  • Concentrate on projects that show a wide range of data abilities and methodologies.
  • Document your project’s procedure, including problems encountered, solutions executed, and learnings acquired.

5. Engaging in Networking and Becoming Part of Data Science Communities

Attending online data science communities can assist you in building a network, acquiring knowledge from qualified experts, and demonstrating your abilities through challenges and collaborative endeavours.

Engage in data analytics meetings, conferences, and seminars to remain up to date on the latest developments and connect with like-minded people.

6. Preparing for Job Interviews

It is essential to prepare for job interviews while applying for data analyst roles by:

  • Practising answers to common data analytics interview questions
  • Refreshing your technical knowledge and notions
  • Exercising problem-solving and coding skills

Keeping updated with the latest data analysis technology and tools and constantly strengthening your abilities through practice assignments and practical expertise are essential for success. By doing so, you can construct a strong portfolio of work and establish yourself as an extremely skilled and desired data specialist.

Final Words

Data analytics will be more than just a profession post 2023. The big data analytics sector is expanding and qualified data analysts are in demand.

We hope that through this article, you’ve learned about the profession of a data analyst, how to become one, the required skills, enrolling in a data analytics course, the importance of practical knowledge, and the need to establish a strong portfolio.

In case we have triggered your search for the right data analytics course, check out the postgraduate programme in data science and analytics from Imarticus. This programme provides hands-on learning and practical insights into how analytics and data science affect real-world enterprises. 

AI for Data Analytics and Data Visualisation

AI has emerged as an innovative force in the disciplines of data analytics and data visualisation. This cutting-edge technology, distinguished by its ability to duplicate human cognitive functions transforms how businesses extract insights and display data.

AI in data analytics analyses massive amounts of data rapidly. It excels in detecting patterns, trends, and anomalies, allowing data scientists to make data-driven decisions with unrivalled precision.

AI-driven developments, on the other hand, enhance data visualisation. AI-powered technologies can generate dynamic and interactive visual representations of big datasets automatically. These technologies not only improve the visual appeal but also discover hidden insights by dynamically adapting to changing data.

AI is an invaluable catalyst in the transformation of data analytics and data visualisation, moving organisations towards improved efficiency, informed decision-making, and competitive advantage. If you are looking for AI ML training, keep reading to learn about various tools for data analytics and data visualisation.

AI for Data Analytics

Artificial intelligence algorithms excel in data processing and analysis with machine learning and deep learning. They can filter through enormous amounts of structured and unstructured data in the blink of an eye, discovering patterns, correlations, and outliers. This capacity enables data analysts to extract actionable insights and make educated decisions with previously unheard-of precision.

One of AI’s primary capabilities in data analytics is its capacity to adapt and learn spontaneously. AI models can improve themselves over time, honing their analytical skills as they encounter new data. In quickly changing situations, this agility guarantees that data-driven insights stay accurate and up to date.

The use of AI in data analytics improves productivity, accuracy, and the capacity to derive meaningful insights from data. In an increasingly data-centric world, it enables organisations to make data-driven decisions that promote development and competitiveness.

AI for Data Visualisations

By automating the development and modification of visualisations, AI algorithms have opened up fresh possibilities in data representation. Based on the underlying data, they may choose the best chart kinds, colour schemes, and layouts, improving the accessibility and comprehension of complicated information. This automation speeds up the visualisation production process while also ensuring consistency across different datasets.

AI also enhances data visualisation interaction, allowing users to explore deeper data sets and find nuanced patterns and insights. Users may question visualisations in plain English using Natural English Processing (NLP), converting static charts into responsive tools for real-time exploration.

AI transformed data visualisations from static to dynamic, predictive, and highly adaptable tools. In an increasingly data-driven world, the synergy between AI and data visualisations has propelled organisations towards improved data interpretation, decision-making, and competitive advantage.

Best AIs for Data Analytics and Visualisation

AI has given data analytics and visualisation new ways to optimise automation. They are:

1. RapidMiner

RapidMiner is a data science platform well-known for its flexibility. It enables users to easily do complex analytics, machine learning, and data preparation activities. RapidMiner helps organisations extract useful insights from their data with a user-friendly interface and a wide variety of data integration options, enabling data-driven decision-making and innovation.

2. Tableau

Tableau is a well-known data visualisation and business intelligence application. It enables businesses to turn complicated data into interactive, visually appealing dashboards and reports. Users easily analyse data using Tableau, obtaining actionable insights as a tool for informed decision-making. Its user-friendly design and powerful analytical capabilities make it a must-have for professionals in the business environment.

3. Polymer

Polymer is a potent AI tool that transforms data into a simplified, adaptable, and powerful database. Polymer, like other outstanding AI tools, does not require any code. The programme uses AI to analyse data and improve users’ comprehension of it. Polymer does all of this without requiring a lengthy onboarding procedure. All a user needs to do is submit their spreadsheet to the platform, which quickly converts it into a streamlined database that can then be analysed for insights.

4. DataRobot

DataRobot is a well-known automated machine learning platform enabling businesses to accelerate and simplify their data science activities. It uses complex algorithms to automate model construction, allowing users to quickly design and deploy machine learning models. With its simple user interface enables data professionals to leverage the potential of artificial intelligence for predictive analytics and data-driven decision-making.

5. Power BI

Developed by Microsoft, Power BI is a business intelligence and data visualisation software that enables users to connect through vivid data sources. It converts raw data into actionable insights and builds interactive reports. It is preferably used in businesses for analysing data and decision-making.

6. Talend

Talend, a prominent data integration and management software provider, offers complete data solutions to businesses. It allows for the seamless integration, transformation, and analysis of data across several platforms. Talend’s user-friendly interface and strong capabilities enable organisations to realise the full value of their data, enabling informed decision-making and operational efficiency.

7. IBM Watson Analytics

IBM Watson Analytics is a robust platform for data analysis and visualisation. It provides effective analytics tools enabling users to analyse data and make data-driven choices. Watson Analytics simplifies complicated data analysis to maximise the value of their data.

8. PyTorch

PyTorch is a deep-learning framework for machine-learning applications. It provides a flexible and dynamic computational graph, allowing for the efficient creation of neural networks. PyTorch is preferred for AI and deep learning applications among researchers and practitioners owing to its user-friendly interface, solid GPU acceleration support, and large community contributions.

9. KNIME

KNIME is a data analytics and machine learning platform, that enables organisations to handle, analyse, and visualise data more effectively. It helps data professionals build data workflows for a wide range of applications, making it an essential instrument for data-driven decision-making and advanced analytics.

10. Google Cloud AutoML

Google Cloud AutoML is a machine learning product that allows businesses to easily design and deploy unique machine learning models. It simplifies the ML model construction process, allowing users to easily leverage the endless possibilities of AI for a variety of applications ranging from image recognition to natural language processing.

Conclusion

By automating data processing, discovering insights, and dynamically constructing interactive visual representations, AI improves data analytics and data visualisation. It enables professionals to make data-driven decisions more effectively and identify hidden trends, revolutionising how businesses extract value from their data.

If you are looking for AI learning courses, check out Imarticus Learning’s Executive Programme in AI for Business.

This AI for executives course would upscale your skills in AI and machine learning, and would also help you become an influential business leader.

To know more, check out the website right away: https://imarticus.org/

How To Become A Data Analyst With A Job Assistance Program

How To Become A Data Analyst With A Job Assistance Program

A career in data analysis is developing into a boom since most companies today rely heavily on it. Be it for marketing strategies or other problem areas of the business, every organization can use a good data analyst. Therefore, the market is a thriving one. 

Remember that companies look for people who they can rely on, and thus you must have credible qualifications and degrees. The best way to look for a data analyst job opportunities is to take up a data analytics certification course 

What is Data Analytics? 

Data analytics is the process of extracting useful information from a body of unintelligible raw data. This processed data is then used to make decisions and solve problems an organization might face. The large body of data helps analysts draw theories that can later be worked upon. It helps several departments and gives the owners and the stakeholders the idea about their business. 

The use of data is done differently by different industries. A bank or a financial institution might use it to better customer relations, whereas a medical facility may use its data to predict future needs. Likewise, different fields sieve out important information. Then they work on the data that will help them understand their priorities the best. 

Every company today is reliant on data, and thus they keep looking for the best analysts. Data analysts are becoming more and more indispensable for businesses today. Being a data analyst will help your career grow upwards. 

Why Take a Data Analytics Course?

Data analytics is the future, and it has made its impression in the present as well. Having skills in this field will help your career go a long way. With every industry becoming reliant on data analytics, job opportunities are expanding. However, to get job opportunities in a prestigious company, one must have the required skills. So here are some reasons why you should learn data analytics and how it will help your career. 

Job Opportunity 

Job opportunity is the first and foremost reason to enrol in a data analytics program. Several students today are focusing on data analytics and looking towards making a career in the same. Immense job opportunities in data analytics are encouraging students to give up their focus on mundane jobs and try something they would enjoy themselves. 

Industries are beginning to admit and accept the value of data analysts and thus throwing open positions that can be great catches for students who have acquired skills in data analytics. Every industry is constructively using its data, and thus the landscape is growing more vast with each passing day. 

Develops Problem Solving Skills 

Problem-solving skills are not just important for the job of data analytics but can also help in several other fields and even in your personal life. And analytics is particularly about problem-solving. Developing the skill to think and analyze is an important one, and data analytics helps you do just the same. 

Increasing Importance 

The analytics boom is taking over the world, and it is the time when its importance is at its peak. So we can expect newer fields to crop up pertaining to data analytics. If you learn data analytics well enough, you are simply bracing yourself for a future that will probably be highly reliant on analytics. 

How to Find a Job Interview Guarantee Program 

There are several data analytics programs in the market. Some of them are online, while others are offline courses. But getting a good course is not enough.

Follow these tips to land a course 

  • Look for a course that offers a good program and covers all the major important areas. 
  • The course should not be less than three months as it is the minimum time required to learn the basics of data analytics. 
  •  Look for industry experts and IIT faculties on the team. 
  • Lastly, make sure the course is tied up with big companies as it increases its credibility substantially. 

Conclusion 

Data analytics is the future of every industry and might emerge as the biggest industry shortly. Taking a course in this field will not only help you get job opportunities but will broaden your horizon of data, which can be extremely helpful to your career.