From Numbers to Strategy- Steps to Become a Financial Analyst Who Stands Out

Have you ever looked at a business headline and wondered who understands these numbers and makes sense of them? Chances are, a skilled financial analyst does. But the truth is, not every analyst is similar. 

If you want to build a financial analyst career path that doesn’t just pay the bills but sets you apart, you require more than spreadsheets and ratios. You need sharp skills, the right mindset, and a method that puts you ahead of the pack.

In this guide, we’ll explain how to become a financial analyst who doesn’t get lost in the crowd, from learning core ideas to earning top-notch finance certifications for analysts, sharpening your investment analysis training, and growing your financial modelling skills.

How to Become a Financial Analyst?

Before you plan your future, know what you desire to become.

A financial analyst is more than just a number cruncher. They are financial advisors who look at financial figures, analyse investments, and make wise money moves to enable businesses and clients to achieve their dreams.

Analysts can become corporate finance analysts, investors’ banking analysts, equity researchers, risk managers, or portfolio managers. Whatever they do, they transform raw data into visual, realistic methods of creating growth and reducing risk.

It’s not just about being good with spreadsheets; it’s about becoming the analyst your company or clients trust when the stakes are high.

Why Do Financial Analysts Matter?

Nowadays, businesses rely on more than intuition. Their judgments, budgets, predictions, valuations, and astute investments are all supported by data. 

Here’s where you can help. Businesses of all sizes use analysts to identify risks, analyse trends, and direct initiatives that keep the company running. 85 percent of Indian graduates choose industry certifications to secure better jobs and earn higher income, according to the CFA Institute Graduate Outlook Survey 2025.

The problem is that while demand is rising, so is competition. 

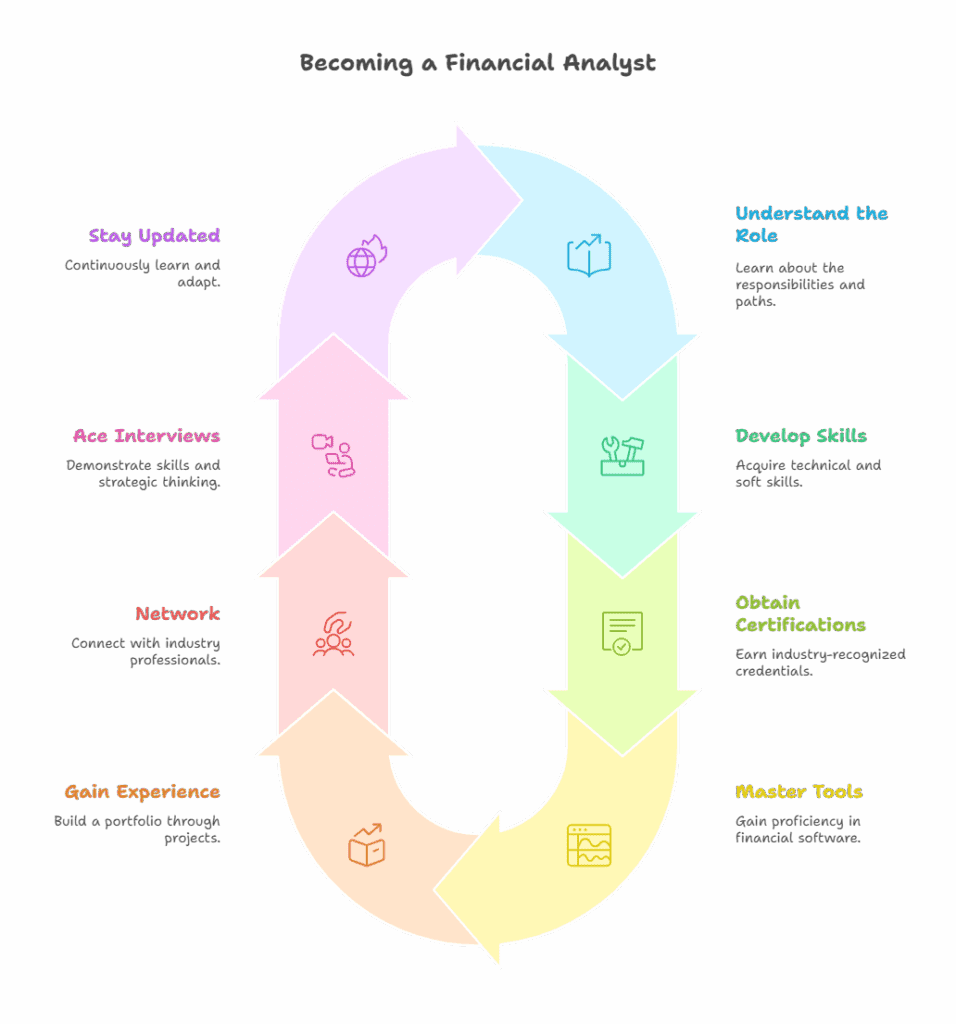
Step 1: What Does a Financial Analyst Do?

Know the job before applying for it. Upon analysis of financial information, a financial analyst comes up with useful information. This may involve the evaluation of quarterly reports, the development of profit forecasts, the observation of market trends, or the provision of investment guidance.

  • Corporate finance (within corporations, to regulate budgets and development strategies)
  • Deals, mergers, acquisitions (investment banking)
  • Equity research (research of stocks and sectors for investors)
  • Risk management (evaluating financial risks and protection of capital)

Being aware of such paths enables you to decide according to your interests and abilities.

Step 2: Find out the Requisite Skills of Financial Analysts

So what do the employers desire? Additional attributes ushered in by the best analysts include a combination of hard & soft skills and technical expertise. 

This is what you will have to construct:

  • Analytical and Critical thinking

It is not all about calculation; it is about looking at what the numbers tell you. Can you see patterns and draw lines that other people fail to see?

  • Communication & Storytelling

The most skilled analysts can present a narrative of complicated data to top management, investors, or customers. Knowledge becomes valueless unless someone can clearly account for their findings.

  • Soft Skills

An analyst who can remain flexible stays relevant. Want to know how to become a financial analyst who stands out? Combine all these skills with real-world experience.

Step 3: Top Certifications for Analysts

Here’s a quick look at some famous finance certifications for analysts to help you pick:

CertificationFocus AreaGlobal RecognitionBest For Duration
CFAInvestment Analysis & Portfolio ManagementVery High Aspiring Equity AnalystsPortfolio Managers2-3 Years
FRMRisk ManagementHighRisk Analysts, Credit Risk, Market Risk1-2 Years
CPAAccounting & AuditingVery HighAccounting & Finance Professionals18 Months – 2 Years
CFIFinancial ModellingModerateEntry-Level Analysts, Corporate Finance Roles6 Months – 1 Year

Step 4: Get Practical: Learn Financial Modelling Skills and Tools

Theory is good, practice is better. Companies want you to hit the ground running. 

So, master these tools early:

  • Excel: The rigor of any analyst. Complex functions, pivot tables, and macros.
  • Power BI / Tableau: You want your report to be legible and compelling based on data visualisation.
  • Bloomberg Terminal: The go-to of investment analysts, who often swear by it to access real-time financial information.
  • Python/R: If you desire an advantage in quantitative positions or big-data finance.

As one can see, investment analysis training modules at Imarticus Learning match these tools with real-life case studies, so you learn through action, not mere window shopping of slide tutorials.

For example, Imarticus Learning’s investment analysis training modules pair these tools with real case studies so you understand by doing, not just watching slides.

Step 5: Gain Real-World Experience

This is where many candidates stall. So, how do you become a financial analyst with no full-time role yet? Internships, part-time analyst roles, or freelance projects build your portfolio and confidence.

Offer to help a startup budget for growth. Build a stock pitch and present it to your network. Volunteer for research work. Each small step makes your resume stronger and shows you’re proactive.

Step 6: Network Like It’s a Skill

You have the skills needed for financial analysts and have obtained your finance certifications, but that is insufficient. Develop a network that makes you visible and informed.

Get acquainted with industry events, meetings of the CFA societies, webinars, and alumni events. Establish a connection with mentors who can track you on the correct path in terms of a career path as a financial analyst. Many analyst roles aren’t even advertised; they’re filled through recommendations.

Step 7: Ace the Interview and Prove You’re Different

Your CV gets you in the door. But your interview shows whether you will stay there.

  • Expect technical questions. You should prepare to demonstrate your financial modelling skills, debate on valuation techniques, or critique a company’s financials.
  • Model thinking: Describe how you are going to go about your plan. Clarity matters more than speed.
  • Be curious. Ask smart questions about the company’s strategy to prove you’re more than a number cruncher; you’re a strategist.

Step 8: Stay Sharp: Finance Never Stops Evolving

The top analysts consider learning a continuous project. Market trends change, new technology alters data gathering, and laws vary.

Take shorter courses such as investing analysis training or high-level computer tool training in Excel. Subscribe to financial news, read market reports, and practice building your models for fun.

How to become a financial analyst

How Imarticus Learning Can Help You Stand Out

If you want the roadmap built, the Financial Analysis Prodegree by Imarticus Learning is one of India’s top industry-recognised programmes. It blends theory with hands-on tools to sharpen your financial modelling skills and investment analysis training, all designed with KPMG in India.

What you get:

  • 180+ hours of training
  • Real-world projects guided by industry experts
  • A clear path to top finance certifications for analysts
  • Placement support to launch your career faster

Watch this video to learn about the tremendous collaboration between imarticus learning and KPMG

FAQ

Q. What is the job of a financial analyst like?

Most begin as junior or associate analysts and transfer to senior positions or become equity research analysts, corporate strategists, or portfolio managers.

Q. What does a financial analyst need?

High Excel, data analytics, financial model, clear thinking, and good communication capabilities.

Q. What are the best finance qualifications for analysts?

The most well-known throughout the world is the CFA; however, the FRM and FMVA specialisations are awesome as well.

Q. What is the best way to develop financial modelling skills?

Do practical courses, work with real data from a company, and be a learner and not only an observer.

Q. What is the motivation behind the training in investment analysis?

It teaches you to evaluate assets, industry, and market trends, something you will utilise every day in making good suggestions.

Q. How does one begin a career as a financial analyst?

Begin with the courses that are both theoretical and practical, and accumulate a small portfolio of projects.

The Final Words

Numbers are your tool, but approach is your superpower. The analysts who lead tomorrow’s companies don’t just report what happened. They see what’s next and help steer the business in the right direction.

So, polish your financial modelling skills, complete solid investment analysis training, earn respected finance certifications for analysts, and sharpen the skills needed for financial analysts that no spreadsheet can teach.

That’s how to become a financial analyst who doesn’t just get hired but gets noticed.

Corporate Finance Course Guide: Top Courses for Financial Executives

In corporations it is everything about being able to make financial choices, and it’s those who understand how to make sound financial choices that are most sought after. You can become knowledgeable about how to make sound financial choices with a corporate finance course if your ambition is to be an investment banker, financial analyst, or CFO.

This is a comprehensive overview of corporate finance business school courses, including the Financial Analysis Prodegree in Cooperation with KPMG, just to mention but a few of the most in-demand finance courses in order to equip future professionals to make a sound choice.

What is Corporate Finance?

Corporate finance is the pillar of financial decision-making of an organisation. It includes:

  • Long-term sustainable business financial planning
  • Investment choice for the greatest return
  • Risk management to prevent capital loss
  • Capital structuring for maximum debt and equity financing

Corporate finance experts who are investment banking, consulting, business management, and financial services professionals should have knowledge of corporate finance.

Why Take a Corporate Finance Course

A certification in corporate finance is not only a credential but also a career enhancer. Here’s why:

  • Wins You A Career: Certification makes you a stronger candidate for hiring by businesses in the present era of globalization.
  • Builds Financial Skills: Develop valuation, financial modeling, and risk management skills—crucial to becoming a finance careerist.
  • Creates High-Income Opportunities: Finance professional jobs are highly paying with growth potential.
  • Improves Decision-Making Skills: Being an entrepreneur or a finance expert, good finance-related decision-making is critical.
  • Bridges the Skills Gap: Formal corporate finance training is favored by most organisations, and a systematic course bridges this gap.

Best Corporate Finance Courses & Certifications

It is not a simple task to choose the best corporate finance course with so many of them around. Here are the best advanced corporate finance courses to choose from:

1. Financial Analysis Prodegree in Association with KPMG

Suitable for: Aspiring finance professionals seeking an employment-focused program

KPMG Financial Analysis Prodegree is the new and the best corporate finance course in existence today. KPMG, creating it collaboratively with other sources, provides the student course material which is professionally configured with an exact pairing in regard to finance and financial analysis as well as corporate finance.

Features:

  • KPMG Experts Masterclasses – Specialists in their field.
  • Live Financial Modelling and Valuation Training – Genuine models actually utilized by investment banks.
  • Hand-drawn Live Case Studies – Finance issues, virtually solved.
  • Live Online Training – Interactive learning by expert faculty.
  • Industry-Recognised Certification – Get a globally recognised certification issued by top organisations.

Duration: 4 months (Weekend batches)

Mode: Live Online

Enrol in the course.

2. Executive Finance Programme – Oxford Business School

Suitable for: Senior business executives and finance directors

This course is tailored for graduate investment bankers, capital market professionals, and corporate restructuring professional executives.

  • Oxford faculty lectures
  •  Industry-specific learning
  • Financial professional networking

Duration: Varied

Mode: On-campus & Online

3. Corporate Finance Basics – Corporate Finance Institute (CFI)

Most suitable for: Beginner who is interested in self-study

  • Freedom of e-learning
  • Live real-life case studies
  • Certificate of achievement

Duration: Varied

Mode: Online

4. Leadership with Finance – Harvard Business School Online

Best suited for: Mid-career manager wishing to acquire financial decision-making capabilities

  • Interactive, case-study learning
  • Implementation capstone project
  • Harvard Business School Online certification

Duration: 6 weeks (6-7 hours a week)

Mode: Online

Comparison Table of Top Corporate Finance Courses

Course NameInstitutionDurationModeKey FeaturesCertification
Financial Analysis Prodegree in Collaboration with KPMGImarticus Learning4 months (weekends)Live OnlineKPMG Masterclasses, Financial Modelling, Case StudiesYes
Executive Finance ProgrammeOxford Saïd Business SchoolVariesOnline & On-campusAdvanced Investment Banking, Strategy FocusYes
Corporate Finance FundamentalsCFISelf-pacedOnlineFlexible Learning, Valuation, Risk ManagementYes
Leading with FinanceHarvard Business School Online6 weeksOnlineInteractive Learning, Capstone ProjectYes

Frequently Asked Questions on Corporate Finance Courses

1. What is the Financial Analysis Prodegree in Association with KPMG?

A professional corporate finance course to develop skills in financial analysis, valuation, and financial modeling.

2. Who can enroll in a corporate finance course?

Finance professionals, investment bankers, management consultants, and business managers to skill up or career change towards a finance profession.

3. What corporate finance certification is most worthwhile?

Most industry-accepted and course content-wise best course to make a student job-ready is the Financial Analysis Prodegree with KPMG tie-up.

4. How many months would it take to be a corporate finance course student?

Course length differs. The KPMG Financial Analysis Prodegree is 4 months, while other online courses could be weeks or months long.

5. Are online courses in corporate finance effective?

Yes. Imarticus, CFI, and Harvard provide engaging and industry-neutral online courses.

6. Can I obtain investment banking positions with a course in corporate finance?

Yes, Oxford, Harvard, or KPMG certification is an inspiration to the career of professional corporate finance, private equity, and investment bank professionals.

7. What do I know how to do after a corporate finance course?

You acquire skills in company valuation, financial modeling, risk management, and strategic financial decisions.

8. Is corporate finance applicable to entrepreneurs?

Yes. Corporate finance learning maximizes business investments and money planning.

9. Can corporate finance be pursued in a day job?

Yes. Weekend batches can be attended by working professionals for the majority of courses, like the Financial Analysis Prodegree in Association with KPMG.

10. What is a continuation career job for the course in corporate finance?

The alumni career could be Financial Analyst, Investment Banker, CFO, Risk Manager, or Corporate Treasurer.

Conclusion

A corporate finance course is a good tool for working professionals to take their career to the next level in the finance field. Financial Analysis Prodegree in association with KPMG is one of the best industry-relevant career-oriented courses.

Key Takeaways:

  • Corporate finance courses are very good for career development and finance problems.
  • Financial Analysis Prodegree with KPMG is one of the best career-oriented courses.
  • Your career goals and study method rely on choosing a great corporate finance course.

Want to advance your financial career? Join the Financial Analysis Prodegree with KPMG today and boost your finance career!

Understanding the Shareholders Agreement: Key Elements and Clauses Explained

A shareholders agreement is a critical legal document that defines the relationship between a company’s shareholders. It’s an essential tool for maintaining clarity, preventing conflicts, and ensuring the smooth running of a business. 

Whether you’re a new shareholder or an experienced financial analyst, it’s crucial to understand how a shareholders’ agreement safeguards minority shareholders’ interests.

In this post, we’ll break down the core elements of a shareholders agreement, explain what is a shareholders agreement, and provide examples of different shareholders agreement formats to give you a thorough understanding.

What is a Shareholders Agreement?

A shareholders’ agreement (SHA), a stockholders’ agreement in the U.S., is a binding contract among a company’s shareholders. Similar to a partnership agreement, it outlines shareholder rights and responsibilities and protects them in case of disputes. 

Example of a Shareholders Agreement for Startups

When entrepreneurs launch a startup, drafting a shareholders agreement is essential to clarify the intentions of all parties. The agreement can help resolve disputes as the business evolves by providing a reference point. 

Key sections for startup agreements often include:

  • Identifying shareholders and rationale for the agreement.
  • Guidelines on who can own shares and the process for buy-back.
  • Rights of first refusal for the company to purchase shares.
  • Methods for determining share value (e.g., annual recalculations or formulas).
  • Eligibility for board membership.
  • Including these clauses ensures clarity and reduces future conflicts.

What are the key clauses in a shareholder’s agreement?

Understanding the key elements of a shareholders agreement is essential. Each section has a specific function that safeguards the company and its shareholders. These are the most common elements:

ElementDescription
Ownership StructureDefines the proportion of shares each shareholder owns.
Voting RightsThe agreement defines how shareholders make decisions and outlines each shareholder’s voting power.
Profit DistributionOutlines how profits get shared among shareholders, often based on their percentage of ownership.
Transfer of SharesProvides guidelines on how shares can transferred or sold.
Exit StrategyDetails the process for shareholders who wish to leave or sell their shares
Dispute ResolutionOffers a mechanism for resolving disagreements between shareholders.
Non-Compete ClausePrevents shareholders from engaging in businesses that compete with the company.

This comprehensive format provides transparency and prevents future disputes. The shareholders agreement format may vary depending on the size of the company, the number of shareholders, and the business structure.

Key Clauses in a Shareholder Agreement

To better understand the main clauses in equity agreement, here’s a breakdown:

ClauseDescriptionBenefit
Tag Along Rights
Rights Minority shareholders can sell shares on the same terms as a majority.
Protects minorities from unfamiliar partners
Pre-emptive Rights
Shareholders have the first option to buy new or sold shares.
Prevents unwanted dilution of ownership
Drag Along RightsMajority shareholders can easily force minority shareholders to sell shares.Ensures full sale to third-party buyers
  • Good Leaver/Bad Leaver Clauses

Defines how you treat shares based on whether the shareholder leaves on good or bad terms (e.g., due to misconduct or retirement).

  • Non-competition Clause

Restricts shareholders from engaging in competitive activities during and after their association with the company.

  • Deadlock Resolution Clause

Provides mechanisms to resolve deadlocks in decision-making, especially in 50:50 partnerships or cases requiring supermajority approval.

Types of Shareholders Agreements

There is no one-size-fits-all shareholders agreement format. Corporate governance and shareholders agreements can vary significantly depending on the company’s size, type, and relationship with the shareholders. 

However, most agreements follow one of these two general structures:

  • General Shareholders Agreement: Covers basic terms and conditions, such as voting rights and profit sharing.
  • Customised Agreement: Tailored to specific business needs, particularly in unique industries or businesses with specialised shareholder requirements.

Why Does Every Company Need a Shareholders Agreement?

Whether you’re starting a new business or scaling an existing one, a stockholder agreement is crucial for several reasons:

  • Corporate Governance:

Shareholder control varies based on their business involvement. Active shareholders may prefer unanimous decision-making for key matters, while passive investors focus on veto rights for significant events like share issuance or asset sales.

  • Share Transfer Rights:

Share transfer restrictions prevent unexpected parties from joining a company. Rights like First Refusal and First Offer prioritise existing shareholders purchasing shares.

  • Anticipating Future Events:

A shareholders agreement should account for potential future events, including involuntary share transfers (e.g., death), and provide exit mechanisms for shareholders.

  • Dispute Resolution:

Shareholder disagreements are inevitable; the agreement should include a dispute resolution process. Early discussions allow shareholders to align on plans and resolve conflicts effectively.

Financial analysts often assess a company’s shareholders’ agreement to understand the potential risks and governance structure. A shareholders agreement format can significantly influence the company’s perceived stability.

The Final Words: Elevate Your Financial Analysis Skills with Imarticus Learning

Understanding the shareholder’s agreement is key to ensuring smooth corporate governance and protecting shareholder rights. Whether you’re a shareholder, company founder, or financial analyst, being familiar with a shareholder agreement’s essential elements and clauses is crucial.

Enrol in the Financial Analysis Prodegree by Imarticus Learning, created in collaboration with KPMG in India. This 120-hour programme equips you with essential financial skills through a robust curriculum, real-world projects, and hands-on training led by industry professionals. 

  • Masterclasses from KPMG experts
  • Gain job-relevant skills
  • Industry-focused training

Start your journey towards becoming a financial expert with Imarticus Learning!

Understanding Accounting Conventions: A Comprehensive Guide for Beginners

Accounting may be thought of as a world full of terms and regulations that are difficult to understand, but in reality, with a proper background, everyone can understand the basics of this field. 

Accounting conventions are one of these concepts that are necessary for newcomers. In addition, these are informal regulations that set the tone for disclosing sensitive information. Introduction to these conventions is important, regardless of whether you are new to accounting or looking to build further on your existing foundational knowledge. 

In this guide, you will learn about accounting conventions, how they define financial reporting, and why they are essential for you as an individual or a company. 

What Are Accounting Conventions?

Accounting conventions are rules followed by accountants to make sure that all the reports necessary for financial statement preparation have the same pattern. In contrast to accounting standards that have the force of law, conventions are general practices followed by most organisations in preparing their financial statements. These conventions help explain the business’ financial position clearly and make it easier for stakeholders, investors, and regulators to understand the data presented.

Key Accounting Conventions:

  1. Conservatism: This is all about being cautious. Under this convention, accountants tend to report potential losses but avoid reporting potential gains until they are certain.
  2. Consistency: Once a business adopts a particular accounting method, it should stick to it for all subsequent periods unless a change is essential.
  3. Full Disclosure: All financial statements should include all necessary information that might affect the understanding of an organisation’s financial position.
  4. Materiality: Only information that could influence decision-making is included in the financial reports, while immaterial details may be left out.
  5. Going Concern: The assumption is that a business will continue its operations into the foreseeable future unless concrete evidence suggests otherwise.

Why Are Accounting Conventions Important?

Accounting conventions are the rules of practice that are used when accounting for and reporting business transactions.

These conventions exist to introduce standard and measurability in financial reports. Lacking them, financial reporting would be done in different formats, enabling stakeholders to contrast a company’s financial state with another.

For a beginner, it can also make financial management less mysterious and provide them with the tools to handle or analyse their accounts. From banking and investment to ordinary personal finance management, it is beyond doubt that understanding the fundamentals of accounting, including these conventions, affords power.

The Role of Accounting Conventions in Financial Reporting

Accounting conventions affect how financial statements are produced and presented. By using these conventions, firms reveal information about their financial position, which makes stakeholders trust them. 

For instance, the Conservatism convention ensures that the business does not report exaggerated profits and gives a good picture of the company. On the other hand, the Full Disclosure Convention provides that all necessary information is released so that users can make a reasonable decision.

How to Master Accounting Basics and Conventions?

Here are some ways to master accounting basics and conventions:

  1. Understand the Theory: Understand what accounting conventions are, their classifications and their usage in various situations.
  2. Study Financial Statements: Refer to real-life examples and see how these accounting conventions are used.
  3. Pursue Further Learning: Although basic accounting is not exhaustive, you may need to take a financial management course to learn more accounting principles and practices to appreciate financial reporting fully.

Conclusion

Accounting conventions are critical for anyone who wishes to learn about accounting and whoever is conducting any accounting process. These conventions introduce well-defined patterns and reliability in preparing business accounts, presenting the health of finances. 

For those looking to deepen their expertise, Imarticus Learning offers Financial Analysis Prodegree (FAP), which provides an in-depth understanding of financial principles and tools used by top industry professionals. 

Understanding the Core Objectives of Forecasting in Business Strategy

In today’s dynamic business environment, it is essential for organisations to make the right predictions for future trends to stay viable and succeed. The objectives of forecasting in business depend on how you are developing an informed evaluation of future events and situations. With business forecasting, you can make accurate predictions for future trends by examining current and historical data. Basically, forecasting is a type of tool that aids companies in making well-informed business decisions about their forthcoming. So, let’s understand the core objectives of forecasting in business.

What is Business Forecasting?

Business forecasting contains the tools and techniques that are used in predicting the developments in business, such as expenses, sales, profits and losses. The main objective of forecasting in business is to establish improved strategies on the basis of these informed future predictions, helping to remove possible losses before they occur. Through quantitative or qualitative models, historical data is collected and examined to identify the problems. 

Types of Forecasting in Business

Generally, there are two types of models that are used for forecasting in business, which include:

  • Quantitative Models: Quantitative is a long-term method of forecasting in business that is examined with assessable data such as statistics and historical data. Previous performance is used to detect trends or rates of change. Through this approach, organisations can predict if variables like sales, housing values and gross domestic product, will be for a long period. Quantitative models include:
  • Econometric Modelling: This is a mathematical model that uses multiple regression equations to test the internal consistency of datasets over time and the importance of the relationship between datasets. This is useful for predicting economic shifts and the possible impact of those shifts on the organisation. Basically, these models are used in sectors, including financial forecasting, pricing strategies and market analysis.
  • Indicator Approach: This approach observes the relationship between certain indicators and makes use of the leading indicator data to evaluate the performance of the lagging indicators. Lagging indicators assess business performance eventually and provide the understanding of business strategies impact on the acquired results.
  • Trend Analysis Method: It is one of the most common methods that uses historical data to predict future trends. Also known as ‘Time Series Analysis’, this forecast method helps organisations get significant views of the future by tracking past data. Also, this is the most affordable method.
  • Qualitative Models: Qualitative is a short-term method of forecasting that depends on industry experts. This method is particularly valuable in forecasting markets for which past data is limited to make statistically appropriate decisions. Qualitative models include:
  • Market Research: With a large number of people, polls and surveys are organised about a specific product or service to predict whether the amount of the consumption will less or rise.
  • Delphi Model: Polling is done by asking a panel of experts for their opinions on specific topics. Their estimations are collected anonymously and made a forecast.

Importance of Forecasting in Business

Forecasting is essential in businesses because it provides the capacity to make well-informed decisions and develop business strategies. Financial and operational forecasting depends on present market situations and estimations of future trends. Historical data is collected and examined to discover patterns that are useful in the prediction of future events and changes.

The core objectives of forecasting in business include – helping forecasters to not only create prediction reports effortlessly, but also understand the predictions better and how to make informed decisions based on these predictions. 

Here are some reasons why forecasting is important in business:

  • It enables businesses to set goals and make strategic plans for the future.
  • It is essential in financial planning that helps organisations evaluate revenues, expenses and profits for the future.
  • It aids organisations in detecting issues, possible risks and doubts, and makes risk management strategies to minimise them.
  • It provides forecasters with beneficial insights and data, which can help them make well-informed decisions.

What is Financial Forecasting?

Financial forecasting helps organisations estimate their financial health for the future by tracking historical data. Additionally, the process should study the main market conditions and past financial trends. The main objectives of financial forecasting include the understanding of future economic performance, enabling organisations to make informed decisions and create strategic plans. 

By examining historical financial data, market trends, and other related factors, financial professionals can create forecasts for crucial financial metrics, such as expenses, revenue, profits and balance sheet items.

For those interested in transforming their career in this field, a financial analyst course can provide a complete industry-approved syllabus, exclusive real-world projects and practical training. 

Conclusion

Forecasting in business is an essential tool that helps make informed decisions about the future of the company. The core objectives of forecasting are to predict the future which can help businesses assign resources and determine the investment allocation, staffing, budgeting, marketing and more. Without forecasting, a business may not be able to regulate itself to the right path of success.

If you are looking to transform your career in the financial sector, then enrol in the Financial Analysis Prodegree in collaboration With KPMG offered by Imarticus Learning. This 4-month long program helps build a career in investment banking and corporate finance. 

The Essential Guide to Common Accounting and Finance Terminology

Accounting and finance is a complex field with its own unique language. Understanding common accounting and finance terminology is essential for anyone working in business or finance.

For instance, by analysing financial ratios, investors, creditors and management can gain valuable insights into a company’s financial health and make informed decisions. It is important to compare a company’s financial ratios to industry benchmarks and historical trends to assess its relative performance.

These basic accounting terms and concepts are essential for understanding financial statements and analysing the financial performance of a company. By understanding the essentials of accounting and finance terminology, you can make informed decisions about your business.

In this comprehensive guide, I will provide you with a clear and concise explanation of all the common financial terms and concepts in accounting and finance. 

Basic Accounting Terminology

Accounting is the process of recording, classifying and summarising financial transactions to provide information for decision-making. It involves the use of various financial statements and terms to represent the financial health and performance of an organisation. Let us explore some basic accounting terminology and common financial terms.

Assets

Assets are resources owned by a company that have economic value. They can be tangible or intangible. Examples of tangible assets include cash, inventory, equipment and property. Intangible assets include patents, trademarks and goodwill. Assets are listed on the balance sheet.

Liabilities

Liabilities are debts or obligations owed by a company. They can be current or long-term. Examples of current liabilities include accounts payable, wages payable and taxes payable. Long-term liabilities include loans, bonds and pensions. Liabilities are listed on the balance sheet.

Equity

Equity is the interest that remains in the assets of a company after the deduction of its liabilities. It represents the net worth of the company. Equity is also known as net worth or owner’s equity. Equity is listed on the balance sheet.

Income Statement

Income statements show a company’s expenses, revenues and net income for a specific period of time. Revenues are the income earned by the company from its operations. Expenses are the costs incurred by the company in generating revenue. Net income is the difference between revenues and expenses. The income statement is also known as the profit and loss statement.

Balance Sheet

The balance sheet shows a company’s assets, liabilities and equity at a specific point in time. It represents the financial position of the company. The balance sheet must always balance, meaning that the total assets must equal the total liabilities plus equity.

Cash Flow Statement

The cash flow statement shows a company’s inflows and outflows of cash during a specific period of time. It is divided into three sections: operating activities, investing activities and financing activities. Operating activities are related to a company’s core business operations. Investing activities are related to the purchase and sale of long-term assets. Financing activities relate to the issuance and repayment of debt and equity.

Financial Ratios

Financial ratios are tools used to analyse a company’s financial performance and assess its financial health. By calculating and interpreting various financial ratios, investors, creditors and management can gain valuable insights into a company’s liquidity, solvency, profitability and efficiency.

Liquidity Ratios

The liquidity ratio measures a company’s ability to meet its short-term obligations. They assess whether a company has sufficient cash or assets that can be easily converted to cash to pay its bills.

  • Current Ratio: The current ratio is calculated by dividing current assets by current liabilities. A higher current ratio indicates that a company has more current assets to cover its current liabilities.
  • Quick Ratio: The quick ratio is calculated by subtracting inventory from current assets and then dividing the result by current liabilities. This ratio provides a more conservative measure of liquidity, as it excludes inventory, which may not be easily converted to cash.  

Solvency Ratios

Solvency ratios measure a company’s ability to meet its long-term obligations. They assess whether a company can survive over the long term and avoid bankruptcy.

  • Debt-to-Equity Ratio: The debt-to-equity ratio is calculated by dividing total liabilities by total equity. A higher debt-to-equity ratio indicates that a company is relying more on debt financing than equity financing.
  • Interest Coverage Ratio: The interest coverage ratios are calculated by the division of the earnings before interest and taxes (EBIT) by the interest expense. A higher interest coverage ratio indicates that a company has more than enough earnings to cover its interest payments.  

Profitability Ratios

Profitability ratios measure a company’s ability to generate profits. They assess the company’s efficiency in using its assets and resources to generate income.

  • Gross Profit Margin: Gross profit margins are calculated by dividing gross profit by net sales. It measures the percentage of sales revenue remaining after the deduction of costs of the sold goods.
  • Net Profit Margin: The net profit margin is calculated by dividing net income by net sales. It measures the percentage of sales revenue remaining after the deduction of all expenses.

Efficiency Ratios

Efficiency ratios measure how well a company is using its assets to generate revenue. They assess the company’s ability to manage its assets and liabilities effectively.

  • Inventory Turnover Ratio: Inventory turnover ratios are calculated by the division of costs of the sold goods by the average inventory. A higher inventory turnover ratio indicates that a company is efficiently managing its inventory and avoiding excessive stockpiling.
  • Accounts Receivable Turnover Ratio: Accounts receivable turnover ratios are calculated by the division of net sales by the average accounts receivable. A higher accounts receivable turnover ratio indicates that a company is collecting its receivables efficiently.  

Financial Analysis Techniques

Financial analysis techniques are essential tools for understanding and evaluating a company’s financial performance and position. By using these techniques, investors, creditors and management can identify trends, assess risks and make informed decisions.

Horizontal Analysis

Horizontal analysis compares financial data from one period to another. It is used to identify changes in financial performance over time. For example, you can compare revenue, expenses and net income from the current year to the previous year to determine if the company is growing or declining.

Vertical Analysis

Vertical analysis expresses financial data as a percentage of a base amount. This technique is used to compare the relative size of different items within a financial statement. For example, you can express all items on the income statement as a percentage of total revenue to see how much each item contributes to the company’s profitability.

Ratio Analysis

Ratio analysis involves calculating and interpreting financial ratios to assess a company’s liquidity, solvency, profitability and efficiency. Financial ratios are typically calculated using data from the income statement and balance sheet.  

Trend Analysis

Trend analysis involves identifying patterns in financial data over time. This technique is used to predict future trends and assess the company’s long-term financial health. By analysing trends, you can identify areas of strength and weakness and make informed decisions about the company’s future.

In addition to these techniques, financial analysts may also use other tools and methods, such as benchmarking, forecasting and sensitivity analysis, to gain a deeper understanding of a company’s financial performance. By combining these techniques, you can make informed decisions about investments, creditworthiness and overall business performance.

Accounting Standards

Accounting standards are a set of rules and guidelines that govern the preparation and presentation of financial statements. These standards ensure that financial information is consistent, comparable and reliable, allowing users to make informed decisions.

Generally Accepted Accounting Principles (GAAP)

GAAP is a set of accounting standards used in the United States. GAAP standards are developed and issued by the Financial Accounting Standards Board (FASB). GAAP provides guidance on how to recognise, measure and report financial transactions and events.

International Financial Reporting Standards (IFRS)

IFRS is a set of accounting standards used in many countries outside of the United States. IFRS standards are developed and issued by the International Accounting Standards Board (IASB). IFRS is designed to provide a common language for financial reporting, making it easier for investors to compare financial statements from different countries.

Convergence of GAAP and IFRS

In recent years, there has been a significant push to converge GAAP and IFRS. The goal of convergence is to create a single set of global accounting standards that can be used by all companies around the world. While progress has been made, there are still some differences between GAAP and IFRS.

Other Accounting Standards

In addition to GAAP and IFRS, there are other accounting standards used in specific regions or industries. For example, the Australian Accounting Standards Board (AASB) issues accounting standards for Australia and the Canadian Accounting Standards Board (AcSB) issues accounting standards for Canada.

Importance of Accounting Standards

Accounting standards play a critical role in ensuring the credibility and reliability of financial information. They provide a framework for consistent and comparable reporting, which is essential for investors, creditors and other stakeholders. By following accounting standards, companies can enhance their reputation, attract investment and facilitate decision-making.

Wrapping Up

Understanding common accounting and finance terminology is essential for anyone involved in business or financial management. By familiarising yourself with these common financial terms and concepts, you can gain a solid foundation in accounting and finance, enabling you to make informed business decisions and contribute effectively to your organisation’s success.

Also, you can communicate more effectively, make informed decisions and analyse financial information with greater confidence. If you wish to learn accounting and finance terminology in detail, you can enrol in a solid financial analyst course. The Financial Analysis Prodegree offered by Imarticus Learning in collaboration with KPMG.

Frequently Asked Questions

What is the difference between assets and liabilities?

Assets are resources owned by a company, while liabilities are debts or obligations owed by a company. Assets and liabilities are two of the most common financial terms.

How is net income calculated?

Net income is calculated by subtracting total expenses from total revenues.

What are the three main sections of the cash flow statement?

The three main sections of the cash flow statement are operating activities, investing activities and financing activities.

What is the purpose of financial ratios?

Financial ratios are used to analyse a company’s financial performance and assess its liquidity, solvency, profitability and efficiency. Financial ratios are crucial components in accounting and finance terminology.

Using Total Addressable Market (TAM) For Identifying the Potential of Products/Services

Let us assume that we are opening a bakery. The entire town (let us say 10,000 people) represents the Total Addressable Market (TAM) for our delicious pastries. That is the total number of people who could potentially buy our croissants.

However, not everyone will be our customers. Some might prefer doughnuts, others might have dietary restrictions and some might just live too far away. This is where the Serviceable Available Market (SAM) comes in. It is the portion of the TAM that you can realistically reach with your offerings.

Finally, within our SAM, there is the Serviceable Obtainable Market (SOM). This is the slice of the pie we can realistically capture. It considers factors like competition, marketing budget, and our ability to convert potential customers into loyal patrons.

Market Sizing with Total Addressable Market

It is extremely crucial to understand the market size as that is the foundation of a business. Knowing the TAM helps a business in these ways:

  • Project revenue potential: A larger Total Addressable Market suggests a bigger potential customer base and higher revenue possibilities.
  • Allocate resources effectively: For example, if the TAM for gluten-free pastries is smaller, you might not invest as heavily in marketing them compared to your classic pastries.
  • Make informed investment decisions: Investors often look at TAM to assess the potential growth of a business.

Limitations of Total Addressable Market

While TAM is valuable, it has limitations. Here is why relying solely on TAM can be misleading:

  • Disruptive Innovations: Let us assume that you have invented a teleportation device. The TAM for traditional transportation (cars, aeroplanes) would not reflect the entirely new market you are creating.
  • Future Focus: TAM is a snapshot of the current market. It might miss out on emerging trends and the potential for future market growth.

Validating the Total Addressable Market

Do not just take the Total Addressable Market number at face value. Here is how to strengthen your TAM analysis:

  • Customer Discovery: Talk to potential customers, understand their needs, and see if your product truly solves a problem for them.
  • Market Research: Analyse existing market trends, competitor strategies, and the overall market landscape to refine your Total Addressable Market estimate.

By combining Total Addressable Market with customer insights and market research, we can paint a more accurate picture of a product’s market potential and set any business up for success.

A Step-by-Step Breakdown of TAM

Here is a breakdown of the Total Addressable Market formula and how to use it effectively:

The core total addressable market calculation is,

TAM = ARPU * Total Potential Customers

In the above total addressable market calculation:

  1. ARPU (Average Revenue Per User): This represents the average amount of revenue generated from a single customer within a specific period (usually monthly or annually).
  2. Total Potential Customers: This signifies the total number of individuals or businesses that could potentially use your product or service.

Example: Let us say you run a fitness app with a monthly subscription fee of $10. If your research suggests there are 1 million people interested in mobile fitness solutions, your TAM would be:

TAM = $10/month * 1,000,000 people = $10,000,000 per month

For niche markets with limited ARPU data, alternative methods exist:

  • Market Penetration Rate: Multiply the total addressable market of a broader category by the estimated percentage your product can capture within that category.
  • Bottom-Up Approach: Identify customer segments within your TAM and estimate ARPU for each segment.

We should always remember that reliable data sources are crucial. Use industry reports, market research, and competitor analysis to support your assumptions when calculating TAM. A well-informed Total Addressable Market estimate is a valuable tool, but not a crystal ball.

TAM: A Multifaceted Tool for Strategic Advantage

TAM’s power extends far beyond simply gauging market size. Here is how it fuels strategic decision-making:

  • Investment Decisions: Venture capitalists use TAM to identify markets with high growth potential. A large TAM with a proven track record of customer spending signals a potentially lucrative space for investment.
  • Product Development: TAM guides product prioritisation. If one feature caters to a larger segment within the TAM compared to another, it might take precedence in development based on its potential revenue stream.
  • Marketing and Sales Strategies: TAM helps define target markets within the overall pool. By segmenting the TAM based on demographics or needs, companies can tailor their marketing messages and allocate resources efficiently to maximise market penetration.

Beyond market sizing, TAM fuels strategies for market dominance within a specific segment. Here is how:

  • TAM Share: This metric represents the percentage of the TAM a company captures. Companies can develop strategies to increase their TAM share, like expanding their product offerings or targeting new customer segments within the existing TAM.
  • Market Opportunity Analysis (MOA): This analysis builds upon TAM by factoring in competition and market dynamics. By understanding competitor strategies and market growth rates, businesses can refine their TAM estimates and identify opportunities for differentiation within the market.

By wielding TAM alongside MOA, companies gain a holistic view of the market landscape and can craft targeted strategies to carve out a dominant position within their chosen TAM segment.

Real-World Examples of Total Addressable Market in Action

Total Addressable Market is not just a theoretical concept. Here is how companies leverage it in the real world:

Success Story, Uber’s TAM Takeover: Initially, Uber focused on the taxi market (limited TAM). Recognising the broader TAM for on-demand transportation, they expanded to ride-sharing, capturing a much larger market share.

Missed Opportunity? Kodak and the Digital Shift: Kodak dominated the film photography market (large TAM). However, they underestimated the TAM for digital photography, leading to their decline.

Disruption and TAM, Airbnb’s Hospitality Revolution: Airbnb disrupted the hotel industry by creating a new market for shared accommodations. Traditional Total Addressable Market calculations would not have captured this entirely new market segment Airbnb unlocked.

TAM and Emerging Tech, The Self-Driving Revolution: The TAM for self-driving cars is difficult to estimate due to the nascent technology. However, understanding the potential impact on transportation, logistics, and urban planning is crucial for companies positioning themselves in this disruptive market.

The above examples showcase the power and limitations of TAM. While it provides valuable insights, staying attuned to disruptive innovations and conducting thorough market research alongside TAM analysis is key to making informed strategic decisions and navigating the ever-evolving market landscape. If you wish to learn financial analysis and other essential concepts such as TAM, you should enrol in a solid financial analyst course.

Beyond TAM

TAM paints a broad picture, but businesses need a sharper focus. Here is how we delve deeper:

Customer Segmentation: A large TAM does not guarantee success. Segmenting the TAM based on demographics (age, income), needs (business vs. personal use), and buying behaviours allows for targeted marketing and product development.

TAM Fragmentation: A large TAM can be deceiving. It might be composed of numerous smaller segments with vastly different needs. For example, the fitness app TAM might include segments interested in weight loss, muscle building, or general health, each requiring tailored features.

Market dynamics are ever-changing. Here is why considering market growth is crucial:

  • Market Growth Rates: A TAM with a high growth rate suggests a more promising market compared to a stagnant one. Understanding growth rates helps businesses prioritise resources and plan for future market expansion.
  • TAM Evolution: The TAM itself can evolve over time. New technologies, regulations, and consumer behaviour can affect the market size. Regularly revisiting TAM estimates ensures businesses adapt their strategies to a changing landscape.

TAM alone does not tell the whole story. Here is why understanding your competitors is key:

  • Competitive Analysis: Knowing your competitors’ market share within the TAM helps assess your own potential for growth. Analysing their strengths and weaknesses can inform your differentiation strategies.
  • Disruption Potential: Emerging technologies or innovative business models can disrupt existing markets, rapidly shrinking or expanding the TAM. Staying informed about potential disruptions helps businesses prepare and adapt.

By considering customer segmentation, market growth, and competitive dynamics alongside TAM, businesses can gain a comprehensive understanding of their market and make informed decisions that lead to long-term success.

Wrapping Up

TAM equips businesses with a powerful tool to assess product/service potential. It provides valuable insights into market size and potential revenue streams. However, the Total Addressable Market is just one piece of the puzzle. Remember, successful market evaluation requires considering customer segmentation, market growth, and the competitive landscape. By wielding TAM alongside these factors, businesses can make strategic decisions that unlock the true potential of their offerings and navigate the ever-evolving market landscape with confidence.

If you want a career in financial analysis, you can enrol in Imarticus Learning’s Financial Analysis Prodegree in Collaboration with KPMG. This is a comprehensive financial analyst course that will teach you everything you need to know about financial analysis.

Frequently Asked Questions

What is total addressable market? What is the difference between TAM, SAM, and SOM?

TAM (Total Addressable Market) is the entire pool of potential customers. SAM (Serviceable Available Market) is the portion of TAM you can realistically reach. SOM (Serviceable Obtainable Market) is the part of SAM you can capture with your resources and strategies.

Is not TAM just a basic market size metric?

Total Addressable Market goes beyond just size. It helps with investment decisions, product development, and marketing strategies by showing the potential revenue a market holds.

Can TAM be misleading?

Yes, for disruptive innovations that create entirely new markets, the Total Addressable Market might underestimate the true potential. It is also a snapshot in time and does not account for future market changes.

How can I improve my TAM analysis?

Segment your TAM based on customer needs. Consider market growth rates and how the TAM itself might evolve. Do not forget to factor in competitor analysis to understand the competitive landscape within your TAM.

Interpreting Insights From Analysis for Data-Driven Business Decisions

Data visualisation is a powerful tool, but it is just the beginning of the data analysis journey. Those flashy charts and graphs can showcase trends and patterns, but they often fall short of uncovering the deeper “why” behind the numbers. 

This is where true data analysis comes in. By going deeper, we can identify hidden patterns and relationships that charts might miss. Let us take a graph showing a decline in sales as an example. While visualisation might suggest a straightforward drop, further analysis and interpretation could reveal a correlation with a recent marketing campaign targeting the wrong demographic. 

The key to unlocking these hidden gems lies in critical thinking and asking the right questions. Do not just accept what the data seems to be saying on the surface. Explore correlations, identify outliers, and challenge assumptions. By asking questions like “Why did this metric spike?” or “Are there external factors influencing this trend?“, you can unearth valuable insights that traditional data visualisation might overlook.

It is through this deeper analysis that data transforms from a collection of numbers into real insights. Let us learn more.

Beware of Biases: The Data Deception Trap

Data analysis is a powerful tool, but it is only as strong as the data itself. Unfortunately, data can be riddled with biases, like tiny cracks in a foundation, leading to skewed results and potentially disastrous business decisions. Here is why understanding bias is crucial:

  • Selection Bias: Imagine surveying only customers who actively use your social media platform. This neglects the silent majority and paints an inaccurate picture of overall customer sentiment.
  • Confirmation Bias: We all have a tendency to favour information that confirms our existing beliefs. A marketing team convinced their new product targets millennials might focus solely on data showing high social media engagement among young adults, ignoring valuable insights from a broader demographic analysis.

These are just two examples. Biases can creep in at every stage, from data collection to interpretation. A company analysing website traffic data solely from its own marketing channels might miss valuable insights from organic search or social media referrals due to source bias.

So, how do we avoid the data deception trap? Here are some actionable tips:

  • Data Triangulation: Verify findings by analysing data from multiple sources (e.g., website analytics, customer surveys, social media listening). This cross-checking helps identify inconsistencies and potential biases within individual datasets.
  • Diverse Data Sources: Do not rely solely on readily available data. Look for alternative sources that might challenge your initial assumptions and provide a more holistic view.
  • Blind Analysis: Where possible, conduct blind analysis by withholding certain information (e.g., demographics) from analysts to prevent confirmation bias from influencing their interpretations.

By being aware of potential biases and implementing these techniques, you can ensure your data analysis reflects reality, not a skewed version, and pave the way for sound decision-making.

Frameworks for Action: Turning Insights into Decisions

Data analysis is like a treasure hunt, we unearth valuable insights, but how do we translate that treasure into real-world business decisions? This is where data-driven decision frameworks come in. These frameworks provide a structured approach to bridge the gap between insights and action.

The Data-Driven Decision Making Framework (DDDM)

The DDDM framework emphasises a six-step process:

  1. Define the Business Problem: Clearly articulate the specific challenge you are trying to address.
  2. Collect Relevant Data: Gather data from various sources, ensuring it aligns with your problem definition.
  3. Analyse the Data: Employ data analysis techniques to uncover trends, patterns, and relationships within the data.
  4. Draw Insights: Interpret the results and translate them into actionable recommendations.
  5. Develop Recommendations: Based on the insights, propose specific actions to address the business problem.
  6. Evaluate and Monitor: Implement the chosen solution, track its effectiveness, and adapt based on ongoing data and feedback.

Case Study: A clothing retailer noticed a decline in sales for a specific product line. Using the DDDM framework, they analysed sales data, customer reviews, and social media trends. This revealed a shift in consumer preferences towards a more sustainable fabric type. The retailer used this insight to develop a new product line using eco-friendly materials, leading to a significant increase in sales.

The 5 Whys of Data Analysis

This simple yet powerful framework encourages you to drill down to the root cause of an issue by repeatedly asking “why” to each identified factor.

Case Study: A subscription service noticed a high churn rate among new subscribers. Using the 5 Whys, they discovered:

  1. Why are subscribers churning? – Because they are not finding enough value in the content.
  2. Why is the content not valuable? – Because it does not address their specific needs.
  3. Why does not it address their needs? – Because new subscribers are not properly onboarded and categorised based on their interests.

This analysis revealed a need for a personalised onboarding process, leading to a significant reduction in churn and improved customer retention.

Remember, the chosen framework should fit the specific problem. The DDDM framework provides a comprehensive approach to complex issues, while the 5 Whys is ideal for pinpointing root causes. By selecting the right framework and following its steps, you can transform data insights into actionable decisions that drive positive business outcomes.

Communication is Key: Translating Insights for Stakeholders

Unearthed a goldmine of data insights? The next hurdle is ensuring your stakeholders understand the significance and can translate it into action. Here is why clear communication is crucial:

Decision-Making Power

Stakeholders rely on your data-driven insights to make informed decisions. Jargon-filled presentations can lead to misunderstandings and hinder effective decision-making.

Tailoring Your Message

Technical Audience: For data-savvy audiences, delve deeper into the analysis, showcasing relevant metrics and statistical tests.

Non-Technical Audience: Focus on visual aids like clear charts and infographics. Emphasise the story behind the data and its practical implications.

Focus on the “So What”: Do not Just Present the Data; Explain its Impact

Highlight the “So What” Factor: Clearly articulate the implications of your findings – “This sales decline indicates a need to shift marketing strategies towards…”

Actionable Recommendations: Do not leave stakeholders hanging. Provide clear, actionable recommendations based on your insights, empowering them to take concrete steps.

By prioritising clear communication and focusing on the “so what” factor, you can transform your data insights from cryptic numbers into a compelling story that drives action and fuels business success.

Data Analysis and Interpretation in Finance (Financial Analysis)

Now that we have learnt how to interpret insights from data analysis, let us explore how these come in handy when it is related to financial decisions, one of the crucial categories of business decisions that determine the future of an organisation. Financial analysis and interpretation are fundamental skills in finance. They are used to turn raw financial data into actionable insights that can be used to make informed decisions. This financial data can come from a variety of sources, including:

  • Financial statements: These include the income statement, balance sheet, and cash flow statement. They provide a comprehensive overview of a company’s financial health.
  • Market data: This includes stock prices, interest rates, and economic indicators. It can be used to assess the overall health of the economy and identify investment opportunities.
  • Internal data: This includes sales data, customer data, and operational data. It can be used to identify trends and improve efficiency.

The financial analysis process typically involves the following steps:

  1. Data collection: This involves gathering the data from the relevant sources.
  2. Data cleaning: This involves ensuring that the data is accurate and complete.
  3. Data transformation: This may involve formatting the data or converting it into a different format.
  4. Data analysis: This involves using statistical methods to identify trends and patterns in the data.
  5. Data interpretation: This involves explaining the meaning of the data and its implications for financial decisions.

There are a number of different techniques that can be used to analyse and interpret financial data, such as:

  1. Ratio analysis: This involves calculating ratios from financial statement data to assess a company’s profitability, liquidity, and solvency.
  2. Trend analysis: This involves identifying trends in financial data over time.
  3. Regression analysis: This is a statistical technique that can be used to model the relationship between two or more variables.
  4. Discounted cash flow analysis: This is a technique that is used to value companies based on the present value of their future cash flows.

Data analysis and interpretation are essential skills for a variety of financial professionals, including:

  • Investment analysts: These professionals use data analysis to identify undervalued or overvalued stocks.
  • Credit analysts: These professionals use data analysis to assess the creditworthiness of borrowers.
  • Financial planners: These professionals use data analysis to develop financial plans for their clients.
  • Risk managers: These professionals use data analysis to identify and manage financial risks.

By using data analysis and interpretation, financial professionals can make more informed decisions that can lead to better financial outcomes. If you wish to learn financial analysis and interpretation, you can enrol in a comprehensive financial analysis course such as the Postgraduate Financial Analysis Program by Imarticus.

Building a Culture of Data-Driven Decisions: From Insights to Impact

Data analysis is a powerful tool, but its true potential is unleashed when it becomes ingrained in an organisation’s DNA. Fostering a culture of data-driven decisions empowers everyone, from frontline employees to senior leadership, to leverage data for informed choices.

Here is how to cultivate this data-savvy environment:

  • Data Literacy for All: Invest in training programs that equip employees at all levels with the skills to understand and interpret data. This empowers them to make data-informed decisions within their roles.
  • Democratise Data Access: Break down data silos and provide user-friendly tools that allow employees to access and explore relevant data independently. This fosters a sense of ownership and encourages data exploration.
  • Lead by Example: Senior leadership needs to champion data-driven decision-making. When leaders base their choices on data insights, it sends a powerful message throughout the organisation.

Data Analysis and Interpretation in Research

We are heavily dependent on data analysis and interpretation in research projects, especially when we are digging for insights from the heart of any research project. Here is a breakdown of the process:

Data Analysis

This is where we take the raw data we collected through surveys, experiments, interviews, etc., and organise it in a way that makes sense. We might use statistical software to calculate things like means, medians, and correlations. We might also create charts and graphs to visualise trends and patterns in our data.

Data Interpretation

Once we have our analysed data, it is time to make sense of it all. This is where we connect the dots and explain what our findings mean in the context of our research question.

We might ask ourselves questions like:

  • Do my findings support my research hypothesis?
  • What are the implications of these findings for the real world?
  • Are there any alternative explanations for my results?

Here are some key things to keep in mind during data analysis and interpretation:

  • Be aware of limitations: No research study is perfect. There might be limitations in your data collection methods or sample size. Consider these limitations when interpreting your findings.
  • Do not force the data: The data should tell its own story. Do not try to manipulate it to fit a specific conclusion.
  • Be transparent: Explain your methods clearly and honestly. This allows readers to evaluate the strength of your findings.

Finally, always remember that data analysis and interpretation are iterative processes. You might need to go back and forth between them a few times before you reach a clear understanding of your data. By following the above steps, we can transform our raw data into valuable insights that contribute to our field of research.

Wrapping Up

Do not wait and become a data evangelist within your organisation. Advocate for data literacy initiatives, promote data-driven discussions, and celebrate successes achieved through data-informed decisions. By working together, you can transform your company into a powerhouse of data-driven decision-making, propelling it towards a future of informed growth and success.

If you wish to learn data analysis and interpretation for finance, you can enrol in the Postgraduate Financial Analysis Program by Imarticus Learning. This financial analysis course will teach you everything you know to become an expert in the analysis and interpretation of financial data for strategic financial decisions as well as business decisions.

Frequently Asked Questions

What is the data analysis and interpretation meaning and why are data analysis frameworks important?

The data analysis and interpretation meaning is that this system provides a structured approach to translating insights from data into actionable business decisions. Data analysis frameworks help ensure a logical process and avoid overlooking crucial steps, leading to more effective decision-making.

How can bias skew data analysis results?

Biases, like focusing only on positive customer reviews (confirmation bias) or surveying just a specific demographic (selection bias), can distort data and lead to misleading conclusions.

What are some tips for communicating data insights to stakeholders?

Tailor your message to the audience’s technical background.

Focus on the “so what” factor – explain the implications of the findings and how they translate to actionable recommendations.

Use clear visuals and avoid jargon to ensure everyone understands the data’s story.

How can I promote a data-driven culture within my organisation?

  • Advocate for data literacy training programs for all employees.
  • Encourage data exploration by providing user-friendly data access tools.
  • Lead by example and demonstrate the value of data-driven decision-making in your own actions.

Top Finance Certification Courses for a Profession in Finance

In the present-day dynamic and competitive world, obtaining particular expertise and skills in the realm of finance has never been more crucial. Whether you are a fresh graduate or a seasoned professional trying to advance your career, finance certifications or related credentials provide an excellent chance to keep up in the ever-changing financial sector. 

A career in finance is a financially secure and prestigious career option. If you complete an online course with dedication and get certified after its successful completion, it will prove to be an exciting job prospect for you. Success in the finance industry demands a blend of hard and soft skills. Not only does a career in finance provide lucrative opportunities and analytical skills, but it also imparts strong decision-making skills, versatility, networking opportunities and stability. 

In this article, we’ll look at a list of online finance certification courses provided by Imarticus to help you make an informed decision about which certification is ideal for fulfilling your professional aspirations.

finance certification

List of Short-term Certification Courses in Finance

Financial Analysis Prodegree

The financial analyst course by Imarticus helps build a remarkable career in the finance sector while strengthening your investment banking skills as well. 

  • The Financial Analysis Prodegree in collaboration with KPMG is a perfect course for an individual who wants to learn about client-facing roles in finance functions such as those in Investment Banking. KPMG India participates in the FAP Program by designing curriculum, delivering programs, and creating content. A collaboration with such an industry expert guarantees that the curriculum is current and industry-relevant.
  • The 120-hour skill-building program will help in reigniting or transforming the career graph. With concepts like financial modelling training, equity research, valuation, financial statement analysis, transaction execution, and Microsoft Office applications, you can be part of future industry experts.

ACCA Course

  • The Association of Chartered Certified Accountants (ACCA), UK is an internationally recognised qualification program that is recognised in 196+ countries encompassing more than 8,00,000 members, affiliates and future members. In addition to that, a community of 7600+ top ACCA-approved employers are associated with the program, which ensures that the students can rest assured regarding their placements. Moreover, the study material by Kalpan helps to cover the diverse subject arena.
  • The ACCA Course prepares professionals for various domains such as accounting, auditing, taxation, management, finance, investment banking, corporate finance, forensic audit and consulting.
  • For this particular program, Imarticus Learning promises a 100% placement upon completing even the first 2 levels of ACCA or else money back is guaranteed. Furthermore, with the help of pre-placement boot camp, the aspirants may reinforce themselves with the appropriate skills and rest confident of getting the appropriate professional opportunity. As an added advantage, the students can also opt for re-doing the entire program and re-taking all sessions for free, until they successfully pass it.

CPA Course 

  • Certified Public Accountants or CPAs perform financial reporting, auditing, taxation, and advisory services. The scope of their job includes public accounting firms, corporate finance departments, or independent consultancies. Specific educational and experience requirements are set by the licensing board, which includes but is not limited to clearing the CPA exam and having a bachelor’s degree in finance or a related field.
  • The certificate for this course is globally recognised in 130+ countries. Being exclusive to the AICPA community, and following the dual-teacher model, it offers expert guidance to its students. This involves live online classes as well as round-the-clock one-on-one support for its students. The course curriculum is streamlined for the students via the study material powered by Surgent which guarantees a pass rate of 92%.  
  • Imarticus Learning promises a free placement boot camp for this program as well. Moreover, it gives a money-back guarantee or pass protection in case an individual fails to get through the exam.

CFO Course 

  • The Chief Financial Officer (CFO) course from the Indian School of Business (ISB) offers unique insights and sharply focused knowledge growth in the finance domain. The curriculum will enable students to embrace the thriving Indian economy while staying ahead of technology upheavals, navigating regulatory and policy changes, and realising the potential for financial inclusion.
  • It allows aspirants to pace their learning process through self-paced pre-recorded videos from outstanding faculty, office hours sessions from subject-matter-experts as well as masterclass sessions from marquee CXOs.
  • The ISB course by Imarticus is designed to empower people at all stages of their careers, including CFOs, high-potential executives moving to CFO roles, seasoned finance professionals, and mid-career finance specialists wishing to advance their financial capabilities.

Final Words

These financial certification courses provide tailored skills and knowledge for a variety of finance positions, with different qualifying requirements and needed competencies. Aspiring professionals can select the certification course that best matches their career objectives and improves their skills in their chosen subject of finance. 

With a dedication to upskilling and remaining updated on industry developments, you can grab incredible opportunities for yourself and leave a lasting effect in the fast-paced world of finance.

7 Key components of financial modelling

Stay ahead of the game with financial modelling

Stay ahead in the financial game with financial modelling! It’s a smart tool to make better money choices. By using past financial data like income, expenses and cash flow, you can plan for the future. Predict how your money will grow with factors like revenue and expenses.

Check how different situations can affect your money with sensitivity analysis. Key metrics and ratios, like profitability and liquidity, help evaluate your financial health. Keep track of your finances and get valuable insights to make informed decisions. With financial modelling, you’re all set to be a money champ! Stay smart, plan ahead and win the money game!

Financial modelling made easy: 7 Key components revealed

If you are in business or finance, you can use financial models. It helps you understand the financial situation of a company or investment. A financial model is a mathematical way of representing the financial situation. Sensitivity analysis is an important part of financial modelling. It helps you to see how changes in inputs or assumptions may affect the overall results. This can help you understand the risks and uncertainties and make better decisions.

Financial modelling is a complex process. But understanding its key components can make it easier to grasp. Here are the 7 key components of financial modelling made easy for you:

1. Assumptions

You must build financial models on assumptions about various factors. These include revenue growth, expenses and investments. They serve as the foundation for the entire model. These assumptions outline the expected growth rate of a company’s sales over a specific period. So, businesses can estimate their future income and plan accordingly

By developing these assumptions, businesses can assess the feasibility of their plan. They can make informed decisions to achieve their financial goals.

2. Historical data

Gathering and analysing historical financial data is crucial for accurate forecasting. This includes financial statements, market trends and industry benchmarks.

3. Forecasting

The next step is to project future financial performance. You can make use of assumptions and historical data for this step. Forecasting involves creating income statements. It also includes balance sheets and cash flow statements for future periods.

4. Sensitivity analysis

Financial models should account for various scenarios and potential risks. Sensitivity analysis helps identify the impact of variables on financial performance. It identifies how changes in key variables and assumptions affect the model.

5. Valuation

Financial modelling often includes valuation analysis. It determines the worth of a company or investment. You can use different valuation methods. These include discounted cash flow (DCF) analysis or comparable company analysis.

6. Scenario planning

Financial models should allow for scenario planning. It helps to assess the impact of different strategies and decisions. This helps in evaluating the potential outcomes and making informed decisions.

7. Reporting and presenting

Communicating the results of the financial model is crucial. Clear and concise reporting includes charts and graphs. This helps stakeholders understand the analysis and its implications.

Ultimately, financial modelling and sensitivity analysis provide valuable insights. They help understand the financial viability and potential risks of a project. This allows you to make informed and strategic decisions.

Understanding these key components helps you to build accurate and reliable financial models. For various purposes, such as investment analysis, business planning or decision-making.

Maximise your profits: Mastering financial modelling with sensitivity analysis

Financial modelling is a way to make predictions about a company’s future finances. It uses past data and assumptions about the future to build a model. Businesses use models to make decisions and plan. Sensitivity analysis shows how changes in the guesses can affect the predictions. It’s important to understand the data and assumptions. Models should be updated to reflect changes. Financial modelling can help you get ahead in your career. It is a valuable skill set to add to your resume.

Interested in learning financial modelling and other essential skills. These can help you succeed in the finance industry. Imarticus Learning offers comprehensive and industry-relevant learning programmes. Our courses are designed to provide practical knowledge and hands-on experience. Our financial analysis course equips you with the skills to excel in your career. Join Imarticus Learning today. Take the first step towards achieving your professional goals.