Which are the best data analytics courses that offer placements?

Data analytics is a critical aspect of the modern business landscape. The ability to process, analyze and extract meaningful insights from large amounts of data is essential to drive business growth and profitability. 

Data analysts should not be confused with data scientists. Although data scientists and analysts both use data, the things they do with it vary. Business executives are assisted in decision-making by data analysts who use data to answer predetermined questions.

According to the US Bureau of Labor Statistics, analysts will have 23% more job opportunities between 2021 and 2031, a rate much higher than the country’s anticipated average employment growth of 5%.

become a Data Analyst

As a result, the demand for skilled data analytics professionals has grown in recent years. If you want to build your data analytics career, selecting the top data analytics courses with job placement is essential. 

What is Data Analytics and Its Importance?

Data analytics works to examine raw data to extract valuable insights. It involves using computational and statistical techniques to identify data patterns and trends. Data analytics is critical to businesses to make informed decisions and optimize processes.

  • Data analytics aids in the discovery of trends, correlations, and patterns that may point to the fundamental causes of your performance.
  • Data analytics is more than simple math and graphs. It involves comprehending your target market, foreseeing their wants, and designing your goods and services to satisfy those demands.
  • Data analytics is more crucial than ever in the data-driven world of today. Businesses may improve their bottom line and gain a competitive edge by using data analytics by making data-driven choices.
  • Businesses may streamline processes, save expenses, and boost revenue by adopting data analytics. They can spot new chances for development and innovation.

The Growing Demand for Data Analytics Professionals

Data analytics courses with job interview guarantees are in greater demand each year than there are qualified candidates to occupy those positions.

According to estimates, there are currently 97,000 open positions in data analytics in India alone per year. The need for data analytics has resulted in a significant 45% growth in jobs in the Indian industry. 

Due to the steep learning curve and high skill set requirements in the area, there is a growing gap between the need and supply of these individuals. The education and training required for these jobs have begun to receive more attention and momentum in India.

How to choose the right data analytics course for job opportunities?

If you’re looking for data analytics and data visualization courses, there are some essential things to consider before deciding. 

Here are some essential factors that you should keep in mind:

  • Check if the institution is accredited and has a good reputation. This ensures that the course meets the required standards and is recognized by employers. 
  • Look at the curriculum and course content. Ensure the course covers fundamental statistical analysis, visualization, and data mining. 
  • Consider the quality of the faculty and teaching staff of the quantitative analysis courses. Look for experienced teachers with the necessary qualifications and experience in data analytics. 
  • Look for courses that have connections and partnerships with the industry. This will provide you with real-world experience and networking opportunities.

Considering these factors, you can find a data analytics course that’s right for you and can help you achieve your career goals.

Launch Your Data Science Career with Imarticus Learning – Become an Expert in Analytics Today!

Are you aiming to become a pro in analytics and data science? Look no further than the comprehensive course from Imarticus Learning! 

With this curriculum, which guarantees job interview opportunities, you’ll learn how to create analytical models to improve corporate results. This curriculum is ideal for anybody wishing to launch their career in data science, whether you’re a seasoned professional or just getting started.

As you progress through this program, you will get practical expertise with Python, SQL, data analytics, Power BI, and Tableau while learning about the real-world applications of data science and analytics. With these abilities, you’ll be well-equipped to work in the developing field of data science and analytics.

Also, this curriculum includes a job interview guarantee that allows you to get hired by the 500 top-tier partner companies actively seeking machine learning and artificial intelligence specialists. 

Conclusion

The expansion of data analytics and data science occupations is driven by the increasing digitization of Indian businesses and the expanding footprints of global firms. The demand for experts who can gather, analyze, and visualize enormous volumes of data is always increasing rapidly.

Therefore, data analytics is a critical aspect of the modern business landscape, and the demand for skilled professionals will only increase in the coming years. The correct data analytics course is essential to getting the necessary training and skills to succeed. 

Join the Imarticus Learning course today for this fantastic chance to launch your data science career!

The importance of linear regression in machine learning

Are you interested in knowing linear regression and how it is used in machine learning? We got you.

Machine learning is a field of study that uses statistical and computational techniques. This enables machines to learn from data and improve their performance over time. Linear regression is a fundamental machine learning technique. It plays a critical role in predicting outcomes from data.

Data Science Course

If you want to become a data analyst and learn data analysis and machine learning, then machine learning certification courses like Postgraduate Program in Data Science and Analytics  are among the best options. In this article, we will discuss the importance of linear regression in machine learning. You can also find one of the best machine learning certification courses to improve your understanding.

Introduction to linear regression

Linear regression is a statistical technique. it is used to establish a relationship between two continuous variables. It is a popular method for predicting outcomes based on input data. The basic idea of linear regression is to find a line that best fits the data points. The line is defined by an equation of the form y = mx + c. Here y is the dependent variable, x is the independent variable, m is the slope of the line and c is the y-intercept.

Linear regression is widely used in various fields. This includes finance, economics, physics and social sciences. In machine learning, linear regression is used to predict the output variable based on one or more input variables.

Types of linear regression

Linear regressions are usually differentiated into two types: simple and multiple linear regressions.

Simple linear regression involves only one independent variable, while multiple linear regression involves two or more independent variables.

Simple linear regression is used to establish a relationship between two variables. Here one variable is dependent and the other is independent. For example, predicting the price of a house based on its size is an example of simple linear regression.

Multiple linear regression is used to establish a relationship between the dependent variable and multiple independent variables. For example, predicting the sales of a company based on multiple variables such as advertising budget, price and location is an example of multiple linear regression.

Importance of linear regression in machine learning

Linear regression is one of the most important techniques in machine learning. It is widely used in various applications such as:

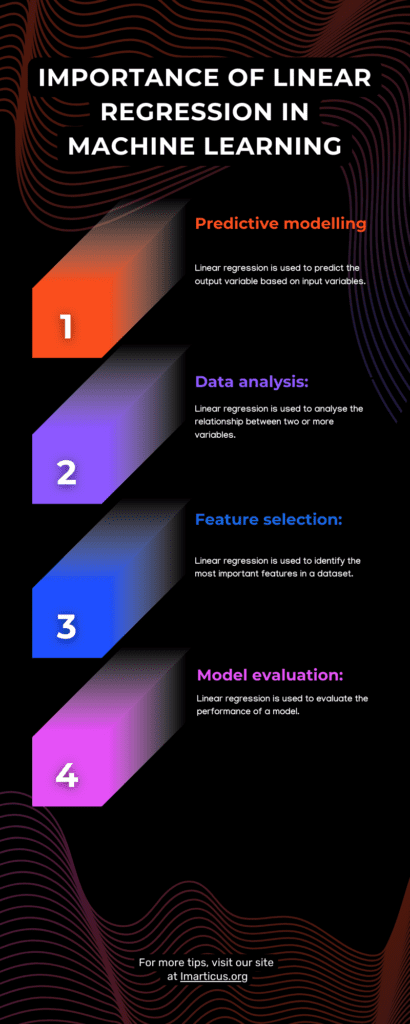
Predictive modelling

Linear regression is used to predict the output variable based on input variables. For example, predicting the price of a house based on its size, location and other factors is a common application of linear regression.

Data analysis

Linear regression is used to analyse the relationship between two or more variables. It helps in identifying the significant variables that affect the outcome variable.

Feature selection

Linear regression is used to identify the most important features in a dataset. It helps in selecting the relevant features that are important for prediction.

Model evaluation

Linear regression is used to evaluate the performance of a model. It helps in determining the accuracy of the model and identifying areas for improvement.

Individuals who want to become data analysts should complete machine learning certification courses like Postgraduate Program in Data Science and Analytics to learn data analysis and machine learning concepts.

Importance of linear regression in machine learning

Postgraduate program in data analytics and machine learning

The Postgraduate Program in Data Science and Analytics is a 6-month job-oriented curriculum course for working professionals and young data analysts. Students who complete this course create analytical models that enhance company results. They can also comprehend how data science is used in practical settings.

With the course, you will gain helpful information about the uses of analytics and data science in actual organisations. You will also get equipped to work as a data science specialist in the developing industry. Also, it provides you with the opportunity to work with leading firms and learn about the most recent developments in the analytics field. Following are the various benefits of completing the Postgraduate Program in Data Science and Analytics:

The Postgraduate Program in Data Science and Analytics focuses on practical knowledge and a job-specific curriculum.

It offers guaranteed job opportunities where students have a chance to get placed in companies like Infosys, Goldman Sachs, Deloitte, KPMG, IBM and more.

Students who complete the program are provided with a KPMG certificate.

To sum up

Linear regression is a fundamental machine learning technique that plays a critical role in predicting outcomes from data. It is widely used in various applications such as predictive modelling, data analysis, feature selection and model evaluation. Understanding the basics of linear regression is essential for anyone working in the field of machine learning.

Those interested in becoming data analysts should enrol in our Postgraduate Program in Data Science and Analytics. For any queries, feel free to contact us.

Using PowerPivot for Advanced Data Science

Power Pivot is a powerful data modelling and analysis tool and can play an essential role in a Career in Data Analytics. Power Pivot is a vital tool for any data analyst or data scientist with its ability to handle large data sets and perform complex calculations.

This blog will explore how to use Power Pivot for advanced data science, including data preparation and cleaning, data modelling and analysis, and data visualisation. 

Whether you’re starting your Career in Data Analytics or are a seasoned data professional, this blog will provide valuable insights and best practices for using Power Pivot in your data science projects.

What Is Power Pivot?

Power Pivot is a Microsoft Excel add-in that provides data analysis and modelling capabilities for business intelligence and data analysis. 

become a Data Analyst

A familiar Excel interface allows users to import, manipulate, and manage large amounts of data and create custom calculations, relationships, and reports. 

The Power Pivot feature enhances Excel’s capabilities, enabling users to perform advanced data analysis and reporting, including data modelling and visualisation.

Why Use Power Pivot?

Power Pivot is a powerful data analysis tool that allows you to process large amounts of data and perform complex data manipulations in minutes. It is used for advanced data analysis, particularly in business intelligence and data science. 

There are several reasons to use Power Pivot:

Ease of Use: Power Pivot has a handy interface, making it easy for non-technical users to perform complex data analysis.

Speed: Power Pivot can handle large amounts of data, allowing you to process, manipulate, and analyse data in a matter of minutes.

Integration with Excel: Power Pivot is integrated with Microsoft Excel, making it a convenient tool for those familiar with spreadsheet software.

Data Manipulation: Power Pivot enables you to perform complex data manipulations, including data cleansing, data aggregation, and data modelling, making it an ideal tool for data scientists and business analysts.

Enhanced Data Analysis: Power Pivot provides advanced data analysis features, such as pivot tables, charts, and data visualisations, which are not available in standard Excel.

Scalability: Power Pivot can scale to handle large amounts of data, making it an ideal tool for large-scale data analysis projects.

Power Pivot Use Case

A use case for Power Pivot might be for a business analyst who needs to analyse sales data from many departments and stores. 

The data is stored in separate Excel spreadsheets, and the analyst needs to combine the data and perform analysis to identify trends and make recommendations to the company.

With Power Pivot, the analyst can:

Import data from many Excel spreadsheets into a single data model.

Create relationships between the tables to link the data together.

Create calculated fields using DAX (Data Analysis Expressions) to perform custom calculations, such as finding the total sales for each department or store.

Build tables and charts to analyse the data and identify trends and patterns.

Share the data model and analysis with others by creating a Power BI report or publishing the Excel workbook to the web.

This use case demonstrates the ability of Power Pivot to handle large data sets, perform complex calculations, and provide interactive data analysis and visualisation capabilities.

How To Enable Power Pivot?

To enable Power Pivot, you need to have the Power Pivot add-in installed in your Microsoft Excel software. You can download and install it from the Microsoft website if you don’t have it.

Here are the steps to enable Power Pivot:

Open Microsoft Excel and then click on the “File” tab.

Go to the “Options” tab and select “Add-Ins.”

In the Manage box, select the option “Excel Add-ins” and then click on “Go.”

Check the “Microsoft Power Pivot for Excel” check box and click “OK.”

You should now see a Power Pivot tab in the ribbon menu.

Once you enable Power Pivot, you can import and manage large data sets, perform advanced data analysis, and create robust pivot tables and models. 

What Are the Benefits of Using a Power Pivot?

Some benefits of using Power Pivot include the following:

Handling large data sets: Power Pivot can take large amounts of data from various sources, making it easier to work with and analyse data.

Data Modeling: Power Pivot allows you to create relationships between tables, perform calculations and create calculated fields using DAX (Data Analysis Expressions).

Integration with Power BI: Power Pivot can be a data source in Power BI, a cloud-based business intelligence and data visualisation platform.

No need for VBA or Python: Power Pivot does not need any programming skills or knowledge of Python or VBA, making it accessible to a broader range of users.

Improved performance: Power Pivot uses columnar storage and in-memory technology to improve query performance, making it faster and more efficient than traditional Excel pivot tables.

Conclusion

Power Pivot is a critical tool to master for anyone aspiring to build a career in Data Science. It offers the ability to process massive data sets, execute complex calculations, and provide interactive data analysis and visualisation capabilities. 

Businesses can establish a robust data science workflow by integrating Power Pivot with other data science tools like Python and Power BI.

A data analytics certification course is a valuable investment to enhance your existing data science skills or start your journey in the field.

Imarticus’ Postgraduate Program in Data Science and Analytics is a comprehensive course that covers all aspects of data science, including data preparation, modelling, analysis, and visualisation. 

With a focus on hands-on learning and real-world projects, this data analytics certification course equips students with the necessary skills and knowledge to succeed in data science.

This data science course with placement assistance helps students with practical and job-ready education, preparing them for a successful Career in Data Science.

So take advantage of this opportunity to further your Career in Data Science. Enrol in Imarticus Learning’s Postgraduate Program in Data Science and Analytics today.

Python vs R: Why is Python Preferred for Data Science?

Python is a high-level and fast-growing programming language which is ideal for scripting both applications as well as websites. Even though there are several programming languages such as C++, SQL or R that are widely used by aspiring data scientists, Python stands out from the rest. 

become a Data Analyst

A career in Data Analytics ensures a promising future for those who can master the fundamental programming concepts and apply them to solve real-world problems in any business.  

It is imperative to know how to employ data analytics tools to evaluate the performance of a business. Knowing a programming language like Python can be extremely effective as it helps you build these tools. 

Some data scientists, on the other hand, use R to analyse data through interactive graphics. In fact, R is a frequently chosen programming language for data visualisation. It is, however, important to understand on what grounds Python and R are different and why Python is the most preferred programming language in this profession. 

What Is Python?

Python is extremely versatile and it is among the most dynamic and adaptable programming languages used in data analysis. It is used to develop complex numeric as well as scientific applications. You can use this programming language to perform scientific calculations.  

It is an open-source and object-oriented programming language with a rich community base, libraries and an enormous arrangement of tools. Compared to other programming languages, Python, with its straightforward code, is much simpler to learn because of its broad documentation. 

What Are the Features of Python?

The significant features of this programming language are

Readable: In comparison to other programming languages, it is much easier to read. It uses less code to perform a task. 

Typed language: The variables are automatically created as it is a typed language. 

Flexible: It is quite easy to run this programming language on multiple platforms as it is flexible and adaptable. 

Open-source: It is a free programming language. It uses an easily accessible and community-based model. 

Why Is Python Important in Data Science?

Whether you are already a professional data analyst or someone who aspires to explore a lucrative career in Data Analytics, it is imperative that you know how to use Python. Some of the most prominent reasons why this programming language is preferred for data science are:

Easy to learn and use: With better comprehensibility and simple syntax it has become extremely popular over the years. It is also quite easy to handle the data through its data mining tools such as Rapid Miner, Weka, et cetera.

Builds superior analytics tools: It is a dynamic programming language that provides better knowledge and correlates data from large datasets. It also plays a crucial role in self-service analytics. 

Important for deep learning: It assists data scientists to develop deep learning algorithms which were majorly inspired by the architecture of the human brain. 

Creates data analysis scripts: Data analysis scripts can be created using this program within Power BI

Has a rich community base: Python developers are able to address their issues within a huge community of data scientists as well as engineers. Python Package Index, for example, is a great place for developers to explore this programming language. 

What Is R?

R is a versatile, statistical and advanced programming language which is primarily used for interpreting data. It works perfectly for data visualisation, web applications and data wrangling. It is also used to perform statistical calculations and that too without vectors. R makes collecting and analysing large datasets easy. 

What Are the Features of R?

The important features of R include

Open-source: R too, is free, adaptable and accessible to all. It can be easily integrated with multiple applications. 

Static graphics: R has powerful and interactive static graphics which produce high-quality data visualisations. 

Statistical calculations: This programming language can perform both simple as well as complex statistical calculations. 

Compatibility: This programming language is compatible with other programs such as C, C++, Java, et cetera. 

Python vs R: Which Programming Language Is Preferred in Data Science?

The primary reasons why Python is often preferred over R are:

Purpose: Both these programming languages serve different purposes. However, even though both are used by data analysts, it is Python which is considered more versatile in comparison to R. 

Users: The software developers prefer Python over R as it builds complex applications. Statisticians and researchers in academia, on the other hand, prefer using R. 

Ease of use: Beginner programmers prefer Python because of its English-like syntax. R, on the other hand, can be difficult once a programmer starts exploring its advanced functionalities. 

Popularity: Python outranks R mainly because it can be used in several software domains. 

However, despite these differences, both these programming languages have robust ecosystems of libraries and are extremely crucial for an aspirant who wishes to start a prospective career in Data Analytics.

Conclusion

A career in data science is considered one of the most successful professions in recent years. If you want to learn data analytics techniques, it is imperative that you learn Python

In order to pursue a career in Data Science, you should choose a proper data analytics certification course that introduces you to this programming language. 

Imarticus’ Postgraduate Program in Data Science and Analytics is a job-assurance program that helps you navigate all aspects of this profession. The curriculum of this course covers all the fundamental data analytics concepts including data analysis, introduction to important programming languages such as SQL and Python, data visualisation with Power BI or Tableau and applications of machine learning. 

What are the key deep learning methods AI practitioners need to apply?

Deep learning is a rapidly growing topic within artificial intelligence (AI). It focuses on developing algorithms that allow computers to learn from data. We can use Deep learning for various tasks, including image recognition, language translation, and autonomous navigation. As a result, deep learning professionals are becoming increasingly important as the need for AI grows.

In this blog post, we’ll look at some of the key deep learning methods AI practitioners need to apply to be successful. Let’s first understand,

What Is Deep Learning?

become a Data Analyst

Deep learning is a powerful subset of artificial intelligence (AI) that enables computers to learn complicated tasks and processes. It is the basis for several cutting-edge AI applications, including facial recognition and self-driving automobiles.

As AI practitioners continue to explore the depths of machine learning and develop a deeper understanding of its capabilities. It is essential to understand the different methods and techniques used in deep learning. Now let’s look at the key deep learning methods AI practitioners need to be familiar with:

1. Neural Networks and Backpropagation.

One of the foundational elements of deep learning is neural networks. Neural networks are essentially a system of interconnected nodes or “neurons”. They work together to process input data to make decisions or predictions. This type of network is modelled after biological neurons found in the human brain. This network has been used in various forms since the 1940s.

For neural networks to learn, it is essential to train using backpropagation. It is a process that propagates errors backwards through the network to adjust weights and biases accordingly. This process allows neural networks to “learn” from their mistakes over time.

2. Convolutional Neural Networks.

Deep learning algorithms known as convolutional neural networks (CNNs) were created expressly for image identification applications. CNNs use convolution layers with filters that recognise image patterns more efficiently compared to traditional neural networks.

These layers are combined with pooling layers that reduce the size of images while still preserving essential features. The combination of these two layers makes it possible for CNNs to identify objects within an image with high accuracy rates accurately.

3. Recurrent Neural Networks.

Recurrent neural networks (RNNs) are another type of deep learning algorithm. They are often used when dealing with sequential data such as text or audio recordings. Unlike traditional neural networks, RNNs have feedback loops that allow them to remember information from previous inputs. That accurately predicts future outputs based on current inputs and past observations.

This makes RNNs ideal for language translation and speech recognition tasks. They are useful where understanding context is essential for accurate results.

4. Autoencoders.

Autoencoders are a type of artificial neural network used for unsupervised learning. Autoencoders reduce the size of data by representing it in a smaller format while retaining the information. This is especially useful for image recognition, where it can compress data without losing essential features.

Autoencoders are also well-suited for anomaly detection. They can identify data points significantly different from the rest of the dataset.

5. Generative Adversarial Networks.

Generative adversarial networks (GANs) are a kind of deep learning algorithm used for unsupervised learning. Unlike traditional machine learning algorithms, GANs use two networks—a generator and a discriminator. These networks interact against each other to improve the performance of both networks.

The generator produces data that it attempts to trick the discriminator into believing is real. On the other hand, the discriminator works to identify which data is real and which is generated. This competition helps both networks become more accurate over time, improving performance on various tasks.

6. Transfer Learning.

Transfer learning is a deep learning technique that leverages existing models to train new models quickly. This is especially useful for tasks with limited data, as it allows the model to learn from processed and labelled data.

Transfer learning can also be used for various tasks, such as image recognition and natural language processing. This is because it allows the model to take advantage of existing networks that have already been trained on similar tasks.

7. Long Short-Term Memory (LSTM) Networks.

Long short-term memory (LSTM) networks are a type of recurrent neural network designed to remember long-term dependencies in sequential data. Unlike traditional recurrent neural networks, LSTMs have feedback loops that allow them to store and access information from previous inputs.

This makes LSTMs ideal for language translation and text generation tasks. It is useful in situations when knowing context is critical for correct results.

Conclusion

Deep learning is an ever-evolving field within artificial intelligence (AI). There are many different methods AI practitioners need to master to stay competitive in this space. Understanding how these methods work will help practitioners stand out when applying for AI jobs. Joining the Data Analytics course with placement can help develop new projects related to deep learning technology today!

SQL for Data Science: Why Is It Important?

Learning SQL or Standard Query Language is a mandate for anyone looking to build a career in data science. It is used for interacting with and extracting data from relational databases. Most modern systems today capture data stored in one or multiple databases like Oracle, MySQL, SQL Server and Redshift. Hence, it is important to have an in-depth understanding of SQL to glean data from these systems and use them efficiently.

Apart from writing queries and handling data, it aids in communicating with people, visualising results and building models. It is also an essential element in machine learning. Despite being a powerful tool, it is easy to learn, easily shareable, familiar and relevant worldwide.

What is SQL?

SQL or Standard Query Language is a declarative language for controlling and acquiring data. Data scientists use it to develop, decipher, control (insert, update, delete) and combine tables. Furthermore, it is used for filtered results with ORDER BY statements, WHERE clauses and the like. 

data science course

SQL helps data scientists access data and work directly with a database without using a different programming language. It makes running complex queries easier because one can do so with SQL syntax and without writing code, making extracting anything from a database easy.

5 Reasons Why SQL is Important in the Field of Data Science

SQL is essential for Relational Database Management which plays a major part in data science. Here are 5 main reasons why SQL is important in data science:

1. It is a powerful language 

SQL programming is used for manipulating data, creating new tables, inserting data into tables and retrieving results of queries. SQL syntax is similar to the SQL programming language, which makes it easy to learn. Developers familiar with Standard Query Language also find it easier to learn Python objects and programming. With SQL, it is possible to:-

  • Query the database and acquire results comprehensibly without manually going through every row with tools like R scripts or Excel. 
  • Quickly acquire the necessary answers you need without the need to write code or try multiple algorithms.

2. It is globally recognised

Being familiar with data science tools like R, Spark and Python makes it easier to learn SQL. More importantly, it is a mandatory skill recognised globally to help manipulate and interact with data stored in databases. Knowing how to write queries in SQL can be used in all database applications and tools without any in-depth knowledge of statistics.

3. SQL is sharable

SQL is also widely used for sharing data and helping data scientists communicate with other non-technical members of an organisation who might require the same information. For instance, if the marketing team of a company requires understandable information from a raw dataset, then it is the duty of the data scientist to glean, process, clean and provide it. This helps enhance flexibility and work efficiency among teams. 

4. It is a common tool

Data experts and business users widely use SQL for querying databases like data lakes and warehouses. Aside from being another tool that helps access Spark and Hadoop, it is also used by primary data analysis tools like Tableau to query relational databases. 

5. It is relevant

SQL is commonly used in multiple data science tasks like:-

  • Exploring data and understanding it better
  • Cleaning up data
  • Prepare data for analysis
  • Building models on the prepared data set
  • Visualising results and reporting on them.

Why is Learning SQL a Mandate for Becoming a Data Scientist?

We have consolidated a list of reasons why learning SQL is a mandate for pursuing a career in data science:-

  • It helps handle structured data: SQL is required to work with structured data stowed in relational databases and raise a query in said databases.
  • Big data platforms provide useful extensions: Platforms like Hadoop offer extensions for raising SQL command queries to manipulate data efficiently in HiveQL.
  • It helps experiment with data: SQL is a standard tool that provides data scientists with the opportunity to experiment with data by creating test environments.
  • It helps in analysing data: SQL skills are integral in data analytics. It helps work with data stored in relational databases such as MySQL, Microsoft SQL and Oracle.
  • Helps in preparing data: SQL helps in data wrangling, which removes errors and combines complicated datasets. It is essential for working with numerous big data tools because it aids in preparing data and making it more accessible.

Conclusion

SQL skills are mandatory for data scientists. It helps comprehend data efficiently to facilitate effective decision-making. Therefore, a career in data science is the most lucrative choice you can opt for because of the golden opportunities that lie in its wake. 

Large corporations are constantly looking for data scientists who can glean and analyse data from large data sets to help make better decisions that will facilitate the ultimate growth of an organisation. To upskill yourself and further your career in this field, you can sign up for the comprehensive Postgraduate Program in Data Science and Analytics offered by Imarticus Learning

How SQL and Excel are right for tableau

SQL and Excel are powerful tools that complement Tableau’s data visualization capabilities. Tableau is a data visualization software or application that allows users to connect to and visualize data from various sources. You can integrate SQL and Excel with Tableau to enhance functionality and allow users to work efficiently with data. 

Reasons behind the growing hype of Data Visualization:

  • Data visualization tools and techniques allow for the quick and easy interpretation of complex data sets, helping businesses and individuals to identify trends, patterns, and outliers that you might otherwise miss.
  • Visualization tools have become more user-friendly, and cloud-based platforms have made it easier to share and collaborate on data visualization projects.
  • Infographics, charts, and interactive visualizations are more likely to be shared and engaged than traditional data reports or spreadsheets.
  • Finally, data visualization is an effective way to communicate data-driven insights to a broad audience. By presenting data visually appealing and engagingly, businesses and individuals can share complex information in a way that is easy to understand and memorable.

Here are eight points that explain how SQL and Excel are right for Tableau:

  • Data Preparation: Excel and SQL can help prepare data before feeding data into Tableau. Excel is an excellent tool for cleaning up and formatting data, such as removing duplicates or fixing formatting issues. SQL can filter and sort data and perform calculations before importing it into Tableau.
  • Data Connection: Both Excel and SQL can be used to connect to Tableau data sources. Excel can import data from various sources, such as spreadsheets, databases, or other files, which you can use in Tableau. Similarly, SQL can connect to multiple databases, and you can use SQL queries in Tableau.
  • Data Aggregation: SQL is a powerful data aggregation tool, allowing Tableau to work with large datasets more efficiently. SQL queries can summarize and group data, making it easier for Tableau to work with large datasets.
  • Data Blending: Tableau’s data blending feature allows users to combine data from multiple sources. Excel can blend data from multiple spreadsheets, while SQL can integrate data from various databases. This feature enables Tableau to create more complex visualizations incorporating data from different sources.
  • Data Analysis: Excel is a popular tool for data analysis and can be used in conjunction with Tableau. For example, Excel can calculate statistics or perform regression analysis, which can then be used in Tableau. SQL can also be used for data analysis, such as computing averages or creating complex queries you can visualize in Tableau.
  • Data Exploration: Tableau is designed to help users explore data visually. However, SQL and Excel can also explore data before visualizing it in Tableau. You can use SQL to query databases and explore data in a more structured way. You can use Excel to create pivot tables, which can help users explore data quickly and efficiently.
  • Data Validation: Excel and SQL can validate data before visualizing it in Tableau. You can use Excel to perform data validation checks, such as checking for missing data or identifying outliers. SQL can also validate data by checking for duplicates or identifying inconsistencies.
  • Data Maintenance: Excel and SQL can be used to maintain data integrity over time. Excel can create templates or dashboards updated regularly with new data. You can use SQL to create stored procedures that you can use to edit or delete data in a database. This functionality allows Tableau to work with more up-to-date and accurate data.

SQL and Excel are powerful tools that can enhance Tableau’s data visualization capabilities. You can use them for data preparation, connection, aggregation, blending, analysis, exploration, validation, and maintenance. By leveraging these tools, users can work with data more efficiently and create more sophisticated visualizations. 

Explore your career in Data Analytics and Machine Learning with Imarticus Learning!

best big data analytics course

This Data Analytics Certification Course promises to help you realize the full potential of data analysis and create models with the most significant business impact possible. Whether you are a recent graduate seeking to make a career in data analytics and machine learning or an experienced professional looking to advance your career in analytics, this program provides a practical approach to understanding how analytics can drive actual results in a business setting.

Course Benefits for Students:

  • Students can benefit from data analyst training while staying in the comfort of their homes.
  • Learn by doing with Data Analytics codes.
  • Students who complete the PG in Data Analytics Certification Course will have a thorough theoretical and practical understanding of data analytics.

Introduction To Data Analytics: Technologies, Jobs and Careers

Introduction To Data Analytics: Technologies, Jobs and Careers

Nowadays, Data Analytics has become a sort of a buzzword in the data science industry. Just have a look at any of the job websites, and you will see that there are many vacancies in data science. Even Harvard University has labelled it as one of the hottest job fields in the USA, and India is also a part of the same trend.

So, what is the reason behind this craze for data analytics and data science jobs? Let’s have a look.   

What is Data Analytics, and what does a data analyst do?

Data Analytics is a subset of Data science. It is where raw data is cleaned, analysed, interpreted and displayed using several approaches with the help of business intelligence tools. These data analysis tools transform raw data into interpretable information that aids in making successful decisions.

But how is the data presented? Raw data is converted into meaningful information, statistics and explanations with the help of tools and techniques. There are multiple tools that data analysts use for generating all the interpretations of data.

At the same time, there is some programming expertise that a data analyst requires. For example, they could learn either of the two programming languages, R and Python, to process the data. For storing this data, they could use SQL. But the entire tech tools a data analyst needs are mentioned in the next section. So, just continue to read the topic till the end.

Technologies employed by Data Analysts

Several tech tools and programming languages can make the life of a data analyst easier. As already mentioned, data analysts have to process raw data and use it to generate various graphical representations. For that, they need to –

  • Identify the data they require
  • Collect raw data from the specific source they have identified
  • Clean the data and remove the inconsistencies
  • Analyse the data
  • Interpret the results

To perform these functions, data analysts use several tools. First of all, let us delve deeper into the programming languages that come in handy.

  • Python
  • R
  • SQL
  • Hadoop for big data

corporate leadership

The best thing about these programming languages is that there are multiple online resources to master these programming languages. You will find millions of tutorials to learn Python online.

Apart from the programming languages, you need to master some of the tools that are mentioned below:

  • Google Sheets
  • Microsoft Excel
  • Tableau
  • SAS(Statistical Analytical System)
  • Microsoft Power BI
  • Jupyter Notebooks

Mastering these tools and programming languages is quite important because they help you by making your job easier. You get to learn all these in a good data analytics certification course, and you can get in touch with us at Imarticus Learning.

Jobs for Data Scientists

Data science jobs stretch across various sectors. It has always been used for business, in both sales and marketing. Not only that, it is also handy for retail so that the inventory can be managed. Apart from business, it is used in medical infrastructure, operation research, finance and allied sectors. It is also being used in the entertainment field for various data-based jobs, especially for calculating the TRP of various shows.

Now it is also being used in education, law, security, automobile industry, energy sector supply chain, social media and in various fields of research. Data analysis has crept into almost every industry as it is finding a lot of applications in various fields.

But which are the most popular roles that are also enjoying a huge career and salary growth? Some of these roles are mentioned below:

  • Medical and health care analyst
  • Market research analyst
  • Business analyst
  • Business intelligence analyst
  • Operations research analyst
  • Intelligence analyst

These jobs are the top roles across various industries and job sectors. You will find multiple listings of these roles in all the leading job portals. Some of the beginner roles start above the ₹5,00,000 pay bracket. However, if you have completed a good data analytics certification course, then you will be able to command a good salary from your employing organisation.

The overall career of a Data Analyst

Choosing data analysis as a career path is a great decision, especially in the current market. After bagging a beginner role, try to gain more technical skills. Then you move to the position of a data scientist.

But there is a clear bifurcation of the career paths. For example, if your interest largely lies in statistics and data analysis, then try out business intelligence and analysis. But if you love the tech side, pick data science and data engineering as your career.

To conclude, the opportunities for data science jobs in the current scenario are increasing every year and are slated to grow even further in the coming years. So, being prepared with the necessary knowledge and technical know-how will greatly boost your career. In this regard, you can always look at the Post Graduate Program in Data Analytics and Machine Learning from Imarticus Learning to enhance your skill set. 

Top 10 Popular Data Analytics Tools For A Better Career

Top 10 Popular Data Analytics Tools For A Better Career

Data is definitely today’s one of the most valuable assets. We all know the limitless power of data and how it dictates business operations. Whatever the scale of a business, data makes the core of it. Not only businesses or IT hubs are using data analytics, but various other fields are also taking the advantage of it. Let us take a very simple instance to understand how data analysis works.

Let us take sports as a case study. This will help you understand that a field that is remotely connected to science and technology is extracting its benefits. Assume X is a tennis player who has been on the circuit since 2005. He has been touring all over the world, participating in various tournaments, and has recently put his shoes off. Now, you get to see his performance graphs, how consistent he was, which were his favorite shots, etcetera on television channels. This is the most common scenario when the stats are analyzed post-retirement. Have you ever thought about how that is possible? 

 For instance, all the records and stats right from his first match to the final match with a comparative analysis require rigorous data analytics. It is humanly impossible to gather all the data and then filter out necessary ones manually. 

Here comes data analytics tools that help you perform the task effectively. Go through the upcoming sections to get familiar with the new-age data analytics tools.  

An Introduction to Data Analytics

We are currently living in the world of data and therefore you will often be advised to learn data analytics

Data analytics tools are particular applications and/ or software that enable data analysts to work with a large volume of data. Data, in its crudest form, is unstructured and haphazard. A data analyst filters out unnecessary data and then collates the required information in the database. This is structured data that can be used effectively for future references. 

Data analytics tools help manage and work with data. In other words, useful data is actually the derivation of structured data via data analytics tools. Find below a list of the latest tools that are used by the giants of the industry like Google, Facebook, Apple, Dominos, and others.  

Top 10 Data Analytics Tools

Python

One of the most widely used programming languages among AI developers today is Python. It can be used effectively to run programs because it does not need to be pre-compiled into machine code. Additionally, it has an automatic memory management system and a dynamic type system that support a wide range of programming paradigms.

Microsoft Excel

It may sound trivial but in reality, Microsoft Excel works as a strong data analytics tool. Numerous filters, formulae, and other features enable users to analyze data effectively with Microsoft Excel. Asa matter of fact, this is the very tool we all perhaps get to learn in our schooldays. 

RapidMiner

As the name suggests, RapidMiner is an excellent data analytics tool used for data mining. Data mining includes scopes such as visualizing, filtering, structuring, storing, and managing big data. 

QlikView

QlikView is a self-service business analysis tool that you should learn to be at par with the most recent trends in data analytics. Samsung and CISCO are among the tycoons that use QlikView for data analytics.

Apache Spark

Apache Software Foundation came up with one of the most useful data analytics tools that empower users with multiple features. Above all, this is an open-source application used by Visa, Oracle, and other big names. 

Talend

If you are eyeing a data integration tool, then Talend is the suitable solution for you. Talend incorporates an ELT backbone which ensures the safety and simplicity of the interface. 

Splunk

Splunk is among the widely used data analytics tools to visualize, filter, and analyze raw data. It is favored and trusted by 92 of the top Fortune 100 companies.  

Tableau

Tableau offers you a simple, user-friendly interface to work with a cluster of structured and unstructured data. It is one of the rare tools that allows you to work on live data sets. 

Datapine

If you want to get a grasp of data analytics, you should start with a simple yet effective analytics tool. Datapine is one of those tools that allows beginners to work with a large scale of data without complicating things.  

SAS Forecasting

Data forecasting or data prediction is an important part of data analytics. For example, you may need to predict a stat for the future based on available current data. SAS Forecasting is the ideal tool to do such things easily.  

Best Data Analytics Certification Course

Data analytics is a topic that has earned a reputation in and outside India as one of the vital operational wings of the business. Competent data analysts are placed in big national and international agencies with handsome salaries. Thus, students often look for the best data analytics certification course. Imarticus has an integrated post-graduation course on data analytics that prepares trainees for a bright future. 

Data Analytics Course with Placement

You should learn data analytics from a reputed institution that offers you a data analytics course with placement opportunities. 

Placement immediately after the course will boost your morale and also introduce you to the real world of data analytics. You will get to know how the giants of industries run their businesses with the power of effective data analytics.  

Building a data analytics project with Python? Here are a few tips

Building a data analytics project with Python? Here are a few tips

corporate training

We are in a technology-driven era where everything is based on data and the reports or insights derived from data. The scope for a data analyst is increasing day by day and if you want to learn data analytics and gain the foundation knowledge of data science for business application then we’re here to provide you with the first step towards your goal. You will get your desired data analytics course with placement.

What is data analytics?

Data analytics is the procedure of thoroughly going through the data and examining it in groups and sets. It is done to find the trends and draw certain conclusions based on the information they have. With more technological advancements, Data Analytics is majorly done through various software, systems and techniques.

For the most part, Data Analytics refers to an array of applications that works through fundamental business intelligence, online analytical processing and reporting. Hence, the use and importance of Data Analytics in business can never be understated.

Data Analytics and python

As data analysis is done for finding out the future course of action in any organisation or business, it also encompasses various programming languages. The use of various programming languages helps organisations to make decisions more precisely and efficiently. 

The use of python in data science and analytics is not unknown. Data scientists use various programming languages including python to prepare data for statistical analysis. Python is also used in other fields as well rather than only Data Analytics which also proves to be very effective for any organisation.

Python is used for general purposes and provides three major advantages which have been enumerated as follows:

  • More readable when compared to other programming languages.
  • Simpler to work with and compile data.
  • More flexible in the learning phase of the language and easy to understand.

Uses of python in Data Analytics

Python has become one of the most popular and widely used programming languages in the world in recent years. Its uses range from machine learning to building web pages and also to software testing. Python is a general-purpose language and its usage is wide enough to cover data science, software and web development, automation, etc. 

Python can be used for the following purposes in an organisation:

  • Developing web pages and software.
  • Automation on scripting.
  • Data analysis and data visualisation.
  • Software testing and web development.

The main focus of the scores is python’s usage and data analysis and machine learning. Python has become a basic requirement for data analysts and scientists to conduct complex statistical calculations in data science. It also has to create data visualisation, create machine learning algorithms, analyse and compare data, etc.

Data analysts and data scientists use the graphic visualisations that python builds. The visualisations include graphs, charts, histograms, and flowcharts that give an official representation of the data that has been assessed. Based on that data the future course of action for the organisation will be taken by the authorities.

Python also has a lot of libraries that can help programmers code programs for data analysis more quickly and efficiently. It helps the data to become more concise and precise.

Essential Tips

Here are some essential tips for building a data analytics project with Python:

  • Use a python cheat sheet for syntax.
  • Clean and rid your data of noise.
  • Use Python’s interface and the available plugins to prepare the data without the need to write too much code.
  • Use an online compiler for projects such as Google Collab that can run your project in real time.
  • Use libraries such as pandas, NumPy, Tensorflow, PyTorch, SciPy and scikit-learn.
  • Use Matplotlib for visualisations.
  • Format and structure your target data for efficient analysis.
  • Use statistical methods for handling and processing your data.
  • Use nested list comprehension to get rid of for loop complexities. 

Conclusion

Data analytics is a great discipline to be a part of and to have a successful career. Previously data was collected from a single source in a standard format but now as data science has become more advanced, data is collected from multiple sources and the requirement of data scientists and data analysts is increasing day by day. Learn Python online training course with Imarticus and kickstart your career towards growth. We offer courses with placements for your bright future.