5 Essential Skills for Effective People Leadership

Welcome to the dynamic world of leadership, where a symphony of success is produced when passion, purpose, and people come together. 

Leadership is about constructing a tapestry of trust, empathy, and understanding, not about donning an authority tiara. It’s an art that calls for skill, style, and bravery. Fear not, though, for we possess the treasure map that marks the way to the pinnacle of leadership ability.

Whether you’re a seasoned manager or just starting your leadership journey, honing these essential skills will make you a more effective people leader.

This blog examines the five fundamental abilities that provide the groundwork for exceptional people leadership. These abilities are the very essence of what makes a leader tick. As your compass, we’ll help you navigate the areas of effective communication, emotional intelligence, flexibility, conflict resolution, and trust-building.

Therefore, these abilities will help you succeed whether you are an experienced team captain or an aspiring helmsman. Prepare to discover the mysteries enabling you to lead with charm and elegance.

Motivating Teams: The Importance of Leadership

The top leadership skills in 2023 will allow leaders to navigate our increasingly complex and uncertain world. In the dynamic world of American academic circles, leadership is defined as an alluring dance of social influence in which an individual skillfully enlists the support and cooperation of others to accomplish a common and morally admirable goal. Leadership ultimately manifests as an engaging power play in which one’s skill as a “leader” inspires change and advancement in the minds of the “followers.”

Leadership traits for motivating teams

There are a variety of leadership qualities that may inspire teams. The Importance of Emotional Intelligence in Leadership is the capacity to understand and manage one’s emotions, as well as the emotions of others. It is a crucial ability for leaders because it enables them to create strong bonds with their team, inspire and encourage them, and make wise choices under duress.

Among the most significant are:

  • Vision: A competent leader can communicate their team’s vision to others. This provides a feeling of direction and purpose for the team members.
  • Communication: Effective team motivation requires effective communication. In addition to listening to and addressing team members’ needs, leaders must be able to convey their vision effectively.
  • Empathy: Leaders with empathy are aware of the wants and worries of the people on their team. They can establish rapport and trust, which are crucial for motivation.
  • Trustworthiness: Team members must have faith in their captains. This calls on leaders to treat team members with integrity, fairness, and consistency.
  • Encouragement: Team leaders should encourage their teammates to attempt new things and take calculated risks. This demonstrates that leaders have confidence in their team members’ skills and promotes a supportive workplace atmosphere.

Leaders should recognize team accomplishments of all sizes. This demonstrates that team leaders value the effort put out by their members and encourage them to keep working hard.

What are the 5 Essential Skills for Effective People Leadership?

Effective Leadership Skills for Managing People:

  • Effective Communication

Communication is the backbone of an effective relationship, and in leadership, it plays a crucial role. As a people leader, you must convey your ideas noticeably and concisely. Being an active listener is equally important. Understand the thoughts, concerns, and feedback from your team members genuinely. You can establish a healthy and effective work atmosphere where everyone feels heard and respected by encouraging open and honest communication.

  • Empathy and Emotional Intelligence

Empathy is understanding another person’s feelings and viewpoints by placing oneself in their situation. It goes hand in hand with emotional intelligence, which involves recognizing, understanding, and managing emotions in yourself and others. Effective people leaders leverage empathy and emotional intelligence to connect with their team members on a deeper level, building trust and rapport. By acknowledging and addressing their emotional needs, you create a cohesive and motivated team that can overcome challenges together.

  • Adaptability and Flexibility

In today’s fast-paced world, change is constant, and as a people leader, you must be adaptable and flexible. Embrace new ideas, technologies, and methodologies that can enhance productivity and efficiency within your team. By demonstrating a willingness to adapt, you set an example for your team members, encouraging them to embrace change positively. This adaptability enables your team to navigate uncertainties and keeps them motivated even during challenging times.

  • Conflict Resolution

Conflict is an inevitable part of any group dynamic. As a people leader, your role is to mediate and resolve conflicts constructively. Instead of avoiding conflicts, address them promptly and fairly. Listen to all sides, and encourage open dialogue to find common ground. By effectively managing conflicts, you foster a harmonious and cooperative work environment, which leads to increased creativity and better problem-solving within the team.

  • Delegation and Trust-building

Successful leaders understand the importance of delegating tasks to the right individuals and trusting them to do the job. Micromanaging can demotivate team members and hinder their growth. By assigning responsibilities based on individual strengths and skills, you empower your team and show them that you have faith in their abilities. Trust-building is a continuous process that involves supporting your team, providing constructive feedback, and recognizing their achievements.

The Final Words

To become influential leaders, individuals must embrace an unending journey of self-improvement and wholehearted commitment to comprehending and uplifting their team members. You can also create a positive and motivating work environment where everyone thrives by developing strong communication skills, empathy, adaptability, conflict-resolution abilities, and trust-building. 

Introducing the transformative program by Imarticus Learning – a power-packed journey to equip participants with the knowledge and prowess to master the art of human resource management in the ever-evolving business landscape. Prepare for an engaging encounter that explores a wide range of cutting-edge subjects.

This People Leadership Program covers everything, from deciphering the complexities of job analysis and design to developing proven methods for attracting and keeping people.

Discover the alchemy of encouraging staff growth via training and development, embrace the techniques of performance management and evaluation, and explore the mystics of creating alluring compensation and benefits packages.

Remember, leadership is not about being in charge; it’s about caring for those in your charge and inspiring them to achieve greatness together. So, step up and start developing these essential leadership skills today!

Text Mining and Text Classification Techniques

With the increasing popularity of textual data over the Internet, it has become imperative to provide a definitive outline to this unstructured data, and extract information to upgrade user experience. The storage, processing, and analysis of data, is now applied to text sources like blogs, web pages, and other digital literature to detect patterns, trends, and debates. Such procedures are collectively grouped under the term text mining and text classification.

For those who wish to pursue a career in data science, they can upskill themselves by learning more about text mining and text classification techniques.

What is Text Mining?

A type of data mining, text mining involves the use of various methods and techniques to retrieve previously concealed information from unstructured textual data and find patterns that would contribute to decision-making. Several techniques from different applications of computer science, such as information retrieval, statistics and machine learning are used to process the data.

Text Mining Techniques

Information Extraction

Also known as IE, it is the most reliable form of text mining technique that involves extracting information from massive chunks of unfiltered and unsorted data that is in textual form. Let us say a text is largely unstructured and one needs to find out its meaning. 

It can be deciphered via information extraction techniques whereby keywords, main features, certain entities and their interlinks are identified within the text and the newly-gained information is stored within an associated database for processing and reference in a later timeline.

Information Retrieval

Although information retrieval might sound similar to Information Extraction, the difference lies in the process of extraction of information. Unlike information extraction, where textual data is collected first, and then analysed for detecting patterns, in information retrieval, we already have a given textual parameter, such as a given set of keywords or key phrases to be detected. 

For this purpose, text miners harness diverse kinds of algorithms for monitoring the behavioural pattern of consumers and gathering relevant data accordingly. Query or question-based algorithms used in popular search engines for catering to trends and for collecting relevant information based on web searches on the internet are major applications of information retrieval. 

Categorisation

Under this text mining technique, free format or independent texts are allocated to predefined classes or a set of topics depending upon the inputs and outputs generated by the content. This process makes use of approaches such as dimensionality reduction and pre-processing so as to instruct classifiers in sorting the text into user-defined categories with the help of some familiar examples. 

Once trained in this manner, classifiers can categorise unrecognised examples with much ease.  Naïve Bayes Algorithm and Support Vector Machine Algorithm are some of the functional models used for categorisation in machine learning.

Clustering

As the name indicates, clustering sorts text documents into certain groups or “clusters” by identifying the basic structure of the arrangement of textual information. In this method, the algorithm extracts some similar patterns from the given textual data, organises them either downwards from the top or from the bottom to upwards. 

Consequently, in one cluster, the assorted documents will evince an extremely high percentage of similarity and there will be high contrast among the clusters. In other words, the quality of the outcome generated by a clustering algorithm will be determined by the number of clusters generated with high intra-cluster similarity and significantly low inter-cluster similarity. 

Summarisation

The primary aim of text summarisation is to reduce the length and simplify the complex details of a textual document without compromising on vital information. Using summarisation techniques for text mining, one can determine whether a text document is worth perusal for a reader. 

The algorithm searches through numerous text sources, prepares their summaries and keeps the original meaning the same.

Text Classification

Text classification is a subset of text mining and it involves allocating a number of predefined labels to a certain textual information. It involves analysis of the topic, detecting the language of the text, identifying the tone and intention to filter spam or toxic data or to understand customer reviews- all to obtain critical insights about textual data. We have provided some of the most popular text classification techniques which perform the aforementioned tasks.

Types of Text Classification Techniques

Sparse Vectorisation

This is a standard approach to text classification whereby a text document gets converted into several vectors and then it is classified using machine learning algorithms like logistic regression. The process of converting a text passage into a vector can be achieved by using the term frequency-inverse document frequency. 

For a set vocabulary, this algorithm will generate a one-dimensional vector corresponding to each word in the vocabulary. Every part of the vector will reflect how many times the corresponding word appears in the input textual information when compared to a group of textual passages.

Dense Vectorisation

A major flaw in the sparse vectorisation technique of text classification is that it disregards the sequence of the words in the texts, as well as the factor that many words bear semantic resemblance to each other. Furthermore, if a word is polysemous in structure, that is, it offers multiple interpretations based on context, then sparse vectorisation fails to derive the contextual differences. 

In such a situation, dense vectorisation technique can be quite helpful as it helps address the aforementioned problems by mapping embedded sentences to real vector numbers with the help of a pre-trained algorithm for language representations.

Natural Language Inference

When the classes were previously unknown and there is no prior instance of training present, then natural language inference models can be employed for text classification. A text classification model which has been attuned to natural language inference will choose a text passage as the premise, and try to verify whether the premise leads to, nullifies, or provides a neutral relationship with the hypothesis defined by the class.

Conclusion

Text mining and Text classification techniques have become highly sought-after methods in various industries that rely on consumer data for providing service. From marketing to sales, financial services to healthcare, mining and classifying textual data sources using machine learning models can save a lot of time, and prevent losses.

To enhance their skills in designing data mining models and algorithms, professionals can enrol in a data analytics course or a data science course such as the Imarticus Learning’s Postgraduate Program in Data Science and Analytics and take a major step towards cementing their career in data science.

Streaming Data Analytics and Real-Time Processing

When Netflix arrived, it was the first sign of doom for DVDs. Customers could watch movies from their homes without the need to travel to a DVD store and rent or buy a movie. It was cheaper than DVDs because it gave consumers access to multiple movies.

The above example of streaming analytics shows its competitive advantage over traditional systems. This blog extensively explores data streaming and analytics. If you wish to have a career in data science, a sound knowledge of data analytics is a must.

What is Streaming Data Analytics?

Data that is in a constant flow of movement is called streaming data. Any action you perform, like a transaction or watching a web series, forms an event. Monitoring of the said events comes under streaming analytics.

Streaming data analytics can assist you in making decisions. You can find out which products the consumers are buying and use this to market similar products. Data streams are called event streams, whereas streaming analytics is termed event stream processing.

Why is Real-Time Processing Important?

Streaming data analytics involves real-time processing. The continuous flow of data must be processed in real-time so that users can take action. This digital data comes from many sources, such as smartphones, IoT (Internet of Things), online transactions, social media feeds, cloud applications, emails, and wearables.

Businesses must analyse vast volumes of data to keep a competitive edge. Failure to process data in real-time might delay further action. Real-time processing helps a company to mitigate risks as soon as they encounter them.

Benefits of Streaming Analytics

Some of the many advantages of streaming analytics are mentioned below:

Business Insights

Any abnormal business event will show up on the dashboard. Flagging of the specific event is essential to detect threats automatically. This strategy can also be applied to a company’s cybersecurity to track any abnormality for immediate investigation and subsequent resolution.

Cutting losses

Streaming analytics helps mitigate and even prevent losses pertaining to social media crises, security breaches, stock exchange breakdowns, production problems, and customer churning.

Data visualisation

Companies can monitor streaming data in real-time to find KPIs (Key Performance Indicators). They can find out minute-to-minute updates of the organisation by daily data monitoring. You can monitor data such as a system’s health, financial transactions, and field assets such as vending machines.

Create opportunities

Streaming data analytics helps companies grow their customer base and cut costs. It helps gain the trust of customers and retain loyal customers. This leads to the creation of product innovations, revenue streams, and updated business models.

Analyse routine operations

Streaming analytics helps a company gain instant insight into routine operations. Businesses can find out which products the customers prefer, how many customers use your website, which transport costs you the most fuel, and even detect what machinery is likely to stop working in a week.

Discover competition

Companies are always looking to gain a competitive advantage over others. Streaming analytics helps them set benchmarks quickly and discover the latest market trends. This proves helpful against competitors who might still be using time-consuming batch analytics.

Uses of Streaming Analytics

Streaming analytics has uses in several cases with continuous data flow. Some everyday use cases of streaming data are: 

  • Fraud detection
  • Troubleshooting systems
  • Customer activity
  • Location data
  • Artificial Intelligence and Machine Learning
  • Warehouse inventory management
  • Marketing and sale
  • Security Information and Event Management (SIEM)
  • Monitoring internal IT systems
  • Stock market analysis
  • Rideshare applications

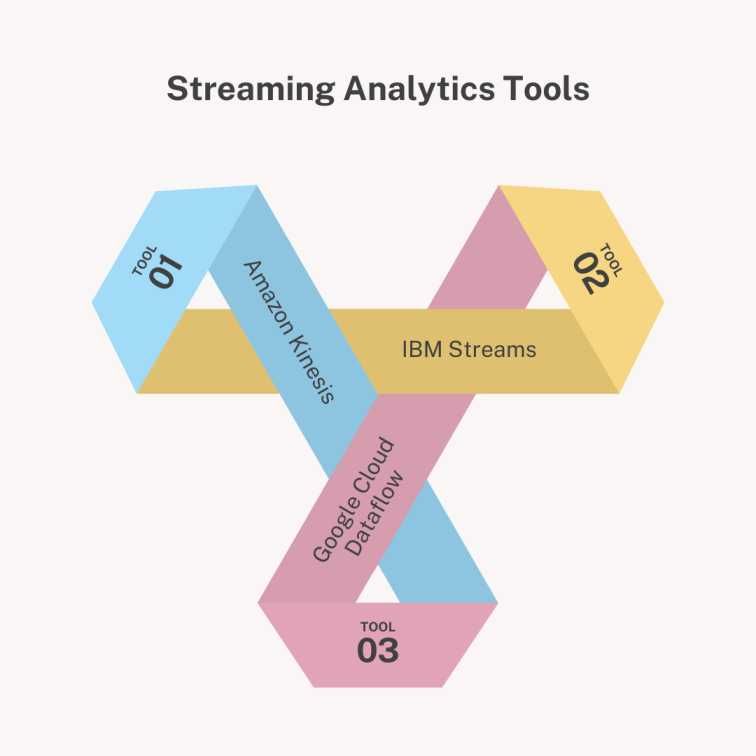
Streaming Analytics Tools

Streaming Analytics Tools

Among the vast number of streaming analytics tools available, below is a list of some of the most used ones.

1. Amazon Kinesis

This platform allows you to collect streaming data and process it in real-time. Kinesis lets you ingest audio, video, website clicks, and application logs data and analyse them. Amazon Kinesis consists of Kinesis Data Streams, Kinesis Data Analysis, Kinesis Video Streams, and Kinesis Firehose. It is flexible, allowing you to use tools as per your requirements.

2. IBM Streams

In IBM Streams platforms, you can use various streaming data such as audio, video, sensor, and geospatial. You can analyse chunks of data in real-time. Data scientists can build models where they can apply stream flows. Rich data connections, data visualisation, and development support are some of the features of IBM Streams.

3. Google Cloud Dataflow

This popular platform offers serverless architecture for streaming data. You can use Google Cloud Dataflow for full management service and automated streaming resource provision. Maximising resource utilisation and autoscaling of worker data are some features of Dataflow. Other features include dynamic work rebalancing, flexible pricing, and ready-to-use artificial intelligence patterns.

Conclusion

Streaming data analytics is the way forward. As batch processing is slowly taking a backseat compared to real-time processing, data scientists must adapt to the changes.

Consider enrolling in Imarticus Learning’s Postgraduate Programme in Data Science and Analytics to gain the first steps toward a career in data science. This data science course allows students to participate in national-level coding hackathons, boosting their resumes and helping them stand out in the competition. Data science training is crucial for becoming a data scientist or data analyst. 

Visit Imarticus Learning for more information.

Predictive Analytics for Customer Churn Prediction

Detecting the possibility of cancellation or disconnection of service by a customer is known as churn prediction. Churn, or churn rate, is the quantification of the number of customers that have cancelled their subscriptions. It is calculated over a specified time period, usually on a monthly basis since most payment-oriented subscriptions have a monthly renewal scenario. 

Churn prediction is crucial for most businesses given the numerous benefits of conducting the measurement, including identifying the target audience and market compatibility. Predicting customer churn and preventing the possibility of revenue loss builds up the added potential for every business. Hence, knowledge of churn rates has a significant impact on your company’s revenue generation. 

You can build a career in data science by enrolling yourself in data science training on renowned platforms such as Imarticus and learn more about prediction strategies.

What Does Churn Factor Stand for?

Churn factor displays the customer churn after considering the activity frequency of consumers. A customer with a high churn factor usually represents an already churned consumer. It can be defined by simply dividing the activity frequency of a customer by the quantitative time since the last activity of the same. 

Considering every activity of the consumer in context can ultimately assist in creating a powerful but uncomplicated prediction of customer churn. Using churn factor analysis, you can attain a better understanding of customer behaviour. 

You can retain your customers for longer time frames upon gaining a clear perception of their behaviour and activity patterns, which can be attained by analysing the churn risk of your customers. Thus, calculating the churn factor can rapidly enhance the potential of your business. 

Importance of Customer Churn Prediction

The customer churn prediction process is a necessary calculation for every subscription business. It presents a fact of business life where even the slightest changes in churn rate might cause a significant impact on the business, leading to fluctuations in revenue collection. 

What is Customer Churn?

Understanding the source of consumer engagement is highly valuable in developing your retention policies. Customer churn is a major problem faced by businesses across different sectors, also known as customer attrition. Online businesses refer to a customer as churned when the latter ceases connection with the company or unsubscribes from the service. 

A service declares churned consumers when a substantial amount of time has elapsed since the last activity of the customer on the website. Customer churn also includes cases where the customer retracts their subscription. 

Benefits of Customer Churn Prediction

You can predict churn using an appropriate machine learning algorithm that calculates the churn risks of every single customer. The prevalent advantages of churn prediction are listed below:

  • It detects the accounts on the verge of getting churned and allows you to save them by adding the necessary support and suitable marketing strategies. 
  • Provides transparent insights about the user experience.
  • You get to identify the major pain factors by discovering the predominant friction points in the customer experience, such as if certain consumer accounts are unhappy with the overall features. 
  • Creates prime accounts for long-term relations, a target audience for cross-selling and upselling programmes, as well as growth opportunities in general. 
  • Churn analysis provides better outcomes in CS playbooks by optimising the tasks. 

Predictive Analysis in the Prediction of Customer Churn

What is Predictive Analysis?

The process of forecasting possible future outcomes using data analysis is known as predictive analysis. It uses machine learning, statistical computations, AI models, and data analysis to detect patterns in consumer behaviour.

Top Prediction Models in Customer Churn 

The machine learning models commonly applied in churn prediction are as follows:

  • Logistic Regression
  • Decision Trees
  • Bayes Algorithm
  • Linear Discriminant Analysis
  • Support Vector Machines

Major Steps in Predictive Analysis that Reduce Customer Churn

Customer churn analysis is actively used by IT analysts and data scientists to assist with the customer retention of a business. You can get a quick overview of the necessary tools for churn prediction from the list below:

  • Calculating the Churn Rates of Your Customers: The churn rate is a key performance indicator, or KPI, where you can calculate the KPI using the simple formula stated below:

100 x (Lost consumers ÷ Total consumers at the chosen beginning time)

It is necessary to maintain the accuracy of your churn rate since customer churn prediction portrays a direct impact on the business sales cycle.

  • Data Integration: You can generate predictions about the future of the business using predictive analytics for data analysis. 
  • Creating an Effective Churn Prediction Model: Upon training, you can use algorithms to point out inactive accounts and check for potential churner behaviours. 
  • Analyse the Churn Risk Score: Churn risk scores range from 0 to 100. Customer accounts with higher churn risk scores have greater chances of churn behaviour. The high churn risk score is 76-100, medium churn risk accounts depict a score of 51-75, and the low churn risk rate is 0-50. 
  • Consumer Segmentation: You can create well-tuned segments to form groups based on common features using machine learning algorithms. 
  • Applying a Suitable Cloud Data Platform: It provides a marvellous solution in the execution of customer churn prediction analytics. 

The Challenges in Customer Churn Prediction

The loss of consumer engagement over time, or churn rate, is one of the essential business metrics that can be tracked by the company. You can learn more about churn prediction analytics by opting for a career in data science and analytics.

Customer churn prediction includes a few obstacles, such as:

  • Changes in Stakeholders can alter past relations and consumer engagements.
  • The technique has to be accurate, which plays a critical role in the success of effective retention policies. 
  • Revenue generation might reduce due to retention-based discounts and offers. 
  • The predictive calculations need to be conducted on real-time data instead of static data to avoid the risks of inaccuracy.

Conclusion

Customer churn might cause a cost situation that includes losses in revenue, marketing costs, and customer replacement expenses. Reduction of the churn rates is a necessary growth factor for most online services and businesses.

You can gain a precise understanding of customer churn and other relevant topics by joining informative online tutorial programs. If you wish for a career in data science, you can opt for a data science course or a data analytics course such as Imarticus’s Postgraduate Program in Data Science and Analytics. Data analytics courses such as these can help you can learn more about predictive analytics and predictive analysis models.

IoT Analytics and Sensor Data Analysis

IoT (Internet of Things) analytics and sensor data analysis are extremely essential and interesting sub-domains in one’s career in data science. With the proliferation of connected devices and sensors in various industries, there is a growing need for professionals who can effectively analyse and extract insights from the vast amount of data generated. In this article, we will explore the role of IoT analytics and sensor data analysis in detail. We will also discuss the required data science training and skills, potential applications, and the prospects of this field.

IoT Analytics and Sensor Data Analysis: An Overview

IoT analytics involves analysing the data collected from IoT devices to gain insights and drive informed decision-making. This data can be obtained from a wide range of sources, including sensors embedded in devices, machines, or infrastructure. Sensor data analysis, on the other hand, focuses specifically on extracting valuable information from the data generated by sensors. 

In the realm of data science, IoT analytics and sensor data analysis play a crucial role in harnessing the power of the Internet of Things. By analysing sensor data, data scientists can identify patterns, detect anomalies, predict future outcomes, optimise processes, and enhance operational efficiency.

Applications of IoT Analytics and Sensor Data Analysis:

IoT analytics and sensor data analysis have wide-ranging applications across industries. Here are a few examples:

  1. Smart Manufacturing: In manufacturing, IoT analytics can be used to monitor machine performance, predict maintenance needs, optimise production processes, and ensure quality control.
  2. Healthcare: IoT analytics can aid in remote patient monitoring, predicting disease outbreaks, optimising hospital resource allocation, and improving patient outcomes.
  3. Transportation: Sensor data analysis can help optimise routes, reduce fuel consumption, enhance fleet management, and improve traffic management and congestion prediction.
  4. Agriculture: IoT analytics can provide insights into soil conditions, crop health, and water management, enabling farmers to make data-driven decisions and increase productivity.

Future Prospects of IoT Analytics and Sensor Data Analysis

The future of IoT analytics and sensor data analysis is promising. As the number of IoT devices and sensors continues to grow, the demand for skilled professionals in this field will increase. Organisations are recognising the value of IoT data and are actively seeking data scientists who can extract insights to improve efficiency, make informed decisions, and drive innovation.

Moreover, advancements in technology, such as edge computing, 5G networks, and artificial intelligence, will further fuel the growth of IoT analytics. Edge computing enables real-time processing and analysis of data at the edge of the network, reducing latency and improving responsiveness. 5G networks provide faster and more reliable connectivity, facilitating the seamless transfer of data from IoT devices. Artificial intelligence techniques, combined with IoT analytics, will unlock new possibilities for automation, predictive maintenance, and intelligent decision-making.

Skills Required for IoT Analytics and Sensor Data Analysis

Data scientists need to develop a diverse set of skills for IoT analytics and sensor data analysis. Solid data science courses or data analytics courses offered by reputed platforms such as Imarticus teach all of these skills. Here are some key skills required for success in this field:

Data Manipulation and Preprocessing:

Proficiency in collecting, cleaning, and preprocessing IoT and sensor data is crucial. This includes handling real-time streaming data, integrating data from various sources, dealing with missing or noisy data, and ensuring data quality.

Exploratory Data Analysis: 

Data scientists should be skilled in exploring and visualising IoT and sensor data. This involves applying statistical analysis, time series analysis, and visualisation techniques to gain insights and identify patterns.

Machine Learning and Predictive Analytics: 

Familiarity with machine learning algorithms and techniques is essential for developing predictive models, anomaly detection systems, and other intelligent systems. Data scientists need to understand and apply algorithms such as regression, classification, clustering, and deep learning to extract valuable insights from sensor data.

Big Data and Cloud Computing: 

Due to the vast amount of data generated by IoT devices, data scientists should know big data technologies and cloud computing platforms. This includes skills in handling distributed processing, storage, and scalable analytics using tools like Apache Hadoop, Spark, or cloud platforms like AWS or Azure.

Domain Expertise: 

Gaining domain expertise in specific industries or application areas is advantageous. Understanding the context, challenges, and requirements of industries such as manufacturing, healthcare, transportation, or agriculture enables data scientists to provide targeted solutions and insights.

Security and Privacy: 

With the increasing concerns about security and privacy in IoT, data scientists need to be well-versed in encryption techniques, data anonymisation, access control, and compliance with regulations such as GDPR (General Data Protection Regulation).

Importance of IoT Analytics and Sensor Data Analysis

IoT analytics and sensor data analysis are of utmost importance in a career in data science for several key reasons.

Firstly, the proliferation of IoT devices and sensors has led to an exponential increase in data generation. As a data scientist, having the ability to effectively analyse and extract insights from this data is essential to uncover patterns, detect anomalies, and derive actionable insights. This enables data-driven decision-making, optimisation of processes, and the ability to drive innovation within organisations.

Secondly, IoT devices often generate real-time data streams, requiring data scientists to analyse and respond to data in real-time. The ability to work with real-time data is a valuable skill in industries such as manufacturing, logistics, and healthcare, where immediate actions and decisions are crucial.

Furthermore, IoT analytics and sensor data analysis contribute to optimisation and efficiency. By analysing sensor data, data scientists can identify bottlenecks, predict maintenance needs, and optimise resource allocation. This leads to cost savings, improved productivity, and streamlined processes.

In addition, IoT analytics allows for predictive and prescriptive analytics, enabling data scientists to build models and recommend actions based on historical sensor data. This empowers organisations to proactively address issues, prevent failures, and optimise operations.

Finally, IoT analytics and sensor data analysis have diverse industry-specific applications. Understanding domain-specific challenges and requirements combined with data science skills allows data scientists to provide targeted solutions and insights in areas such as healthcare, manufacturing, transportation, and agriculture.

Conclusion

IoT analytics and sensor data analysis are essential in a career in data science due to the abundance of data, real-time decision-making needs, optimisation possibilities, predictive and prescriptive analytics capabilities, industry-specific applications, and the growing market demand for skilled professionals in this field.

If you wish to pursue this field, you can go through data science training with the help of data analytics certification courses or data analyst courses such as the Postgraduate Program in Data Science and Analytics by Imarticus.

What is Performance Management?

The definition of Performance Management is evolving with the modern period. Traditionally, it was a solution that could foresee future insight with the assistance of hindsight. Currently, companies and organisations are using performance management to predict future issues by identifying the problem with the current employees. 

The performance of every employee is scrutinised intensely with the help of performance management. Subsequently, if any employee lacks specific skills, special courses are held for them to correct their flaws.

This article will guide you to learn more about performance management and management accounting

Let’s dive in to learn more!

What do you mean by Performance Management?

The continuous cycle of communication between employees and managers is known as performance. This cycle also includes feedback from the managers to their employees so that they can easily achieve the target set by the company. 

In the present corporate world, performance management is used as a monitoring tool. This tool is only used by managers to analyse and look after the performance of their employees. The key aim of performance management is to create an environment where all employees can give their best and receive high-end outcomes without any hassle.  

Various Elements of a Performance Management Programme

Various performance management programmes comprise various elements. Companies choose these programmes according to their requirements. Here are the different kinds of elements a company can expect while installing a performance management programme:

  •  An excellent performance management programme must contain aligners that will guide the employees to correct their activities to sync with the main aim of the company. This would help a company to achieve its goals rapidly. 
  • Another important element of a performance management programme is evaluating the results from specific job designations.  A good performance management programme must know how to evaluate an employee’s work so that it is reaching the main target of the company.
  • The next important element of a performance management programme is to evaluate the expectations of a company by analysing the main outcome of the employees. This includes the methods that the employee has opted to complete his task and the quality of the outcome. It also tracks the performance and demeanour of an employee at the workplace.
  • A performance management programme should also contain an element that can easily create plans for job development. This will help an employee to develop and they can be easily supervised by their manager. This plan will assist a company to grow along with its employees.
  • An efficient performance management programme conducts daily meetings. This helps a company to evaluate rapidly by closely analysing the performance of managers and employees. Regular meetings are more effective than annual meetings as it allows them to detect errors and evolve properly. 

The Performance Management Cycle

There are five important steps in a performance management cycle. These steps are necessary for an efficient performance management programme to be completed. The five steps have been elucidated below:

Planning 

The initial phase of a performance management cycle is planning. In this phase, the final aim of every employee is decided. Subsequently, it is communicated to them. However, a company should disclose these goals to an employee after he has been legally hired. 

Tracking

The second phase is the tracking or monitoring phase. In this phase, the managers are instructed to closely scrutinise the performance of every employee so analyse how long would it take to reach the final goal. An efficient performance management programme will assist a company to evaluate its real-time progress as well as performance. An efficient performance management programme also assists a company to correct the errors that can hamper its progress. 

Developing

The third stage of the performance management cycle is development. This phase allows the employees to enhance their skills by closely studying the data that has been collected during the tracking or monitoring phase. The performance of employees can be enhanced by conducting special courses to increase their knowledge and skills. The skills of the employees can be enhanced by simply reassigning their roles to improve their performance.

Rating

The second last phase of the performance management cycle is rating. In this phase, all the employees are rated based on their performance so that at the time of appraisal they can be awarded correctly. These ratings are equivalent to the feedback given by the managers.

Rewarding

Finally, the last phase of the performance management cycle is rewarding. This is one of the important phases of the performance management cycle as it increases employee activity. Excellent performance by employees will help the company to reach its goal easily and rapidly. A company can reward its employees either monthly or annually. 

Significance of Performance Management

Performance management software is rapidly gaining popularity in the corporate world. Here is the importance of performance management that will help you to understand why companies are adopting it:

  • Performance management provides the managers as well as the employees with an insight they should expect during their appraisal. This will help them to work together to correct all the required changes and improve their overall performance. 
  • Performance management is important because it helps a company to predict its future by continuously tracking the performance of the employees. This helps a company to take precautions to safeguard itself from potential issues. 
  • Performance management helps a company and its employees to figure out their final goal. It adds more clarity to every job role and its final goal. This helps the employees to work with a better understanding and therefore increases productivity. 
  • Lack of communication between managers and employees often hinders the productivity rate. Therefore, performance management focuses on continuous feedback where managers, as well as employees both, can exchange feedback. This will help a company to achieve its goal rapidly.

Conclusion 

The demand for performance management software is increasing. Therefore, it is creating more scope for chartered accountants. One can also enhance their skills by enrolling themselves in an online course.

Imarticus Learning has brought a new ACCA course that will be beneficial for those individuals who are willing to learn more about performance management.

The course will be guided by learned mentors and also guarantees placement. So without any further delay enrol yourself.

Time Series Analysis for Financial Forecasting

Time-series is a series of data points taken in the order of time. Usually, these ‘points of data’ are taken at a sequential time period, thus making it a sequence of discrete-time data.

Time series analysis is a statistical method used on data collected over time. It pertains to studying the data’s trends, patterns, and dependencies to make predictions or uncover underlying relationships.

The data in time series is characterised by the temporal ordering of observations, where each data point is associated with a specific time stamp. Learning time-series analysis is a must for students seeking a career in data science.

This blog will explore financial forecasting briefly and how time-series analysis helps with financial forecasting, cite use cases and techniques. Keep reading to know more.

Financial Forecasting

Financial forecasting is a financial endeavour to forecast and estimate future financial outcomes using historical data, current trends, and relevant information.

It uses quantitative and qualitative approaches to forecast future financial performance, including revenue, costs, profits, cash flows, and various financial parameters.

The importance of financial forecasting in business, investments, and financial institutions cannot be understated, as it empowers decision-makers to make well-informed decisions and design careful strategies.

Companies can allocate resources aptly, establish financial objectives, evaluate prospects for investment, scrutinise the financial viability of ventures, gauge future financial exigencies, and craft strategies that foster financial performance optimisation by engaging in financial forecasting.

Applications and Techniques of Time-Series Analysis Used in Financial Forecasting

Time-series analysis is not limited to finance but finds its use in other fields such as signal processing, econometrics, pattern recognition, earthquake prediction, electroencephalography, communications engineering, and many more.

Let’s take a hypothetical real-world scenario to understand how time-series analysis works in finance. Suppose you own a trading firm and want to forecast the stock prices for a particular company.

All you have access to is the historical stock prices of the same company for the past several years. You want to use this data and predict future stock prices and provide your clients with informed decisions. Here’s how you would employ time-series analysis in forecasting stock prices:

Preprocess the data

The elements required to preprocess data include date stamps, timestamps, and opening and closing prices. Remove any inconsistencies or outliers and check for missing values.

Visualise the data

After the data has been pre-processed, plot this on a chart, for instance, a line chart, and observe the patterns, trends, and irregularities in the data.

Stationarity check

A stationary time series is one whose characteristics are independent of the observation time. Therefore, time series associated with trends or seasonality are not stationary since seasonality and the trend will change the time series’ value at different points in time.

Check for the stationarity of the time series by checking for the variance and the mean of the stock prices over time. You can also conduct statistical tests such as the Augmented Dickey–Fuller test (ADF).

If the data is not stationary, apply transformations such as differencing or logarithmic transformation to achieve stationarity.

Select a model

Select a suitable model to predict future trends in time-series forecasting. An example is the ARIMA (Autoregressive Integrated Moving Average) model. Other models include Exponential Smoothing (ES), Seasonal Autoregressive Integrated Moving Average (SARIMA), etc.

Fit the model

Once the model is selected, set the model parameters using historical stock price data.  A model fitting process involves finding the optimal values for the model’s parameters that minimise the difference between the predicted and actual stock prices.

Validate the model

After the model parameters have been tuned and fitted, validate the model. Using a separate validation dataset, compare its forecasts with the actual stock prices.

Assess the accuracy of the forecasts using metrics such as RMSE (Root Mean Squared Error) or MAE (Mean Absolute Error).

Forecasting

Once the model is validated, use it to generate forecasts for future time periods. You may input the most recent available data and predict future stock prices based on the model’s parameters. 

Evaluation and decision-making

Finally, evaluate the model’s performance by continuously comparing the predicted stock prices with the actual prices as new data becomes available.

Use these estimates and the corresponding risk to make investing decisions based on predicted price fluctuations, such as buying or selling stocks.

Refining the model

Keep improving the forecasting model by iterating and refining it based on new insights, updated data, or changes in market conditions.

You can incorporate additional features or variables, such as macroeconomic indicators or company-specific news, to enhance forecasting accuracy.

Conclusion

Make more informed decisions in financial forecasting by applying time series analysis techniques like ARIMA and regularly updating and refining the forecasting model.

If you wish to learn more techniques such as time series analysis that you can use in your lives for applications such as financial forecasting and more, consider enrolling in Imarticus’ Postgraduate Programme in Data Science And Analytics.


This data science course is curated for fresh graduates and professionals in their early careers with a technical background. Register for this data science training now and boost yourself with a career in data science.