Python for data science is the one skill I always recommend for anyone aiming to unlock the value of data, no matter their prior coding experience.
Today, Python powers everything – from Netflix recommendations to NASA’s spacecraft data. According to the JetBrains Developer Ecosystem Report 2024, more than half of data scientists use Python every day. And it’s not just for hardcore programmers – whether you’re a marketer digging into campaign results, a finance professional automating reports, or a student taking your first steps into tech, Python fits naturally into what you do.
With its readable syntax, vast ecosystem of libraries, and dominance in analytics, Python for data science is now the backbone of industry data science platforms, powering decision-making from healthcare to finance.
In finance, data science generates up to £1.02 trillion in annual savings; in manufacturing, maintenance costs decrease by 40%. Recent surveys show 66% of data scientists use Python regularly, and the language is the primary platform in data analytics and AI applications worldwide.
As this demand continues to grow, many learners choose structured learning paths such as a Postgraduate Program in Data Science & Analytics, where Python is taught from scratch and applied to real business problems rather than just theory.
In this guide, I’ll break down how to learn Python for data science step by step – even if you’ve never written a line of code in your life.
Fact!
Python for data science refers to using Python to collect, clean, analyse, visualise, and model data using libraries like Pandas, NumPy, Matplotlib, and Scikit-learn.
Why Python is the Data Science Leader
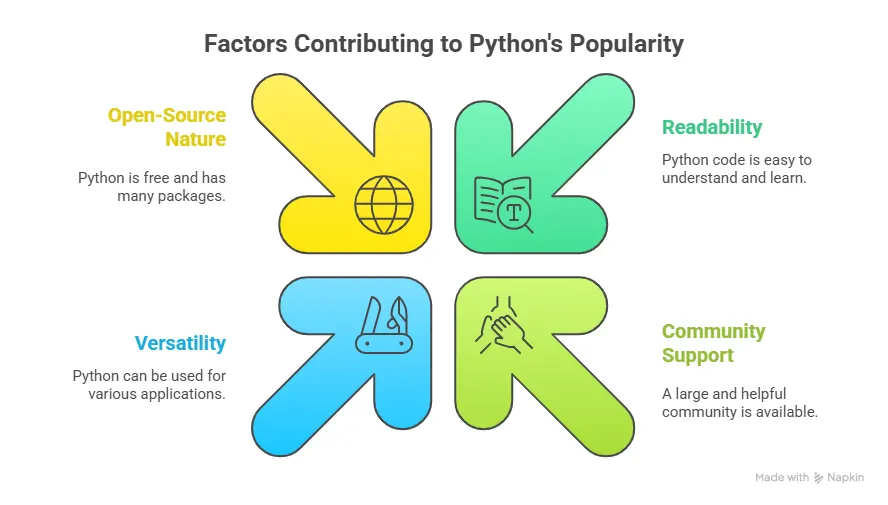
In 2025, Python continues to lead the way in data analysis and machine learning, staying ahead of alternatives like R and JavaScript. This shift comes down to several factors:
- Readability: As Jake VanderPlas writes in the Python Data Science Handbook, “Python code reads like plain English.” Even model training routines can be understood at a glance.
- Versatility: Python is “accessible enough for non-engineers, but powerful enough for production-grade pipelines”- a sentiment echoed by countless educators and professionals.
- Industry Use: According to KDNuggets, over 51% of Python users focus specifically on data exploration, ETL (extract, transform, load), modelling, and real-time analysis.
The most essential Python tools for data KDNuggets include Python libraries for data science:
| Python Library | Main Use | Beginner- Friendly? | ML Support? | Leading Tutorials |
| Pandas | Data cleaning & analysis | Yes | Yes | Yes |
| NumPy | Numerical computation | Yes | Yes | Yes |
| Matplotlib | Data Visualisation | Yes | Indirect | Yes |
| Scikit-learn | Machine Learning models | Moderate | Yes | Yes |
| TensorFlow | Deep learning & AI | Advanced | Yes | Yes |
Together, these tools support everything from simple spreadsheet analysis to advanced AI systems.
Did you know?
Platforms built around Python are expected to grow from $150.2 billion in 2024 to $174.1 billion in 2025, and the global big data analytics market is projected to reach $103 billion by 2027.
Why Python Is Perfect for Beginners
If programming languages were cars, Python would be the automatic – smooth, forgiving, and easy to drive.
Major companies such as Google, Netflix, and NASA rely heavily on Python for data science because it scales easily and integrates seamlessly with modern technologies.
According to the Stack Overflow Developer Survey 2024, Python remains the world’s most desired programming language – a clear signal that it’s both accessible and valuable for professionals across domains.
Popular Python packages for data science include Pandas, NumPy, Scikit-learn, TensorFlow, and PyTorch. Together, these libraries form the core Python frameworks for data science and machine learning, used in both research and production environments.
In short: Python is the Lego of programming – small, colourful, and endlessly customisable.
How Python Skills Can Boost Your Career
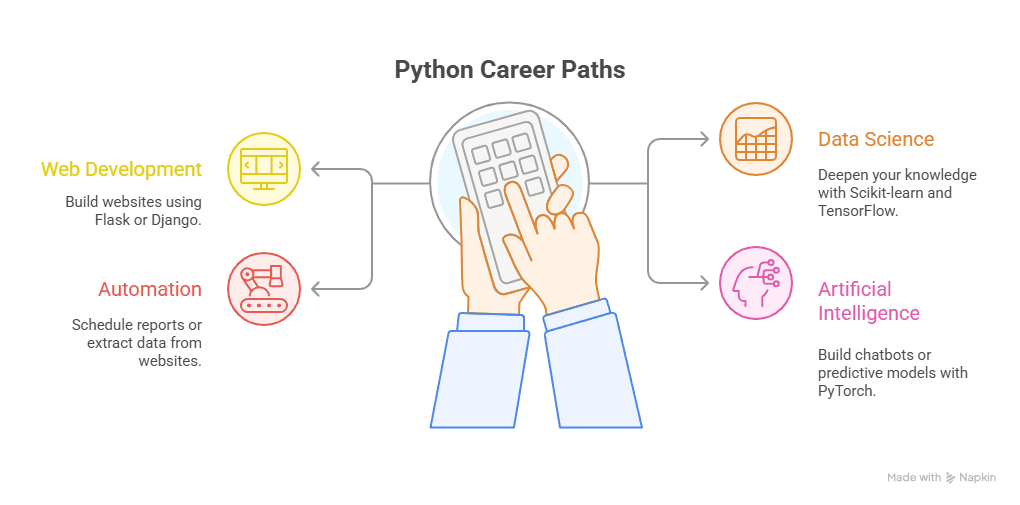
Let’s be honest – most of us don’t learn Python just for fun. We do it because it leads somewhere, especially into fast-growing fields like Python for data science, analytics, and AI. And the good news is that ‘somewhere’ can be almost anywhere.
Here’s how it changes the game in different fields:
| Industry | How Python Helps | Example |
| Finance & Banking | Automate financial reports, forecast trends, analyse risk, and perform real-time fraud detection. | Analysts use Python to build stock prediction models. |
| Marketing | Track campaign data, analyse customer sentiment. | Marketers scrape social media data to measure brand mentions. |
| Healthcare | It powers advanced medical image analysis and patient risk prediction to optimise hospital operations. | Python models help detect disease patterns. |
| E-commerce | Personalise product recommendations. | Amazon uses Python for recommendation algorithms. |
| Retail | Predicts supply chain needs. | Retailers use Python to forecast product demand and reduce stockouts. |
| Education | Build adaptive learning tools. | EdTech companies use Python for AI-based tutoring apps. |
A 2025 LinkedIn Workforce Report revealed that professionals with Python and data analysis skills earn up to 22% more than peers in the same roles.
So, whether you’re trying to automate daily tasks or transition into a tech-focused role, Python doesn’t just add a skill – it opens a door.
Did You Know? Learning Python programming for data science and machine learning builds skills that apply across analytics, AI, and automation roles.
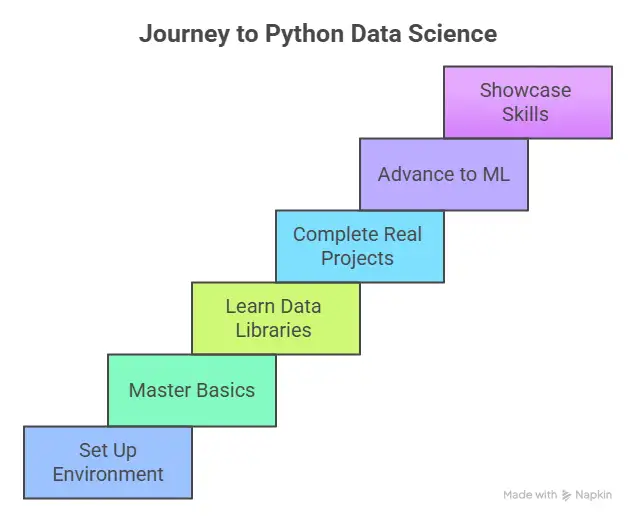
Step-by-Step Guide on How to Learn Python for Data Science
Here’s a clear and practical five-step roadmap for anyone wondering how to start – even without a tech background.
Step 1: Start with Python Basics
Before diving into big data or machine learning, or Python for data science workflows, start small. The Python basics – variables, data types, loops, and conditions – form the foundation of every project you’ll ever build.
Imagine writing a grocery list, now imagine doing it in Python. Instead of scribbling items on paper, you create a list that you can easily update, sort, or reuse. It’s a small task, but it shows how Python turns everyday tasks into something fun and surprisingly powerful.
Groceries = [“milk”, “bread”, “eggs”]
For item in groceries:
print(item)
That’s Python in action. This line simply means:
👉 Create a list called groceries and put three items in it.
If you spend just 20-30 minutes a day learning concepts like data types (numbers, strings, lists), conditional statements (if, else, elif), loops (for, while), functions and indentation.
Step 2: Practice with Small Python Projects
Theory without practice is like reading about swimming and never touching the water.
According to Harvard’s Learning Science Lab (2024), micro-projects and short learning bursts improve coding skill retention by up to 60% compared to reading tutorials alone.
Try building simple Python projects such as:
- Expense / Habit Tracker: log your daily spending, record workouts or reading habits.
- Weather App: fetch live weather data using an API.
Each project teaches you how to debug, think logically, and apply Python for data science fundamentals in the real world.
Step 3: Explore Popular Python Libraries
Once you’re comfortable writing scripts, it’s time to meet your secret weapons: Python libraries for data science. These are pre-built toolkits that make Python for data science work easier – the real reason Python is so powerful.
Here are some essential libraries to explore:
- NumPy: for mathematical operations and numerical data. Think of it as a calculator on steroids.
- Pandas: for working with spreadsheets, CSVs, and large data sets – your Excel replacement.
- Matplotlib: for data visualisation; helps turn rows of numbers into meaningful charts.
- Seaborn: an extension of Matplotlib, perfect for clean, attractive visualisations.
According to the Kaggle State of Data Science Report (2024), over 80% of data professionals use Pandas and NumPy daily.
You can practise by:
- Cleaning messy data in Excel using Pandas
- Plotting sales or website traffic with Matplotlib
- Summarising survey data with NumPy arrays
Understanding these libraries is like learning shortcuts that professionals use to save hours every day.
Step 4: Learn Python for Data Science
Once you’re confident with the basics and libraries, it’s time to understand how Python powers data science – one of today’s fastest-growing fields.
Data science combines statistics, visualisation, and machine learning to uncover insights from raw data – and Python makes all of this surprisingly beginner-friendly.
You’ll use:
- Pandas and NumPy for data cleaning and manipulation.
- Matplotlib and Seaborn for charts and visualisations.
- Scikit-learn for machine learning algorithms.
According to IBM SkillsBuild (2025), there’s been a 40% surge in demand for Python-based data roles in India alone.
If you enjoy storytelling through data, this is your domain. Start with analysing open datasets from Kaggle or Google Colab, and try to answer questions like: “Do people spend more online on weekends?”
Python gives you the tools to find the answers.
Step 5: Build a Portfolio with Real-World Python Projects
Your Python learning journey isn’t complete until you can showcase what you’ve built. A portfolio proves to employers that you can apply what you’ve learned.
Post your projects on GitHub or share interactive notebooks via Kaggle. Start with small but impactful ideas:
- Movie Recommendation System using basic data filtering.
- Fake News Detection Tool using text processing.
- Resume Shortlisting Script that scans CVs for keywords.
Working on Python projects for data science helps beginners apply concepts in real-world scenarios. Common beginner-friendly projects include data analysis dashboards, recommendation systems, and machine learning models built using Python.
Employers value proof of Python for data science skills more than certificates. A well-documented GitHub repository often says more than a résumé. Each completed project adds to your confidence and credibility.
Research from MIT Open Learning (2023) found that adults retain up to 70% more technical information when they apply concepts immediately through projects rather than passive reading.
Remember: your goal isn’t perfection – it’s progress.
Fact!
90% of enterprises deem data science essential for success, and 65% consider it crucial for decisions.
How Long Does It Take to Learn Python?
This is one of the most-searched questions online – “How many days to learn Python?” The honest answer: it depends on your pace, goals, and consistency.
Here’s a realistic roadmap:
| Stage | Focus | Average Duration |
| Month 1 | Learn Python basics | 30 days |
| Months 2-3 | Practise small projects | 60 days |
| Months 4-6 | Master libraries & build a portfolio | 90 days |
For complete beginners, one hour a day is enough to build confidence in Python for data science. Remember, consistency trumps intensity. A little progress every day adds up quickly.
Here’s a smarter approach:
- Learn from Mentors: Guidance matters. Having experts to review your code and projects drastically speeds up your progress. You learn to avoid bad habits early and think like a professional.
- Work on Real Data: Learning Python from real datasets (finance, retail, healthcare) gives your practice meaning and helps you relate theory to your field.
- Learn with Structure: Random YouTube tutorials can help, but they often skip the context needed for Python for data science. Structured courses – like the ones by Imarticus Learning – follow a curated roadmap that builds your skills in the right sequence.
- Join a Community: Collaborating with peers keeps you accountable. Sharing code, asking questions, and building together mirrors real-world teamwork.
- Track Your Growth: Document everything you build – even small scripts. When you look back, you’ll see how far you’ve come, which is the best motivation to keep going.
The industry is evolving incredibly fast, thus increasing the demand for experienced, skilled technical professionals. What tech professionals or even beginners need is to build the skills they need to succeed. If you prefer a guided, outcome-focused path, check out the Postgraduate Program in Data Science and Analytics with GenAI – where Python is taught from scratch with real-world business applications, mentorship, and placement support. It also provides 100% job assurance, hands-on projects, and access to GenAI-powered tools.
💡 Pro Tip: Combine free resources with accountability. Set a weekly goal or join a learning community – it keeps you consistent and motivated.
Expert Tips about Learning Python for Data Science
Even the best learners stumble. Here are four common traps beginners fall into in Python for data science – and how to sidestep them.
Focusing Too Much on Syntax: You don’t need to memorise every command. Understanding why the code works matters more than knowing what it says.
Ignoring Python Libraries Early On: Libraries save time and help you think like a professional. Don’t wait until you’re “advanced” – start using Pandas and Matplotlib early.
Not Building Projects: Tutorials feel safe, but real learning happens when you apply your knowledge. Projects create context and reveal gaps in understanding Python for data science concepts.
Giving Up Too Soon: Consistency is the secret ingredient. As James Clear writes in Atomic Habits, “Every action you take is a vote for the person you wish to become.”
So, write one more script. Fix one more error. That’s how mastery happens – one line of code at a time.
Here’s a quick snapshot of the framework:
Many professionals also pursue a Python for data science certification or structured bootcamp to validate their skills. Programs that combine Python, data science, and machine learning provide faster career outcomes than self-study alone.
“Data are just summaries of thousands of stories – tell a few of those stories to help make the data meaningful.” – Chip & Dan Heath, Made to Stick.
Which is Better for Data Science: Python or R?
When beginners compare Python vs R for data science, the question isn’t which language is better, but which one fits real-world work today. This quick tick-and-cross comparison shows where each language is commonly used – and why Python has become the default choice across most data science roles.
| Factor | Python | R |
| Beginner-friendly syntax | ✔️ | ❌ |
| Machine learning & AI | ✔️ | ❌ |
| Statistical analysis & Data visualisation | ✔️ | ✔️ |
| Production deployment | ✔️ | ❌ |
| Industry adoption | ✔️ | ❌ |
| Academic & research use | ❌ | ✔️ |
| Automation & scripting | ✔️ | ❌ |
| Broad career opportunities | ✔️ | ❌ |
Why Choose Imarticus Learning for Python for Data Science?
Python for data science isn’t hard – staying consistent and applying it correctly is. That’s where the right learning environment makes all the difference.
Imarticus Learning’s Postgraduate Program in Data Science & Analytics is designed for people who want more than scattered tutorials. It’s built to help beginners move from learning Python to using Python professionally.
Here’s what sets it apart:
Python Taught From Scratch – You don’t need a tech or coding background. The program starts from the basics and gradually builds toward data science, analytics, AI, and machine learning – always tying concepts back to real business problems in finance, marketing, healthcare, and more.
Hands-On, Project-Driven Learning – Instead of just watching tutorial videos, you get the opportunity to work on live projects using real datasets. From data cleaning and visualisation to predictive modelling, you build skills the same way professionals do -by solving actual problems.
Industry-Aligned Curriculum – The curriculum is designed to reflect what companies actually expect from data professionals today. You don’t just learn tools required in Python for data science – you learn how they’re used in the real world, making the transition from learning to working much smoother.
Mentorship That Keeps You Moving – One of the biggest reasons learners drop off is a lack of guidance. Imarticus provides experienced mentors who review your work, clarify concepts, and help you think like a data analyst – not just a student.
Strong Career & Placement Support – Beyond technical skills, the program focuses on career readiness – resume building, interview prep, and placement assistance with leading organisations. The goal isn’t just learning Python; it’s using Python to build a career.
Structured Pathway – Instead of jumping randomly between topics, you follow a clear, step-by-step roadmap – from Python basics to advanced analytics and GenAI tools – helping you avoid the common tutorial trap.
If you’re serious about turning Python for data science into a long-term career skill – not just something you tried once – a structured, mentor-led program like this can make the difference between stopping halfway and actually breaking through.
FAQs about Python for Data Science
To ensure we cover the vast expanse of using Python for Data Science, let’s look at some of the frequently asked questions about the topic.
Is Python useful for data science?
Yes. Python is the industry’s first choice for data science – from data analysis and visualisation to automation and machine learning. Employers, universities, and global research bodies all treat Python as a core skill for modern analytics roles. That’s why most structured programs, including those at Imarticus Learning, use Python as the foundation for teaching data science.
Which Python version is best for data science?
Python 3.x, paired with core libraries (Pandas, NumPy, Matplotlib, Scikit-learn, TensorFlow), supports all modern analytics and ML workflows.
What are the 4 types of data in data science?
Most data you’ll work with falls into four categories:
- Numerical (e.g., quantities)
- Categorical (labels, regions)
- Ordinal (ranked values)
- Time-series (chronological measurements)
Python excels at handling each, especially via Pandas and NumPy.
Python for data science handles all of these smoothly, especially through Pandas and NumPy, which is why learners practise extensively with real datasets in guided programs like those at Imarticus Learning.
Can I learn Python for data science in a month?
Yes – with consistency. Many beginners become comfortable with Python basics for data science within a month by practising daily and building small projects. That said, structured learning with mentorship – such as the approach used by Imarticus Learning – helps learners move faster, avoid common mistakes, and apply Python confidently in real-world scenarios.
How to Learn Python for Free?
The internet is overflowing with free Python resources – you just need a structured path to use them wisely. If you prefer interactive practice, try Google Colab – it lets you write and execute Python code directly in your browser without installation. Free learning has its limits, though. Without mentorship or guided projects, many learners plateau after the basics. That’s where structured learning programs become valuable (we’ll get to that later).
Can beginners learn Python for data science?
Absolutely. Python is designed to be readable and beginner-friendly, making it ideal for learners without coding or technical backgrounds.
What are common Python interview questions for data science?
Common Python interview questions for data science focus on data types, Pandas operations, data cleaning, basic statistics, and how Python is used for machine learning workflows.
References
- https://scoop.market.us/data-science-statistics/
- https://blog.jetbrains.com/pycharm/2025/09/why-is-python-so-popular/
- https://binariks.com/blog/data-science-trends/
- https://www.kdnuggets.com/7-python-statistics-tools-that-data-scientists-actually-use-in-2025
- https://nationalcareers.service.gov.uk/job-profiles/data-scientist
Elevating Your Data Journey
Python for data science stands alone as the single most valuable upskilling choice today. Python is easy to start with, powerful enough to grow into, and in demand across every industry. That combination gives you quick entry into real, meaningful analytics work – not just theory.
Learning Python is one of those rare career moves that stays useful as you grow. It often begins with a small win – a few lines of code that save you time – and before you realise it, you’re thinking more clearly, solving problems faster, and approaching your work with a lot more confidence.
Python’s USP lies in clear syntax, free community resources, and seamless scalability from first project through to enterprise solutions. Now is the moment to act: those embracing Python for data science today are positioned for career growth and innovation well into the future.
But here’s the truth: most people stop at the tutorial stage. They watch, read, and follow along… but never actually build anything that sticks. They watch a few videos, try a few exercises, and stop just before things get interesting. What separates those who truly grow is structure, mentorship, and community – the three things that make learning stick.
And if you’re ready to move beyond learning and start applying your skills in the real world, this is the right moment to begin.
Take the next confident step by enrolling in our Postgraduate Program in Data Science & Analytics – where practical mastery of Python for data science awaits. It is designed for learners who want to go beyond the basics and make Python their career edge.