


Last Updated on 9 months ago by Imarticus Learning
Are you earning enough for the risks you’re taking?
That’s the one question every investor, portfolio manager, or finance student needs to answer. You might have posted a great return.
But what if the market handed you that on a silver plate? What if your portfolio took twice the risk of another for the same return? Without the right metrics, you wouldn’t even know.
This is where the risk adjusted return comes into play.
In this post, we’ll break down what is risk adjusted return, the formulas that matter, and how professionals use these metrics to judge whether the returns are worth the risk.
What Is Risk Adjusted Return?
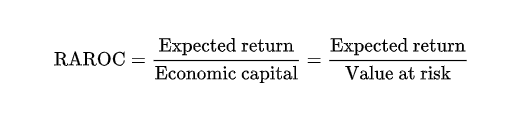
Risk-adjusted return on capital (RAROC) is a method of determining the profitability of a certain entity after considering the risk. It is, therefore, useful to help assess financial performance because the returns are basically compared to risk exposure, providing a consistent and clear analysis of profitability within various divisions of a business.
Why Simple Returns Are Not Enough
A 15% return looks great until you realise the market did 20%, and your portfolio took double the risk. Or worse, it had huge ups and downs along the way.
Most basic return figures ignore volatility, market sensitivity, or downside risks. That’s where risk-adjusted return shines.
It lets you:
- Compare apples to apples, even if risk levels differ.
- Reward consistency over just high numbers.
- Identify which fund managers add actual skill, not just luck.
Without these adjustments, performance reviews are incomplete. And for those in financial risk management courses, mastering these measures is a must-have skill.
Popular Risk Adjusted Return Formula
In India, there isn’t a single fixed figure for the risk-adjusted return on capital (RAROC) in 2025. Still, market trends and sector-specific performance offer useful context. Small-cap mutual funds have faced notable losses this year, with some dropping by as much as 18%.
Each formula highlights different kinds of risks: total risk, downside risk, market risk, etc.
Here are the most widely used ones.
1. Sharpe Ratio
Formula:
(Return – Risk-Free Rate) ÷ Standard Deviation of Return
Best for comparing portfolios or funds, assuming returns are normally distributed.
A higher Sharpe Ratio means better returns for each unit of risk. It’s perfect when you want a quick overview of performance vs volatility.
2. Sortino Ratio
Formula:
(Return – Risk-Free Rate) ÷ Downside Deviation
Focuses only on bad volatility (losses).
Investors care more about downside risk than upside volatility. The Sortino Ratio makes this distinction.
3. Treynor Ratio
Formula:
(Return – Risk-Free Rate) ÷ beta
Good for portfolios with systematic risk exposure. It uses beta (market risk), unlike Sharpe, which uses total risk. Especially useful when portfolios are well-diversified.
4. Jensen’s Alpha
Formula:
Actual Return – Expected Return (via CAPM)
Helps understand a manager’s value over market movements. Alpha shows how much return is due to skill, not market movement.
| Metric | How It’s Calculated | Type of Risk Considered | Common Use |
| Sharpe Ratio | (Portfolio Return – Risk-Free Rate) ÷ Standard Deviation of Return | Overall (Total) Risk | Comparing general portfolio performance |
| Sortino Ratio | (Portfolio Return – Risk-Free Rate) ÷ Downside Deviation | Downside (Negative) Risk | Analysing performance with a focus on losses |
| Treynor Ratio | (Portfolio Return – Risk-Free Rate) ÷ beta | Market Risk (Systematic) | Evaluating portfolios exposed to the market |
| Jensen’s Alpha | Portfolio Return – [Risk-Free Rate + Beta × (Market Return – Risk-Free Rate)] | Market vs Actual Return Gap | Measuring fund manager’s added value |
When and How to Use These Metrics
Each formula serves a different purpose.
Here’s how professionals use them practically:
- Sharpe Ratio: Ideal for mutual funds or comparing ETFs.
- Sortino Ratio: Used when investments are highly volatile or focused on capital protection.
- Treynor Ratio: Used by hedge funds or managers handling high-beta portfolios.
- Alpha: Used by firms to evaluate whether active managers justify their fees.
Comparing Risk-Adjusted Metrics
Here’s a quick bar chart comparing sample values for each metric to help you visualise how they stack up:
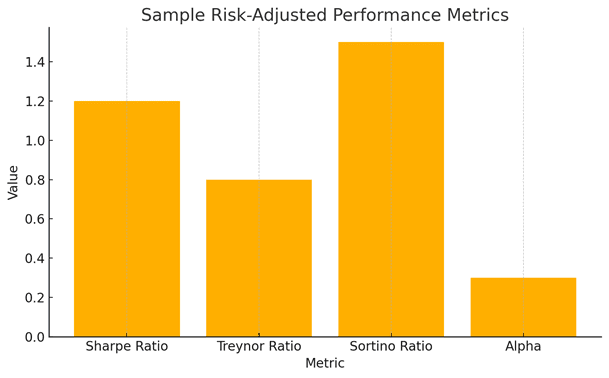
The bar chart shows how different funds or portfolios might score differently based on the metric used, even if they deliver the same raw return.
Build a Career in Financial Risk: Join the FRM® Course
Are you looking to build a career in portfolio risk management?
Understanding these metrics is step one. However, mastering them and applying them in live markets requires expert-led training.
That’s where the Financial Risk Manager (FRM®) Certification by Imarticus Learning comes in.
Recognised globally, this certification builds your credibility across finance, risk, and investment domains. With over 90,000 professionals certified across 190+ countries, FRM opens doors in banks, investment firms, and consulting roles. You’ll learn real-world risk-adjusted return analysis, valuation techniques, and decision-making under uncertainty.
At Imarticus Learning, the FRM® course includes:
- Access to GARP-approved AnalystPrep platform
- 4000+ practice questions & 8 mock tests
- 300+ hours of expert-led sessions
- 1-on-1 doubt resolution and career bootcamp
FRM certification holders are often hired by Big 4 firms, global banks, and top asset managers. If you’re serious about becoming a risk leader, this course will set you apart.
Take the next step in your financial career.
Join the FRM® Certification by Imarticus Learning and gain the skills hiring managers seek in risk professionals.
FAQ
Q1. What is risk adjusted return?
Risk adjusted return is the profit earned relative to the level of risk taken, helping compare investments on a like-for-like basis.
Q2. Which is the best risk adjusted return formula?
There isn’t one best formula. The Sharpe Ratio is common, but Sortino and Treynor work better in specific contexts.
Q3. Why is risk adjusted return important in financial risk management courses?
It shows the quality of return, not just quantity, which is something every FRM candidate must know.
Q4. Where is the Treynor Ratio used?
In portfolios exposed to systematic (market) risk where beta plays a role.
Q5. What is Jensen’s Alpha used for?
It evaluates fund manager performance after adjusting for market movements.
Q6. Can I calculate risk adjusted return in Excel?
Yes. Most formulas require historical returns and standard deviation or beta inputs.
Q7. Is risk adjusted return included in the FRM exam?
Yes, it’s a core topic in portfolio risk and performance analysis modules.
The Final Words
Knowing your return is only half the story. It is knowledge of the risk of that particular return that makes a smart investor and a lucky one.
It does not matter whether you are dealing with your personal money, doing a financial risk management course, or planning to do the FRM exam. You need to have control over risk adjusted return.
