

Have you ever looked at a massive spreadsheet and thought, “How do I even begin to group these customers, users, or patterns?” You’re not alone.
For data analysts and beginners stepping into machine learning, understanding how to organise unlabelled data is frustrating. You don’t want theory-heavy explanations. You want a hands-on approach that’s simple, practical and shows real results.
That’s exactly where k means clustering fits in. Whether you’re building recommendation systems, segmenting customers, or detecting anomalies, k means clustering algorithm simplifies complex data by breaking it into logical groups.
What is K Means Clustering and Why Does It Matter
K means clustering, which is a vector quantisation method first used in signal processing. It partitions n observations into k clusters, where observation is basically assigned to the cluster with the nearest mean (also called the cluster center or centroid), which acts as the cluster’s representative.
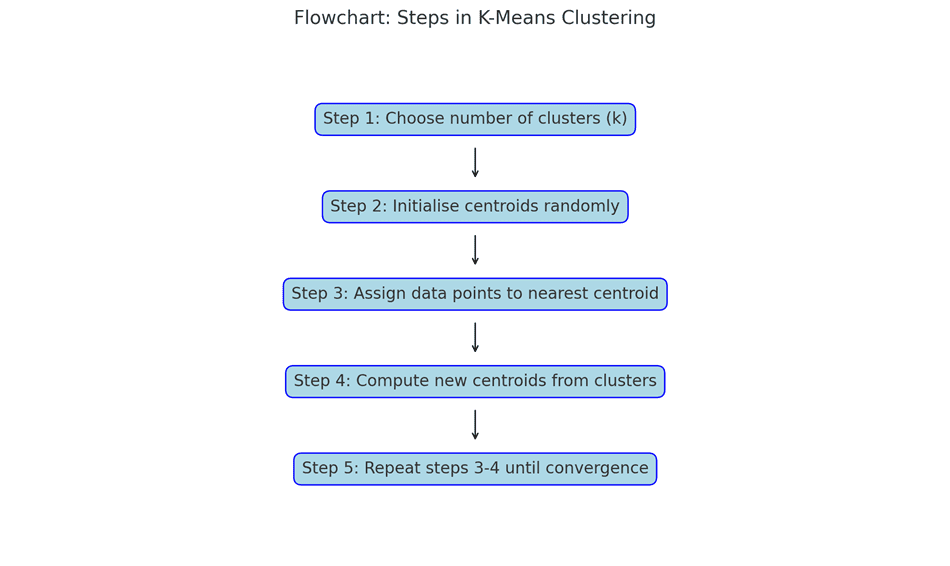
You tell the algorithm how many clusters (or “groups”) you want. It then:
- Picks some initial points (called centroids),
- Assign nearby data points to those centroids,
- Repositions the centroids based on the average of the assigned points,
- Repeat until nothing changes.
It’s clean, fast, and widely used, especially in marketing, finance, and recommendation systems. If you’ve ever used YouTube or Amazon, you’ve already seen this in action.
The k means clustering algorithm works best when the data naturally falls into separate groups. It’s used across sectors, from banking to telecom, where decisions need data-based segmentation.
Choosing the Right Number of Clusters
A common question: how many clusters do I need?
The answer? Use the Elbow Method.
The algorithm calculates “inertia” and how spread out the points are in each cluster. The more clusters you add, the lower the inertia. But at some point, adding more clusters gives very little improvement. That “elbow” point is your sweet spot.
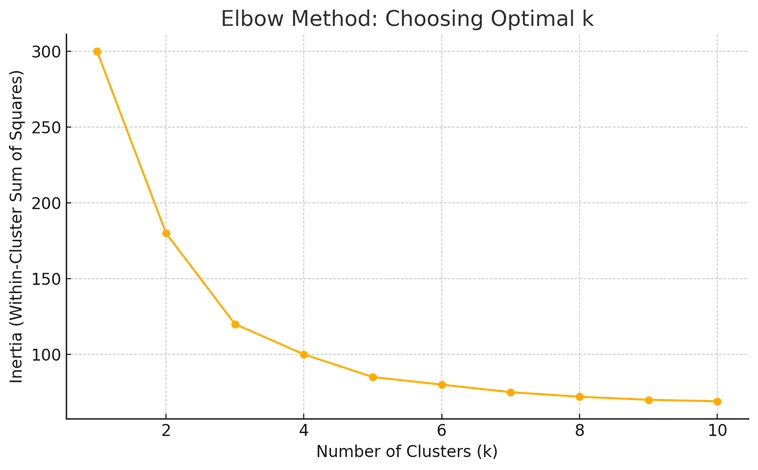
This is why many analysts plot inertia versus k. The curve tells you when to stop. In a Programme in Data Science and Artificial Intelligence, you’ll often use this graph before running any model.
K-Means in Action: A Simple Python Example
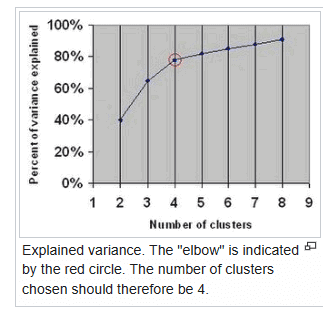
In cluster analysis, the elbow method helps decide how many clusters to use in a dataset. You plot the explained variation against the number of clusters, then look for the ‘elbow’ point where the curve starts to flatten. That point usually shows the best number of clusters.
Let’s walk through a basic k means clustering example using Python:
from sklearn.cluster import KMeans
import pandas as pd
# Sample dataset
data = {‘Income’: [15, 40, 90, 55, 75], ‘SpendingScore’: [39, 81, 6, 77, 40]}
df = pd.DataFrame(data)
# Running the algorithm
model = KMeans(n_clusters=3)
model.fit(df)
# Add cluster labels
df[‘Cluster’] = model.labels_
print(df)
This code assigns each customer into a group based on how much they earn and spend. Easy to follow. That’s the power of k means clustering with Python, it lets you build results fast.
When Should You NOT Use K-Means?
While it’s a great tool, k means clustering algorithm has limits:
- Doesn’t work well with non-spherical clusters.
- It can break with too many outliers.
- Needs you to guess the value of k (though elbow method helps).
- Doesn’t perform well if features have different scales.
So, always scale your data (using standardisation or normalisation) before applying it. And test with different k values.
Real-Life Use Cases: K-Means at Work
- Retail: Group customers into value segments for personalised promotions.
- Healthcare: Group patients based on symptoms or treatment responses.
- Finance: Spot unusual transactions that might indicate fraud.
- Telecom: Segment users based on usage patterns and churn risk.
Practical Example: Customer Segmentation
Refer to the table attached. It shows a common use case in customer segmentation using a k means clustering example.
With just two features, income and spending score, you can group users into three practical clusters: high-value, low spender, and mid-range. Each decision becomes data-driven.
| Customer ID | Annual income (₹000s) | Spending Score | Assigned Cluster |
| 1 | 15 | 39 | Low Income |
| 2 | 40 | 81 | High Value |
| 3 | 90 | 6 | Low Spender |
| 4 | 55 | 77 | High Value |
| 5 | 75 | 40 | Medium |
Tips to Use K-Means Efficiently
- Always standardise your data.
- Use the elbow method to decide k.
- Run multiple times to avoid poor initialisation.
- Don’t rely on it for non-linear problems; go for DBSCAN or hierarchical clustering instead.
These simple tweaks make a big difference in results.
Future-Proof Your Career with the Executive Post Graduate Programme in Data Science and Artificial Intelligence
Registering for a Programme in Data Science and Artificial Intelligence without knowing k-means is like trying to drive without a steering wheel.
At Imarticus Learning, the Executive Post Graduate Programme In Data Science & Artificial Intelligence gives you hands-on exposure to techniques like this. With a GenAI-powered curriculum, global capstone projects, and career support from over 2,500 hiring partners, you don’t just learn; you transition into high-demand roles.
You’ll also attend offline AI and cloud conclaves, work on real projects with over 35 tools, and get personalised mock interviews and resume support. All in an 11-month online weekend format.
That’s what makes Imarticus Learning stand out, not just content but real career outcomes.
Explore the Executive Post Graduate Programme In Data Science and Artificial Intelligence from Imarticus Learning today!
FAQs
1. How does the k mean clustering algorithm work?
The k means clustering algorithm works by first choosing k random points called centroids. Each data point is then assigned to the nearest centroid. After that, the centroids move to the centre of their assigned points.
2. Can you give an example of k, which means clustering in Python?
Yes. A simple k means clustering example in Python, which would be using customer data like income and spending habits.
3. Is k means clustering used in real-world businesses?
Yes. Many businesses use k, which means clustering, to improve customer targeting, detect fraud, manage inventories, or optimise services. For example, banks use it to group clients by risk level, while e-commerce platforms use it to show personalised product suggestions.
4. What is the ideal k value in k means clustering?
There is no fixed k value. The best way to choose k is by using the elbow method. This involves testing different k values and seeing which one gives the best balance between accuracy and simplicity. The ‘elbow point’ in the chart usually shows the right number of clusters.
5. How does k mean used in a programme in data science and artificial intelligence?
In a Programme In Data Science and Artificial Intelligence, k means clustering is a core technique in unsupervised learning. Learners practice real-life projects such as customer segmentation, anomaly detection, and pattern recognition. It’s one of the must-know algorithms in most data science curricula, including the one from Imarticus Learning.
6. Why is k means clustering important in data science courses?
Because it helps you work with raw data without labels, real-world data is often unorganised. K means clustering helps make sense of it by grouping similar entries. That’s why it’s a foundation skill in any Programme In Data Science and Artificial Intelligence, especially when working with business or user data.
The Final Words
K means clustering, which may sound like just another algorithm. But once you use it on your dataset, you’ll realise how powerful it is. It simplifies chaos. It helps you take the first step toward advanced analytics.
Start small. Try out the Python example. Tune it. Visualise it. Then scale up.
If you’re serious about building a future in data science, this is one tool you can’t ignore.