The Top 3 Financial Analysis Tools Every Analyst Should Master

Reading Time: 5 minutes

Introduction

Knowing your numbers is no longer enough in today’s fast-paced finance world. If you are an aspiring financial analyst or even a finance professional looking to advance your career, knowing the right Financial Analysis Tools can give you that winning edge. Financial Analysis Tools allow you to work smarter and not harder, enabling you to make data-driven decisions, develop thoughtful reports, and still allow you to create market-case scenarios. This post dives deep into the top three Financial Analysis Tools that every analyst should be familiar with—and why they are more important than ever.

Table of Contents

  • Excel for Financial Analysis
  • Power BI: Essential Tool for Data Analysis in Finance
  • Tableau: Visualizing Financial Insights
  • Comparison Table: Top Tools for Finance Professionals
  • Why These Tools Matter in Investment Banking
  • FAQs
  • Key Takeaways
  • Conclusion

Excel for Financial Analysis

Excel is the foundation of all financial modelling and analysis. Whether you’re projecting revenue or creating dashboards, this tool remains a non-negotiable in your finance toolkit. For students and professionals starting out in financial roles, learning Excel for financial analysis can set the stage for a solid and scalable career in finance.

Why Excel Stands Out

It is widely accepted and applied in almost every finance job, so it is a core skill that employers in all industries, such as investment banking, corporate finance, and consulting, require.

Provides robust formulas, pivot tables, and financial functions, which can be manipulated to analyse information, execute complicated computations, and create automated procedures for repetitive work.

Simple to audit and review models constructed upon Excel, offering traceability and transparency that is paramount at the time of financial reporting and in the instance where models require validation by teams or clients.

Key Features

  • Financial modeling
  • Scenario and sensitivity analysis
  • Budgeting and forecasting templates

Excel Tips for Financial Analysts

  • Use INDEX-MATCH instead of VLOOKUP for better flexibility and faster lookups, especially when working with large datasets where performance is critical.
  • Master conditional formatting for dynamic dashboards that visually highlight trends, anomalies, or thresholds, making data interpretation quicker and more intuitive.
  • Use Data Tables for quick scenario analysis, enabling you to test multiple assumptions or inputs and instantly see how changes impact your key financial metrics.

External Link:

Power BI: Essential Tool for Data Analysis in Finance

Power BI is more than just a data visualization tool. For finance professionals- it brings large, scattered data into a centralised, easy-to-read format. As one of the most essential tools for financial analysts, Power BI is used extensively in reporting, dashboarding & real-time data analytics.

How Power BI Elevates Analysis

  • Connects to various data sources like SQL, Excel, and cloud-based platforms
  • Interactive dashboards that update in real-time
  • Enables decision-making with advanced analytics

Use Cases in Finance

  • Budget variance analysis
  • Real-time tracking of KPIs
  • Automated report generation

Table: Power BI vs Excel

FeatureExcelPower BI
Real-time DashboardLimitedYes
Data Volume HandlingModerateHigh
Advanced VisualizationBasic ChartsInteractive Visuals

External Link:

Microsoft Case Studies: Power BI in Financial Services 

Tableau: Visualizing Financial Insights

Financial Analysis Tools

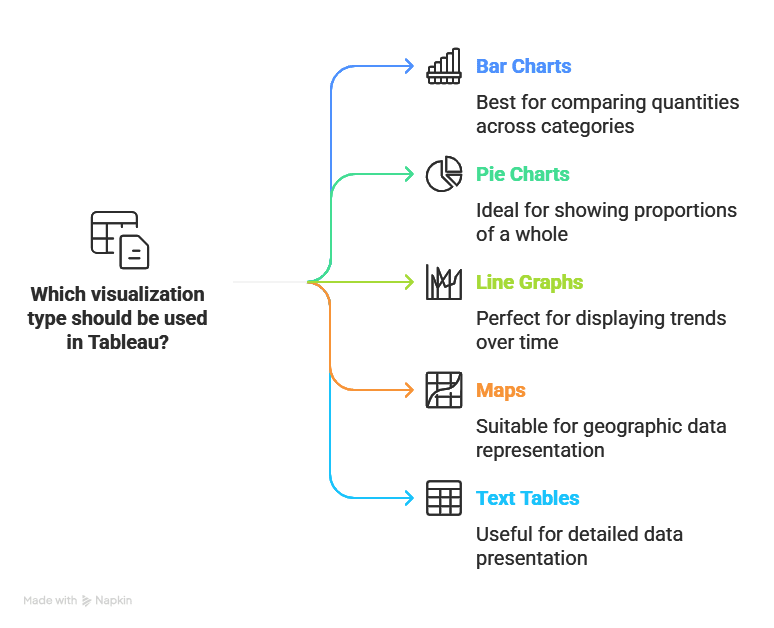
Tableau is all about transforming data into appealing stories. With Tableau, finance professionals can demonstrate insight in such a way that stakeholders quickly understand and act upon it. It is one of the best-used tools for finance professionals involved with communicating data to leadership or clients.

Why Use Tableau in Finance

  • Offers intuitive drag-and-drop features for visualization
  • Works well with large datasets
  • Ideal for building dashboards for top management

Use Cases in Finance

  • Revenue trend visualization
  • Profitability analysis by product or segment
  • Risk heatmaps and forecasting

Tableau Skills to Master

  • Building interactive dashboards
  • Creating calculated fields for financial ratios
  • Using storyboards for presenting investment insights

External Link:

Gartner Magic Quadrant: Tableau’s Leadership in Analytics 

Comparison Table: Top Tools for Finance Professionals

ToolBest ForEase of UseCostLearning Curve
ExcelFinancial Modeling, ForecastingHighLow (Free in many cases)Low
Power BIDashboards, ReportingModerateFree to ModerateModerate
TableauVisual AnalyticsHighModerate to HighModerate

These tools are often used in tandem for a complete financial analysis ecosystem. For instance, analysts often start in Excel, move the data to Power BI for dashboarding, and then use Tableau for executive-level visual storytelling.

Why These Tools Matter in Investment Banking

In the high-stakes world of investment banking, precision, clarity, and speed are non-negotiable. The use of investment banking software has evolved, and professionals must now go beyond traditional spreadsheets.

You know well how investment banking relies on precise valuation and strategic reporting for scenario-testing capabilities. The financial analysts who are astute with Financial Analysis Tools like Excel, Power BI, or Tableau can give faster, deeper, and more accurate insights and edge their competition. Mastering these tools has become an unfortunate necessity toward building a career. Today’s analysts are not just number crunchers—they’re storytellers, strategists, and data interpreters.

What Investment Bankers Use These Tools For

  • Equity research modeling
  • IPO valuation
  • Pitch book creation
  • Real-time performance dashboards

FAQs

1. What are Financial Analysis Tools?

 Financial Analysis Tools are software or platforms that help finance professionals- analyze, interpret, and present financial data for decision-making.

2. Why are these tools important for finance professionals?

 They help professionals gain insights quickly, present clear dashboards to leadership, and make decisions based on real-time data.

3. Can beginners learn these tools easily?

 Yes, platforms like Excel and Power BI offer tutorials, and popular edtech platforms like Imarticus Learning provide structured training courses on financial analysis.

4. Is Excel still relevant in modern finance roles?

 Absolutely, Excel remains the base for all financial modelling and is widely used in banks and finance firms.

5. How does Power BI differ from Excel?

 Power BI handles large data sets & creates dynamic, real-time dashboards, unlike Excel, which is best for modelling and static analysis.

6. What’s the cost of using Tableau in finance?

 While Tableau Public is free, enterprise versions can be moderately priced, depending on user count & features required.

7. Which tool is best for investment banking?

 Excel is the foundation, but Power BI and Tableau are excellent for reporting and visualization, respectively.

8. Do companies use these tools?

 Yes, most top finance firms and investment banks use a combination of these tools for robust analysis.

9. Can I get certified in these tools?

 Yes, certifications are available for all three tools and are often valued by employers.

10. How do these tools help in job interviews?

 Proficiency in these tools can help you demonstrate practical skills, especially when given case study-based interview rounds.

Key Takeaways

  • Excel, Power BI, and Tableau are the top 3 Financial Analysis Tools for every analyst.
  • Each tool has unique strengths—from modelling and dashboards to interactive visuals.
  • Mastering these tools opens doors in investment banking, corporate finance, and consulting.
  • Financial Analysis Certification and hands-on practice improve employability for students and finance professionals.

Conclusion

In today’s cut-throat finance industry- mastering Financial Analysis Tools is not just “nice to have” skill but rather a necessity. Be it for an investment banking role, or climbing the corporate finance ladder, the tools: Excel, Power BI and Tableau, offer the insight and edge you need. After all, tools are as effective as the person wielding them. So start learning, start applying, and watch your financial career soar.

The Best Financial Analysis Tools to Improve Your Financial Decision-Making

Reading Time: 4 minutesIn today’s fast-paced financial world, making informed decisions is crucial. Whether you’re a seasoned investor, a finance professional, or just someone trying to manage personal finances better, having the right financial analysis tools at your disposal can make a significant difference. 

The financial decision-making process is the way individuals or businesses make choices about money. This process includes several steps to help them find, compare, and choose from different financial options. It involves looking at financial information, considering the advantages and disadvantages of each choice, and making decisions that fit their financial goals.

This process can include many activities, such as planning a budget, investing money, taking out loans, and managing risks. Several factors can influence these decisions, including the economy, laws, and personal preferences. To make good financial decisions, it’s important to understand basic financial concepts and be able to make choices based on relevant information and careful analysis.

In this post, we’ll delve into some of the best tools available, how they work, and why they are essential for effective financial decision-making.

Why Financial Analysis Tools Matter

Before diving into specific tools, it’s important to understand why financial analysis tools are essential. These tools help you:

  • Understand Financial Health: They provide a clear picture of a company or individual’s financial status.
  • Identify Trends: Analyzing past and present data helps in predicting future trends.
  • Make Informed Decisions: Better data leads to better decisions, reducing risks and increasing potential gains.
  • Improve Efficiency: Automating complex calculations saves time and reduces errors.

What are the tools of financial statement analysis?

The act of examining and evaluating a company’s financial statements in order to make more informed decisions that would increase revenue in the future is known as financial statement analysis or simply financial analysis.

  • Ratio Analysis Tools

Ratio analysis is a cornerstone of financial statement analysis. It involves comparing different figures from financial statements to gain insights into a company’s performance.

Key Ratios Include:

  • Liquidity Ratios: Such as the current ratio & quick ratio, which measure a company’s ability to cover its short-term obligations
  • Profitability Ratios: Including gross profit margin and return on assets (ROA), which indicate how well a company is generating profit.
  • Leverage Ratios: Like debt-to-equity ratio, which shows the degree to which a company is also financing its operations through debt versus wholly owned funds.
  • Trend Analysis Tools

Trend analysis involves examining financial data over multiple periods to identify patterns or trends. Tools like Microsoft Excel or more advanced software like Tableau can be incredibly useful.

How to Use Trend Analysis Tools:

  • Data Visualization: Plotting data on charts or graphs to visualize trends.
  • Comparative Analysis: Comparing different periods to see growth or decline trends.
  • Forecasting: Using historical data to predict future performance.
  • Financial Modeling Software

Financial modeling also involves creating a summary of a company’s expenses and earnings, using spreadsheets to forecast future financial performance.

Popular Financial Modeling Tools:

  • Excel: The go-to tool for many analysts due to its flexibility and powerful functions.
  • Jira: While mostly a project management tool, it can be customized for financial modeling.
  • Oracle Hyperion: A powerful tool for more complex financial modeling and analysis.
  • Valuation Tools

Valuation tools help in determining the worth of a company or an asset. This is critical for investors looking to buy or sell stocks or for companies considering mergers or acquisitions.

Common Valuation Methods:

  • Discounted Cash Flow (DCF): Estimates the evaluate of an investment based on it is expected cash flows.
  • Comparative Company Analysis: Involves comparing the company to other similar companies.
  • Precedent Transactions: Look at past transactions of similar companies.
  • Budgeting and Forecasting Tools

Budgeting and forecasting are crucial for both businesses and individuals. These tools help in planning future income and expenses, ensuring that you stay on track financially.

Popular Tools for Budgeting and Forecasting

  • QuickBooks: Ideal for small businesses, it helps in tracking expenses and creating budgets.
  • PlanGuru: Offers more advanced budgeting and forecasting capabilities.
  • Adaptive Insights: Suitable for larger organizations with complex budgeting needs
  • Risk Management Tools

Risk management is also an integral part of financial decision-making. Identifying and mitigating risks can save companies from significant losses.

Tools for Risk Management:

  • Monte Carlo Simulation: Helps in comprehending how risk and uncertainty affect cost, project management, finance, and other forecasting models.
  • VaR (Value at Risk): Measures the loss in value of a risky asset or portfolio over an explained period for a given confidence interval.
  • Crystal Ball: An Excel add-on that provides powerful simulation and modeling capabilities.
  • Dashboards and Reporting Tools

Having real-time access to financial data through dashboards and reports is crucial for timely decision-making.

Leading Dashboard and Reporting Tools:

  • Tableau: Allows for creating interactive and shareable dashboards.
  • Power BI: Microsoft’s business analytics service provides interactive visualizations and business intelligence capabilities.
  • Zoho Analytics: A robust tool for creating insightful dashboards and visual analytics
  • Financial Planning Tools

For individuals, financial planning tools can help manage personal finances, plan for retirement, and achieve financial goals.

Recommended Financial Planning Tools:

  • Mint: A personal finance app that helps manage budgets and track spending.
  • YNAB (You Need A Budget): A budgeting app that encourages users to plan for every dollar.
  • Personal Capital: Provides tools for budgeting, tracking investments, and planning for retirement.

The Final Words

Incorporating the right financial analysis tools into your decision-making process can also significantly enhance your ability to make informed, strategic choices. Whether you are conducting tools of financial statement analysis for a business or using personal finance apps to manage your budget, these tools provide the insights needed to navigate the financial landscape.

To increase the benefits of these tools, consider investing in finance training. Understanding the fundamentals of financial analysis, accounting principles, and the specific functionalities of these tools will empower you to leverage them effectively.

Transform Your Career with Imarticus Learning’s Postgraduate Financial Analysis Program

Imarticus Learning, which has created an impressive 200+ hour Postgraduate Financial Analysis Program, has experienced over 45,000 job transfers. Graduates can change their professional professions with this program if they have three years of experience in the banking industry. Additionally, the finance training course will prepare students for CFA Level 1 positions, which are very common in this sector.

Included with the financial analysis course is a job assurance program that guarantees you seven interviews with prestigious finance companies. Prepare yourself with essential competencies, including Excel and PowerPoint fluency, financial statement analysis, modeling, valuation, stock research, and deal execution.

With our LinkedIn challenge and personal branding project, you may improve your professional image and gain a competitive edge in the employment market. Take the initial step towards a successful career in financeJoin the Postgraduate Financial Analysis Program at Imarticus Learning today and unlock unparalleled opportunities for growth and success. Apply now and secure your future in the finance industry!

What Are the Major Tools of Financial Statement Analysis

Reading Time: 3 minutes

Understanding the Financial Statements?

Financial statements can be understood as a formal way to record the financial activities of an entity. The reports comprise financial data that helps to determine the overall financial growth and strength of a company. It reflects the outcome of financial and business-related transactions of a company. The information presented in financial statements follows a rigid structure that helps to obtain information quickly.

Financial statements are primarily categorized into three categories that include a balance sheet, income statement or profit & loss statement, cash flow statements. Other types of financial statements include equity statement and comprehensive income statements. The financial statements also contain footnotes that provide extensive information on a range of subjects.

Tools & Techniques of Financial Statement Analysis

Financial statements contain vital relevant information that helps to assess the company’s financial standing. Financial analysts use various tools and techniques to analyze these financial statements and bring out important information that helps in better decision-making. It also helps to identify trends and patterns based on historical data. Let’s delve deeper into some important tools and techniques used to analyze financial statements.

Comparative Statements

Comparative statements are an important financial statement analysis tools that help to compare different elements of financial statements like Profit and Loss statement and balance sheets. It is used to compare the elements of these financial statements of two or more periods.
Two different comparative statements are prepared to facilitate the comparison of the balance sheet and profit & loss statements. The important elements that are used in comparison for Profit & Loss statements include gross profit, operating profit and net profit. These comparisons help the management to identify the pain points and implement necessary changes.

Common Size Statements

The common size statement tools take a vertical presentation approach to represent financial information. The interesting thing about common size statements is that it doesn’t include the absolute value; instead, it uses percentage form to depict the values. The determining factor or the value that is taken as 100% for the balance sheet is the total assets and revenue for the profit and loss statements.
For example, if the absolute value of sales or revenue is 200 and the profit amount is 100 then profit is recorded as 50% and sales are recorded as 100%. It shows a relation of individual elements as compared to the base elements. In this example, the relation states that the profit is 50% of the revenue.

Ratio Analysis

Ratio analysis is carried out to find meaningful relations between different elements of various financial statements. Ratio analysis is extensively used by financial analysts and business analysts to derive meaningful conclusion and hidden insights from these data points. It is used by both the internal and external parties conduct a financial analysis for a corporation. The main intent is to depict the performing aspects such as profitability, liquidity, solvency, etc.

Trend Analysis

In the trend analysis technique, the ratio of different elements are computed for multiple periods and if followed by a comparison between different periods. This helps to identify a trend or patterns based on the historical data for a company. It also helps to make future predictions following the same trend and identify winning patterns. After the analysis, an uptrend or downtrend pattern is recognized for different elements and necessary steps are taken to make it favourable.

Cash Flow Analysis

Cash flow analysis is conducted to determine the cash position of the firm, meaning it helps to determine the inflow and outflow of cash to and from the business. There are majorly two types of cash flows, actual cash flow and notional cash flow. It helps to understand how much cash balance a company needs to maintain to operate successfully without facing any cash-crunch issues.