Decision Trees and their Importance in Data Mining

Data Mining refers to the process of looking through vast data sets and extracting important information and substance about the major point of communication of the data. It is also the process of identifying hidden patterns in a particular data set that requires further division.

A Decision Tree is one of the major data mining tools that makes the process a lot easier. It is compatible with Python programming and works wonders in mining data. One of the advantages of using decision tree in data mining is that they increasingly help in converting raw data into useful and user-readable data.

Read on to gain all the insights about Decision tree in data mining as a tool and how they simplify the whole process.

Decision Tree in Data Mining

Decision tree in data mining is a popular method that creates models for the classification and division of data. The decision tree components include a tree-like structure having nodes, branches, and leaf nodes, hence justifying the name. It is also used as a regression model for making forecasts based on class labels and other attributes that aid in the decision-making process.

Advantages of Using Decision Tree in Data Mining

The concept of decision tree in Data Mining comes with the following benefits that showcase its importance in today’s world:

Decision Making

It is a very constructive algorithm that simplifies the decision-making process while extracting data. A decision tree can easily choose which data is important and which is irrelevant. It makes the process simple, and redundancy of work can easily be avoided.

Easy Understanding

A decision tree can also be in the form of data visualisation. This makes the process of data mining very easy for coders, as visualised data is easier to understand. Decision trees allow coders to easily fetch raw data from clients and perform the data visualisation algorithm. 

Cost-effectiveness

Decision trees are not very expensive. The multiplication of the sub-problem is conducted at every step of the mining process and chooses the relevant node for the extracted data. It automatically chooses the nodes based on logistic regression. Hence, it is a quick and cost-effective method.

Data Categorisation 

Decision tree in data mining are capable of drilling with both categorical and numerical data. It can also deal with multiple data sets at the same time. As a result, it solves the problem of multi-class categorisation at the time of mining data.

Reliability 

This method is completely based on a comprehensive analysis of each node and branch, and hence the data generated by it can be relied upon. The data can be run through statistical tests to prove its validity. It is also capable of determining accountability and, hence, becomes a reliable method of data mining. 

Little human intervention

Very little human interaction occurs during the preparation of data, which results in a reduction in the amount of time required for cleaning and mining data. Also, unnecessary human interference can create chaos, which this method refrains from doing.

Types of Decision Tree in Data Mining Algorithms:

The most popular decision tree algorithm, known as ID3, was developed by J Ross Quinlan in 1980. The C4.5 algorithm succeeded the ID3 algorithm. Both algorithms used a greedy strategy. 

Here are the most commonly used algorithms for the decision tree in data mining:

ID3

When constructing a decision tree in data mining, the entire collection of data S is regarded as the root node. The next step is to distinguish data from each set and iterate over every attribute. The algorithm runs through a verification process that adds properties after iteration. However, the ID3 algorithm is an old one, and it consumes a lot of time. It also possesses the disadvantage of overfitting the data.

C4.5

It is a more developed and sophisticated algorithm that categorises data as samples. In this algorithm, discrete values as well as continuous values can be simultaneously dealt with. The pruning formula in this algorithm eliminates the irrelevant branches.

CART

This algorithm can handle both classification and logistic regression tasks. The Gini index is an integral part of creating the decision tree. The splitting approach in the cell considerably lowers the cost function. It is one of the best approaches to dealing with regression issues.

CHAID

CHAID stands for Chi-square Automatic Interaction Detector which is the method that is suitable for working with any kind of variable and attribute. It can be either continuous, ordinal, or nominal variables. It is an advanced algorithm that involves the F-test.

MARS

MARS expands to Multivariate Adaptive Regression Splines. It is generally used where the data is present in a non-linear format. It performs regression tasks very well.
Data Science Course

Functions of Decision Tree in Data Mining 

Classification

Decision trees are effective instruments for data mining tasks, including classification. They use pre-established criteria to categorize individual data points into different groups.

Prediction

By evaluating input variables and determining the most likely result based on past data patterns, decision trees are able to anticipate outcomes. 

Visualization

Decision trees provide a visual depiction of the decision-making process, which facilitates users’ interpretation along with understanding of the fundamental reasoning. 

Feature Selection

One of the functions of Decision Tree in Data Mining is the ability to determine the most important characteristics or variables that support the categorization or prediction process.

Interpretability

Decision trees offer models that are clear and straightforward, making it possible for users to comprehend the reasoning behind each choice the algorithm makes.

Application of Decision Tree in Data Mining

Information specialists mostly employ decision trees to conduct analytical research. They are also extensively employed in businesses to analyse business challenges. The functions of decision trees in data science are as follows:

Health sector

Decision trees assist in the prediction of diseases and conditions in a patient’s health based on parameters like weight, sex, age, etc. Additional forecasts are also made, such as predicting a particular medicine’s impact on a patient, keeping in mind its composition and manufacturing history. The health sector is definitely one of the most important functions of a decision tree in data mining.

Banking sector

The banking sector uses decision trees to predict a borrower’s capacity to repay the loan amount. It helps in determining the eligibility criteria of the bank in advancing loans to the borrowers, considering their financial situation and their repayment ability.

Educational sector

Educational institutions also use decision trees to shortlist students based on their scores and merit lists. It can also help to analyze the payment structure of an institution and how its employees can be paid in a more viable way. Also, listing down the attendance of students can be done with the help of decision trees. This can be considered as one of the most important functions of decision tree in data mining.

Conclusion

Decision tree in data mining are used to create models. It is much like an inverted binary tree. The decision tree components comprise nodes, branches, and leaf notes that make it a decision tree. If you are keen to learn about the types of decision tree in data mining, then a data science course with placement can be a great choice.

A decision tree can be considered a very effective algorithm that mathematically represents human decisions. Enrol in the Postgraduate Programme In Data Science And Analytics by Imarticus and have a successful career in data science by learning all about the technique of decision tree in data mining.

Identifying Patterns, Trends and Relationships in Data: Time Series, Cluster, Correlation Analysis and More

Identifying patterns, trends, and correlations is an essential task that allows decision-makers to extract important insights from a sea of data. This blog digs into the complex art of identifying these critical characteristics in data, shining light on their importance in sectors such as banking, healthcare, marketing, and more.

Patterns are recurring sequences or groupings seen in data and are frequently hidden under the surface. They give the predictive possibility of future events by providing an elementary understanding of the underpinning structure.

Subsequently, recognising trends entails determining the trajectory of data points over time. This temporal viewpoint benefits forecasting and strategic decision-making.

Furthermore, data relationships, or the intricate connections between variables, are critical for understanding cause-and-effect dynamics. Identifying these relationships makes it easier to develop focused tactics and solutions.

If you are looking for a career in data science, keep reading to learn about various patterns, trends and relationships alongside their anomalies and characteristics.

This will help you to have a firm grasp of data analysis if you are seeking a data analytics certification course.

What are Patterns, Trends and Relationships in Data? 

Patterns, trends, and relationships are crucial concepts in data mining, each of which plays a unique role in revealing significant insights from complicated datasets.

Patterns: 

Patterns are recurring structures or sequences found in data. They are discernible patterns or similarities that can be discovered using data analysis tools.

Recognising patterns enables analysts to get a basic knowledge of data, which aids in predictive modelling and anomaly identification.

Depending on the nature of the data, patterns can take different forms, such as periodic cycles, clusters, or correlations. 

Trends:

Trends are the general trend of data points across time. They show how data values vary or evolve, both upwards, downwards, or relatively steady.

Detecting trends is critical for projecting future changes, making educated decisions, and comprehending process dynamics. Short-term or long-term trends offer insights into the underlying mechanisms in action.

Relationships: 

Relationships in data reflect links or interdependence between several variables or properties. Relationship analysis aids in the discovery of cause-and-effect dynamics, dependencies, and correlations.

Understanding these links is critical for making rational decisions and optimising processes in a variety of fields, including business, research, and healthcare.

How to Identify Patterns, Trends, and Relationships in Data? 

While taking up a data science course, one must be fairly aware of the steps to identify patterns, trends and relationships in data.

To have a budding career in data analytics, read to know about the steps to conduct a sound data analysis. 

Step 1: Define Goals 

Goals are explicit objectives or milestones defined to direct the data analysis process for discovering patterns, trends, and linkages in data.

These goals serve as actionable behaviours, leading analysts to methodically seek persistent patterns, monitor emerging trends, and discover important linkages within the data, allowing for the extraction of useful insights and informed decision-making.

Step 2: Choose Data Sources and Types 

The selection of proper data sources and types proves crucial for identifying patterns, trends, and linkages in data.

Databases, surveys, and IoT devices are examples of data sources, and data types include numerical, categorical, and time-series data.

Analysts ensure that the data matches the objectives of their research by proactively selecting appropriate sources and kinds, making it simpler to find important patterns, trends, and correlations within the dataset.

Step 3: Visualise the Data 

It is essential to use a methodical approach to find patterns, trends, and links in data. Begin by gathering and organising data. Next, use data visualisation tools like charts and graphs to uncover trends.

Examine data throughout time to identify temporal trends. Use statistical approaches to discover links and correlations between variables.

Finally, use machine learning algorithms or advanced analytics to elicit deeper insights, allowing for more informed decision-making and problem-solving.

Step 4: Apply Analytical Methods 

To conduct effective data analysis, one must use analytical methods to find data linkages and anomalies. These analytical methods are: 

  • Time Series Analysis 

Time series analysis is a resilient method for analysing data points gathered or recorded over time. It enables researchers to find temporal patterns and trends in financial market data, temperature measures, or sales information.

Seasonality, cyclic behaviours, and long-term patterns can be identified by analysing historical data points, which may be hidden in other methods of data analysis.

  • Cluster Analysis 

Cluster analysis, often known as clustering, is used to organise data points that are similar into clusters or segments.

This approach is essential for identifying natural structures within a dataset, allowing complicated datasets to be split down into more manageable subsets.

This strategy is widely used by researchers and analysts in a variety of fields, including marketing, biology, and social sciences, to find hidden patterns and categorise data pieces based on their similarities or dissimilarities.

  • Correlation Analysis 

Correlation analysis seeks to uncover correlations between various variables in a dataset. It measures how closely two or more variables move together, allowing researchers to assess if changes in one variable may anticipate changes in another.

This strategy is very useful for determining cause-and-effect linkages or determining which elements have a substantial impact on a result.

  • Factor Analysis 

Factor analysis is a statistical approach to discover underlying elements that explain data trends. It aids in data complexity reduction by revealing links between variables, simplifying interpretation, and reducing dimensionality.

This approach is extremely useful for analysing the hidden structure inside datasets, making it a powerful tool in a variety of study domains.

Step 5: Interpret and Communicate with the Method

 A rigorous approach is required to uncover patterns, trends, and linkages in data. Data collection, preprocessing, exploratory analysis, visualisation, statistical testing, and clear communication of findings are all part of this process.

Data interpretation and communication are critical for deriving meaningful insights.

Conclusion 

The ability to discern patterns, trends, and relationships within data empowers informed decision-making, enabling organisations to unlock valuable insights, make predictions, and optimize processes for a brighter future.

If you are searching for a fruitful data analytics course to become a data analyst, you can enrol in the Postgraduate Programme in Data Science and Analytics by Imarticus Learning. This data science training would build your data science and analytics career and will give you 100% job assurance. For more information, Get in touch via chat support on our Contact Us page. Alternatively, visit one of our training centers in Mumbai, Thane, Bengaluru, Pune, Chennai, Delhi, Gurgaon, or Ahmedabad.

Unveiling the Data Science Revolution: Why Data Science Courses are Trending

In the ever-evolving landscape of human knowledge, certain trends emerge like stars on a clear night, captivating our attention and igniting our curiosity. One such cosmic phenomenon in education and technology is the meteoric rise of data science courses.

Ladies and gentlemen, welcome to the Data Science Revolution, a journey that transcends the mundane and propels us into a world where numbers dance, algorithms sing, and insights are the treasure troves of tomorrow. In this blog post, we’ll don our data-driven space suits and explore why the pursuit of data science courses has become more than just a trend—it’s a transformative force that’s reshaping the way we see the world and shaping careers in unimaginable ways.

So, fasten your seatbelts and prepare to venture into the cosmos of data science, where the stars of innovation shine brightly and the galaxies of opportunity beckon.

Overview of the Data Science Industry

The data science industry is like a gold rush; data is the new currency. In the early 2000s, data science was still a relatively unknown field. But that changed in 2012 when Harvard Business Review declared it the “sexiest job of the 21st century.”

Since then, data science has exploded in popularity, becoming one of the fastest-growing professional fields in the world. And for good reason. Data is everywhere, and it’s growing at an exponential rate. Businesses need to be able to make sense of this data to make better decisions, and data scientists are the ones who can help them do that.

The data science industry is rapidly growing and evolving, with new trends emerging all the time. Some of the top data science industry trends in 2023 include:

  • The rise of (AI) artificial intelligence and (ML) machine learning
  • The growing importance of big data
  • The increasing use of cloud computing
  • The growing demand for data science professionals

Why Data Science Courses are on the Rise?

Data science courses are on the rise, and for good reason. Data is the new oil, and data scientists are the alchemists who can turn it into gold. In today’s data-driven world, businesses need data scientists to help them make sense of their data and make better decisions.

Data scientists are the alchemists of the digital age. They use their skills in computer science, statistics, and machine learning to turn data into gold. Data science is a relatively new field, but it is growing rapidly. This is because businesses increasingly realize the value of data and need data scientists on their teams to help them make sense of it all.

If you’re interested in a career in data science, there are many ways to get started. You can take a data science course, earn a degree in data science, or get certified in data science. Many online resources and tutorials are available to help you learn about data science.

Here’s a closer look at why this field is booming:

  • Data Pervades Every Industry: Imagine data as the lifeblood of industries ranging from healthcare to finance and entertainment. Data science allows us to extract meaningful insights from this sea of information, making it indispensable.
  • Cutting-Edge Technologies: The data science industry thrives on innovation. It’s a playground for cutting-edge technologies such as artificial intelligence (AI) and machine learning (ML), constantly pushing the boundaries of what’s possible.
  • Data-Driven Decision-Making: Companies now make data-driven decisions, from product development to marketing strategies. Data scientists are the wizards behind the curtain, turning raw data into actionable insights.
  • Endless Possibilities: Data science isn’t confined to one field. It has applications in healthcare (predicting disease outbreaks), finance (fraud detection), and even sports (player performance analysis).
  • Global Reach: The beauty of data science is that it knows no borders. Data scientists work on projects with global reach, making their contributions felt worldwide.

What are the Top Data Science Skills 2023?

In today’s data-driven world, data scientists are in high demand. But what are the top data science skills that you need to land your dream job?

Here is a creative take on the top data science skills in 2023:

  • Python is the most common programming language for data science, although other options include R, Julia, and Scala.
  • To comprehend and analyze data, data scientists must possess a solid foundation in statistics and mathematics.
  • Data scientists must be proficient in machine learning to create models to learn from data and make predictions.
  • Data visualization is a crucial ability for data scientists since they must be able to explain their results to both non-technical and technical audiences.
  • Data scientists need to be able to deal with big data technologies as the volume and complexity of data keep increasing.

What are the career opportunities in the Data Science Industry?

Now that we’ve painted a picture of the data science landscape, let’s dive into the career opportunities it offers:

  • Data Scientist: The rock stars of the data science world, data scientists, are responsible for gathering, analyzing, and cleaning data to extract valuable insights. They are in high demand across industries.
  • Data Analyst: Data analysts interpret data to answer specific questions or solve problems. They also play a crucial role in helping businesses make informed decisions.
  • Machine Learning Engineer: If you’re passionate about building AI models that can learn and make predictions, this role is for you. Machine learning engineers develop algorithms that improve over time.
  • Big Data Engineer: Big data engineers work with large, complex datasets. They create, erect, and maintain the infrastructure needed to handle and store enormous amounts of data.
  • Business Intelligence Analyst: These analysts transform data into actionable information for business executives. They create dashboards and reports to aid decision-making.
  • Data Science Manager: As you gain experience, you can step into leadership roles. Data science managers oversee teams of data scientists and ensure projects are on track.
  • Freelance Data Scientist: Data science isn’t limited to traditional 9-to-5 jobs. Many data scientists work as freelancers or consultants, taking on projects for multiple clients.

Advantages of Pursuing Data Science Courses

Now that you are acquainted with the opportunities, let’s explore why enrolling in data science courses is a smart move:

  • High Demand, High Salaries: The demand for data scientists far exceeds the supply, resulting in competitive salaries. It’s not uncommon to see six-figure salaries for experienced data scientists.
  • Versatile Skills: Data science certification equips you with a versatile skill set. You’ll learn programming, data analysis, statistics, and machine learning, which are valuable in various career paths.
  • Continuous Learning: The data science field is ever-evolving, and courses ensure you stay updated with the latest trends and technologies. Lifelong learning is a mantra in this industry.
  • Problem-Solving Skills: Data science is about solving complex problems. By pursuing courses, you’ll enhance your problem-solving abilities, which are highly transferable.
  • Global Opportunities: Data science is a global language. With the right skills, you can work for companies worldwide or remotely, offering tremendous flexibility.
  • Innovation at Your Fingertips: Data science courses expose you to the tools and techniques that drive innovation. You’ll be able to work on exciting projects that make a difference.
  • Diverse Applications: Data science isn’t confined to one industry. The skills can be applied to healthcare, finance, e-commerce, and many more, allowing you to explore your interests.
  • Job Security: In a world where automation threatens certain jobs, data science remains a haven. Human insights, creativity, and ethical considerations are irreplaceable in this field.
  • Interdisciplinary Opportunities: Data science often collaborates with other fields like biology (bioinformatics), astronomy (astrophysics), and social sciences (sociology). You can bridge the gap between data and diverse domains.
  • Impactful Work: Many data scientists find their work fulfilling as they contribute to solving real-world problems, from climate change modeling to disease prediction.

The Final Words

The data science industry is booming, offering many career opportunities to those who embark on this data-driven journey. From data scientists crunching numbers to machine learning engineers shaping the future of AI, the possibilities are endless. Pursuing data science courses opens doors to high-paying jobs and equips you with skills that transcend industries and geographies.

Open the doors to practical data science applications, then create analytical models that reshape how businesses operate. A data science curriculum offered by Imarticus Learning provides not just education but also a path to an exciting profession in data science and analytics. Whether you’re a new graduate ready to begin your career in data analytics or a working professional wanting to upskill and excel, this curriculum is intended to catapult you into the center of the data science revolution.

As you consider your career path, remember that data science is not just about numbers; it’s about making a tangible impact on the world. So, if you’re intrigued by the magic of turning raw data into actionable insights, take the plunge into data science. Your future self will thank you for it. Embrace the data revolution, and watch your career soar to new heights.

The Importance of Cloud Computing in Today’s World

The cloud consists of online software and services without physical hardware like local computers or on-site servers. In cloud adoption, organisations shift to save money, reduce risk, and scale their databases.

Different organisations adopt the cloud to different extents based on their needs.

How Does Cloud Computing Function?

Cloud computing is similar to leasing IT resources and data centres via the Internet. Rather than constructing and overseeing their IT systems, businesses can tap into storage and software offered by a cloud service provider. They are charged solely for their actual usage.

To better understand this concept, think of cloud computing in two parts: the front and backend. The front end permits users to access data and software stored in the cloud via web browsers or dedicated apps. The back end houses all the data on servers and computers.

For anyone interested in data science training, knowing about cloud computing is essential in today’s world.

How Did Things Work Before the Cloud?

Before cloud computing, you had to install every program and manage all your files on your device. It could quickly eat up your device’s storage and disrupt your work.

Cloud computing moved the core data infrastructure from your device to the internet. Instead of storing everything on your device, you store it online. Cloud computing isn’t just about storage; it also handles essential tasks like processing, streaming, and data management.

What Are Examples of Cloud Computing?

Some cloud computing examples are:

  • Education: Institutions of higher learning, such as universities and colleges, benefit from free services like Google Apps for Education (GAE), enhancing efficiency and reducing costs. This is particularly valuable for students pursuing a data science course.
  • Government: Governments use cloud-based IT services to provide e-governance services to citizens, improving transaction handling and reducing congestion bottlenecks.
  • Health care: Medical professionals use cloud computing for remote hosting of information, diagnostics, and global data sharing. This helps faster prescriptions and updates.
  • Big data analytics: Cloud computing supports data scientists in analysing large datasets, deriving insights, and making informed decisions. Tools like Hadoop and Cassandra  for big data are essential if you’re enrolled in a data analytics course.
  • Business process: Cloud-based solutions like ERP, document management, and CRM streamline business processes. Services like Salesforce and HubSpot enhance reliability by offering data redundancy.
  • Communication: Cloud-based communication tools, including email, calendars, and WhatsApp, rely on cloud infrastructure, ensuring seamless data storage and access for users.
  • Banking and financial services: Cloud storage is used for financial data and tax record backups, offering security and accessibility to customers.
  • Social networking and file storage: Cloud services like Facebook, Gmail, and Dropbox offer easy storage, backup, and synchronisation.

What Are the Typical Applications of Cloud Computing?

Cloud technology has numerous practical uses across different domains, including:

Collaboration: Cloud-based tools like Microsoft 365 and Google Workspace offer seamless cooperation internally and with clients, enhancing productivity and benefiting those aiming to become data analysts.

Storage: Cloud storage services like Amazon S3 and DropBox provide secure data access from anywhere, supporting businesses and individuals in their data analytics careers.

Database: Cloud databases offer flexibility, cost savings, and expertise, serving as a vital resource for data analysts as they manage and analyse data.

Web applications: Businesses rely on cloud-powered web apps to access and share information remotely, aiding professionals in their careers in data analytics by facilitating on-the-go communication and collaboration.

SaaS applications: Software-as-a-Service (SaaS) applications like Salesforce help businesses efficiently store, organise, and automate data, easing data management for aspiring data analysts.

Cloud technology is important for individuals pursuing a career in data analytics. It provides a toolkit and resources that boost communication, foster collaboration, and streamline data management.

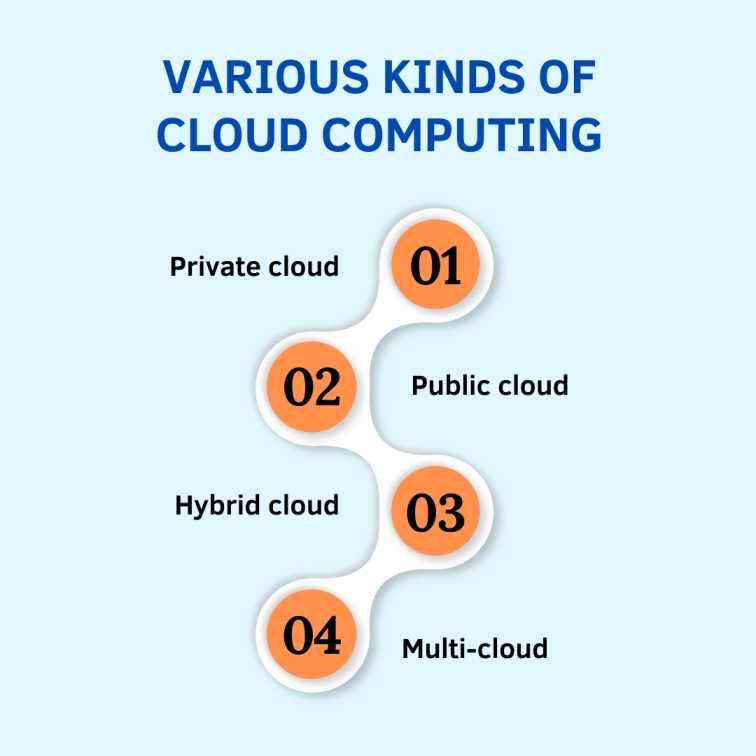
What Are the Various Kinds of Cloud Computing?

Various Kinds of Cloud Computing

Cloud Computing doesn’t follow a uniform model. Instead, it can be classified into four distinct categories depending on specific needs:

Private cloud

The IT infrastructure is dedicated to a single organisation in a private cloud. It prioritises security and control, often hosted in-house or managed by a third-party provider. Ideal for organisations with strict regulatory needs, it’s a key consideration for data science certification seekers.

Public cloud

Operated by external providers and shared by numerous internet users, the public cloud delivers services like IaaS, PaaS, and SaaS, catering to businesses and individuals.

Key players like AWS, Azure, Google Cloud, Alibaba Cloud, and IBM Cloud are pivotal for individuals seeking data analytics certification.

Hybrid cloud

Combining elements of both public and private clouds, the hybrid model allows businesses to scale their computing capacity by seamlessly integrating public and private resources.

It’s a cost-effective solution, sparing companies from the hassle of buying and maintaining new servers.

Multi-cloud

Multi-Cloud involves using multiple clouds, be they public or private, from various providers. This versatile approach enables organisations to pick the best-fit services based on their unique requirements, from data analytics to software development.

Benefits of Cloud Computing

Cloud technology presents a multitude of advantages, appealing to businesses of all sizes. These advantages include:

Enhanced collaboration: Cloud applications facilitate seamless communication and secure access to shared information, enabling effortless collaboration among team members. Multiple users can work on documents simultaneously.

Cost efficiency: Businesses can significantly reduce capital expenses as they don’t need to build their IT infrastructure or invest in hardware.

Data security: Cloud vendors prioritise data security by implementing advanced features such as authentication, access management, and data encryption to safeguard sensitive information.

Flexibility and scalability: Cloud computing provides the flexibility to scale up or down computing resources per the organisation’s needs and budget, making it adaptable for businesses of all sizes.

Mobility: Users can access corporate data from any device, anytime, and anywhere via the internet, ensuring productivity even on the go.

Disaster recovery: Cloud providers can handle unforeseen disruptions like hardware failures, natural disasters, and power outages, ensuring high application availability and business continuity.

Automatic updates: Service providers regularly update systems with the latest technology, relieving businesses of manual organisation-wide software updates and ensuring they have access to up-to-date software versions, improved servers, and enhanced processing power.

Conclusion
Cloud Computing has already left a significant mark on the tech landscape, but its growth potential is beyond measure.

It opens up a world of exciting possibilities in various areas, such as Processing Capability, Quantum Computing, and Artificial Intelligence, all aimed at enhancing the power of Cloud Computing.

Imarticus Learning’s Postgraduate Program in Data Science and Analytics not only equips you with a strong foundation in cloud computing and distributed computing while opening doors to a dynamic career in data analytics or data science.

By joining this course, you’ll acquire the knowledge and skills to navigate a career in data science and analytics, helping you to become a data analyst and thrive in this data-driven world.

Visit Imarticus Learning today to learn more about a career in data science with our data analytics certification course.

The Impact of Data Analytics on Customer Experience and Engagement

Data is king in the modern digital world, and organizations can increasingly use data-driven choices to enhance customer experience and engagement. Businesses now have unparalleled visibility into consumer behavior and preferences because of the acquisition and analysis of customer data.

By leveraging data analytics, companies may create individualized and targeted experiences that improve customer pleasure, loyalty, and revenue. In this blog, we’ll look at the impact of Data analytics on consumer engagement and experience and how organizations use this technology to stay competitive. 

So grab a seatbelt and get ready to learn how data analytics has the extraordinary potential to alter consumer experiences.

What is the impact of data analytics on customer experience?

Data analytics is a potent tool for businesses to understand their customers better. It can help you understand your business better, too. When implemented properly, data analytics can also improve employee performance and productivity.

According to a Forbes Insights survey of 357 executives from large organizations, the benefits of moving toward data-driven customer experiences (data-driven CX) include enhancing revenue generation, enabling cost reduction, and hastening process efficiency and quality improvements. 

The term “data analytics lifecycle” refers to the sequence of steps and stages that must be completed to evaluate and derive meaning from unstructured data. Steps in the lifecycle include gathering, preparing, modeling, analyzing, and visualizing data.

How can data analytics improve customer experience?

In summary, data-driven decision-making means using data analytics to make better decisions. Data analytics can help you make better choices and adapt your product or service to meet customers’ needs.

Customer experience analytics is becoming necessary for organizations looking to improve customer experience and engagement through improved targeting, personalization, and targeted offers.

Data pertaining to sales numbers, market research, logistics, linguistics, or other behaviors are organized by a data analyst. They use their technological know-how to guarantee the quality and accuracy of the data. Then, it is processed, organized, and presented in a way that supports improved decision-making by people, companies, and organizations.

  • Data extraction from primary and secondary sources using automated technology.
  • Eliminating corrupt data, resolving code issues, and other issues.
  • Rearranging data into a legible format is necessary to develop and maintain databases and data systems.
  • To determine the worth and quality of data through evaluation.
  • To find and correct coding problems, examine reports and performance metrics.
  • Finding, analyzing, and interpreting patterns and trends in massive data sets that might help with diagnosis using statistical methods

Benefits of Data Analysis for Improved Customer Experience

When it comes to managing customer experience and engagement, data analytics is key. 

  • With the right insights into your customers’ needs, you can build a better product that meets their wants and needs. 
  • This will lead to improved communication and engagement with your customers, boosting loyalty by giving them more reasons to stay loyal. 
  • It enables you to identify opportunities for growth through targeted marketing campaigns that generate revenue for your business.

Numerous approaches exist for firms to use data analytics to enhance consumer engagement and experience, including:

  • Recognizing consumer requirements and preferences: Businesses may use data analytics to segment their customers depending on their demographics, behavior, and feedback. 
  • Improving customer loyalty and retention: Data analytics may assist firms in measuring and enhancing their clients’ loyalty and satisfaction. 
  • Improving customer journey and touchpoints: Businesses may map and improve their customer journey and touchpoints across various channels and platforms using data analytics. 

What are the different Data Analytics Tools?

Data analytics is a critical component of customer experience and engagement. Customer-centric data analytics can track marketing campaigns’ success, improve operations’ efficiency, and improve product development. 

The following tools help you leverage your data:

  • Customer Relationship Management (CRM) Software – CRM software manages customer relationships across all touchpoints, including email, phone calls, and online interactions. Your CRM system must have robust reporting capabilities so you can quickly see how well each channel is performing against its goals or KPIs (key performance indicators).
  • Social Media Analytics – Social media platforms provide unprecedented access to how people interact with brands on social media channels like Facebook or Instagram. However, these platforms don’t offer many analytics options beyond basic sentiment analysis, which doesn’t provide enough information about what customers say about their experiences with your company when interacting through these channels.
  • Web Analytics – Web analytics tools give you insight into where visitors come from within your site and what activities they do once they are there – allowing you to optimize advertising campaigns accordingly.
  • Sentiment Analysis – Sentiment analysis helps determine whether users feel positively toward something by analyzing text content found within written messages posted online, such as comments left under blog posts or tweets.

The Final Words

How organizations communicate with their consumers is being revolutionized by data analytics. Companies may learn important insights about consumer behavior, tastes, and requirements by utilizing the power of data. With this data, companies can target their marketing efforts and customize their services to provide a wonderful consumer experience.

It isn’t easy to overstate the influence of data analytics on customer experience and engagement. Businesses can better understand their clients, anticipate their requirements, and deliver services that meet their expectations. Customers feel appreciated as a consequence, and brand loyalty rises.

Companies that do not use data analytics risk slipping behind their rivals in this data-driven environment. Businesses may gain a competitive advantage and spur development by investing in data analytics tools and tactics. 

Enroll in the excellent Data Science and Analytics course that Imarticus Learning is offering. With the help of this extensive curriculum, you’ll have the practical knowledge and abilities to use data science in everyday situations and build analytical models that boost corporate performance.

6 Pros And Cons Of Tableau Data Extracts V/S Live Connections

The main goal of Data Analytics and Visualisation is extracting insights from raw data. You have to connect and interact with data from many sources to derive meaningful results. Businesses worldwide use a tool like Tableau to get this job done. One of the most powerful tools in this domain, Tableau, offers two ways to interact with data. To learn more about this domain, you can always pick a data science course that can boost your career in data science to new heights.

Join us as we unveil the meaning of these two methods. By navigating through the pros and cons of each method, you will realise the true potential of data visualisation.

Let’s get started!

What are Data Extracts?

Simply put, Tableau creates a condensed version of data called data extracts. They are stored separately from the source. These data extracts are minor in size as they only contain data required for visualisation.
best data analytics course

Pros of Data Extracts

Flexible Data Modelling: You get more power to customise data extracts. Through this mechanism, you can perform the following actions.

Creating calculated fields

Performing custom calculations

Defining hierarchies within the extract

Enhanced Security and Data Governance: Extracts provide a layer of security for your data. Through its encryption, you can protect your data with a password while sharing it with external parties. This capability helps you in cases where you are strictly expected to comply with privacy regulations.

Local availability: Data extracts can be locally stored on your system. You can work on them without connecting to the source. Data extracts provide flexibility as you can manipulate and shape data without an internet connection.

Cons of Data Extracts

Data Latency: You can expect data latency as the extracts are locally available. You will have to refresh the extracts to reflect the latest information in your insights and visualisations. This results in a significant delay between when data was changed in the source and when it was updated in the extract

Complex Extract Creation: Creating extracts requires more steps than a live connection. Beginners might need help to perform the following tasks for extract creation.

Defining data connection settings

Selecting data fields

Configuring filters

Managing data refresh schedules

Data Duplication: Extracts are stored locally. If you don’t refresh them frequently, discrepancies could occur with the source. This leads to confusion and unreliable analysis.

What are Live Connections?

Unlike data extracts, live connections are dynamic. Through them, you can interact with data in real-time. When you establish a live connection, Tableau retrieves data from the source whenever you interact with the visualisation.

Pros of Live Connections

Reliable Analysis: The generated analysis is trustworthy as you always work with real-time data from the source. Any changes in the source are instantly reflected in the visualisation.

Centralised Data Governance: Tableau establishes a direct connection to the data source. Tableau enforces the access controls and security protocols of the source. Thus, you can maintain centralised security protocols and governance.

Real-time Collaboration: Live connections allow multiple users to work with the same data source. They can access and interact with the visualisations in real-time.

Cons of Live Connections


Strain on Data Source: You should use a data source sparingly. This can strain the source because of repeated requests. Others accessing the same source could observe decreased performance.

Compatibility Concerns: Tableau and the data source must run on the latest updates. The versions they are operating on must be compatible with each other. Any update on Tableau requires changes in the data source as well.

Limited Data Shaping: Unlike extracts, live connections do not allow customisations. You may have to perform calculations and transformations in the source before visualising in Tableau.

Learn more from a Data Science Course. 

If your business requires insights from real-time data, work with “live connections.” However, “data extract” is your go-to mechanism if offline availability is your priority. Learn more about it by taking a Data Science course. Imarticus Learning offers many courses from top educators to make you job-ready. For any inquiries, connect with us through chat support on our Contact Us page. Our training centers are conveniently located in Mumbai, Thane, Chennai, Pune, Bengaluru, Delhi, Gurgaon, and Ahmedabad.

Frequently Asked Questions

Why is Tableau used in data science?

Tableau stands out as a leading tool in business intelligence (BI), aiding users in crafting various visual representations such as charts, graphs, maps, dashboards, and stories. With a rich set of distinctive and compelling features, Tableau has earned its popularity by empowering users to visualise and analyse data, facilitating informed business decision-making effectively.

Tableau is suitable for what kind of data?

Renowned as the forefront solution in contemporary business intelligence, the Tableau platform seamlessly extracts data from diverse sources and transforms it into actionable insights swiftly and effortlessly.

What topics are involved in the data science course?

A beginner-level Data Science course syllabus encompasses fundamental and advanced principles in data analytics, machine learning, statistics, and programming languages like Python or R.

Why Machine Learning is the Key to Unlocking Insights from Big Data?

Big data is becoming increasingly important in today’s business landscape. But what is big data, and why is machine learning the key to unlocking insights?

Data Analytics Course

In today’s digital world, we generate massive amounts of data every day.

From our social media interactions to online transactions, the data keeps growing.

However, the real challenge lies in understanding this data. Uncovering valuable insights from data can help us make better decisions.

This is where learning machine learning becomes essential. It is a key tool for extracting meaningful insights from large data sets.

What Is Machine Learning?

Machine learning is a part of artificial intelligence that focuses on developing algorithms and models.

It enables computers to learn from data. Instead of following strict rules, machine learning algorithms learn from patterns and trends in the data. Thus allowing them to make predictions, identify patterns, and reveal insights.

Importance Of Machine Learning In Unlocking Big Data Insights

Learning machine learning offers several advantages when it comes to analyzing large data sets. Traditional methods of data analysis struggle to handle big data due to its enormous volume,.

Humans would find it challenging to manually go through such vast amounts of data to extract insights. Machine learning algorithms, on the other hand, excel at processing and analyzing extensive data sets. It helps in revealing valuable insights that might otherwise remain hidden.

One of the main strengths of learning machine learning is its ability to identify complex patterns within the data.

These patterns can be challenging for human analysts to detect, especially when dealing with multi-dimensional data. Machine learning algorithms can identify and analyze intricate connections between variables.

Thus enabling organizations to uncover valuable insights and make data-driven decisions.

Furthermore, learning machine learning algorithms can continuously learn and adapt to new data. It improves their performance over time. This iterative learning process allows models to become more accurate and reliable. It helps, making them ideal for handling dynamic and evolving data sets. By learning from past experiences, machine learning models can make predictions and recommendations based on historical data. It helps businesses in anticipating future trends and making proactive decisions.

Imarticus Learning’s Postgraduate Program in Data Science and Analytics

Imarticus Learning recognizes the growing importance of machine learning in the field of data science and analytics.

The Postgraduate Program in Data Science and Analytics is a 6-month online course. This course offers numerous benefits to its participants:

Live Learning Modules

The program provides live learning modules. It allows students to interact with instructors. This interactive approach enhances the learning process and encourages active participation.

Dedicated Career Services

Imarticus Learning offers dedicated career services to support students in their job search. They provide guidance and assistance to help students find suitable employment opportunities in this industry.

Access to KPMG Organized Hackathons

Students enrolled in the data analytics course gain access to hackathons organized by KPMG. These hackathons provide an opportunity to apply machine learning techniques in a competitive setting.

Real-World Projects for Practical Knowledge

The program incorporates various real-world projects. It allows students to apply machine learning concepts to solve practical problems. This hands-on experience bridges the gap between theoretical knowledge and its practical application. It helps prepare students for real-world challenges.

Job-specific Curriculum

The program is designed to provide students with the specific skills required to excel in the field of data science. By focusing on the practical aspects of the industry, the curriculum ensures that students are well-prepared for the job.

Job Interview Guarantee

Imarticus Learning provides a job interview guarantee to eligible candidates upon successful completion. This assurance gives students confidence in their career prospects. It serves as an incentive to excel in their studies.

Alumni Success

Imarticus Learning’s alumni are currently employed by various esteemed companies. Some top companies are Accenture, KPMG, Infosys, Capgemini, IBM, Cognizant, Wipro, Standard Chartered, and Deloitte. The program’s strong industry connections provide graduates with excellent networking opportunities. This increases their chances of securing rewarding positions in top organizations.

Final Thoughts

Machine learning plays a vital role in extracting valuable insights from large data sets. Its ability to analyze large amounts of data, and identify complex patterns, makes it important in today’s data-driven world.

Imarticus Learning’s Postgraduate Program in Data Science and Analytics offers a comprehensive curriculum that covers all aspects of data science and analytics.

Join Imarticus Learning’s Postgraduate Program in Data Science and Analytics. Start your journey towards a rewarding career.

The Impact of Data Science on Various Industries

Data Science and Industrial Integration

Data science studies the extraction and derivation of meaningful insights from data. The approach to gathering the insight is multidisciplinary.

It takes practices and principles from a variety of fields. Some of these fields are computer engineering, statistics, artificial intelligence, and mathematics.

The applications of data science are unlimited as it answers the four important questions of problem-solving. These are what is the situation, why is it, what is the future course, and what would the result yield.

best big data analytics course

This basic information gathering and problem-solving make the adoption of data science in different industries feasible.

Data science finds its application in industries such as retail, medicine, banking, finance, and telecommunications among others. Read ahead if you are planning to make a career in data science and are curious about the impact on various industries.

Impact of Data Science on various industries

A career in data science requires professionals to make use of raw data for the identification of patterns. These patterns are then used to derive actionable insights from the data.

With data science, it is possible to predict future outcomes with a higher level of accuracy. Here is how various industries are benefiting from the applications of data science.

1. Healthcare

Applications of data science in the healthcare industry include the use of data in taking important decisions and drawing conclusions. These include the implementation of medical knowledge gathered in the diagnosis of diseases.

Data science is also used to improve the safety and quality of healthcare by helping design prevention plans. It has also helped chart important health parameters such as sugar level, stress level, brain activity, etc using trackers. This can help deliver personalised care and precise prescriptions.  A deep learning technique is used in reading imaging data. This is also to reduce diagnostic failures.

2. Retail

In the retail industry applications of data science have led to the implementation of features such as recommendation engines. The impact helps companies design products according to the needs of the consumer. Market-based analysis allows the company to determine the likes, dislikes, and price points of consumers. This allows companies to target the right audience more efficiently.

The science has also helped the industry to analyze customer sentiments more accurately. Social media and other points of contact between consumers and companies help companies collect data. This is further used to enhance the feedback mechanism. The feedback is then used to design better products. Firms using data science can optimise prices efficiently. All these lead to an increase in sales and revenue flow in the industry.

3. Banking, Finance Services, and Insurance Industry (BFSI)

BFSI has benefitted largely from the application of data science in the industry. The industry has been able to minimize its losses with the help of fraud detection using science. It has impacted more efficient management of customer data, risk modelling, and customer support.

Data scientists can generate customer life value prediction that is used to recommend products and services to consumers as per their needs. BFSI companies are also able to minimize the impact of any risk to their businesses with the help of predictive and real-time analysis. These techniques have led firms to increase sales and operational gains.

4. Telecommunication Industry

If you are looking for a career in data science in the telecommunication industry you will be able to impact efficient data transmission and visualisation needs. Data science is applied for increasing fraud detection by firms. Using science, consumers benefit from increased network security.

The benefits for the company include price optimisation, real-time analysis, and prevention of customer churn. Companies can also benefit from features such as location-based promotion, predictive analysis, and targeted marketing.

5. The course you need for a career in data science

The example of the impact of data science on four industries is a mirror of the significance of data science in today’s world. If you are looking for a career in data science Imarticus Learning’s Postgraduate Program In Data Science And Analytics is the one.

The course is designed for early career professionals. This six-month program is designed based on a job-specific curriculum. The learning is accentuated by live learning modules, real-world projects, and KPMG hackathons. The certification is designed to launch your career in data science in an industry of your choice.

Summing it up

Applications of data science are wide. There are several industries apart from healthcare, retail, BFSI, and telecom that are using data science. Data science can help companies grow and the skills of a data scientist are always in demand. You can benefit from a quick start in your career by being a part of Learning’s Postgraduate Program In Data Science And Analytics.

Imaritcus Learning offers you benefits such as Job-assurance, specialized training, and placement drive. It has helped more than 56000 individuals attain placements. Be sure to visit us for other similar courses.

Why Power BI is Essential for Data Scientists and Analytics Professionals?

In this present data-driven world, the field of data science has gained immense popularity.

Data scientists & analytics professionals are in high demand as organizations seek valuable insights from vast amounts of data.

Professionals in these fields require powerful tools to analyze and visualize data effectively. One such essential tool is Power BI.

The Growing Demand for Data Scientists and Analytics Professionals

The demand for skilled Power BI for data scientists and analytics professionals is rapidly increasing as businesses rely on data to drive decision-making processes. These professionals play a crucial role in collecting, analyzing & interpreting data to uncover patterns, trends, and insights that can drive business growth. 

By 2026, the US Bureau of Labor Statistics predicts a substantial increase of 27.9 percent in employment opportunities demanding Data Science skills.

With the exponential growth of data, organizations are looking for efficient ways to manage and make sense of the information.

What is Power BI?

best big data analytics course

Power BI, developed by Microsoft, is a powerful business analytics tool.

It enables users to connect to various data sources, transform raw data into interactive visualizations, and share insights across the organization.

Power BI offers a user-friendly interface and a range of features that empower data scientists and analytics professionals to explore data, discover hidden patterns, and communicate insights effectively.

Benefits of Power BI for Data Scientists

Power BI provides several benefits that make it essential for data scientists:

  • Data Integration: Power BI integrates with diverse data sources, including databases, cloud services, and online platforms. This enables data scientists to access and analyze data from multiple sources within a single environment.
  • Interactive Visualisations: Power BI offers rich visualization options, allowing data scientists to create interactive dashboards, reports, and charts. These visualizations help present complex data in a visually appealing and easily understandable manner.
  • Advanced Analytics: Power BI incorporates advanced analytics capabilities, such as statistical modeling, forecasting, and clustering. Data scientists can leverage these features to gain deeper insights into data and make accurate predictions.

What role does Power BI play in data analysis for professionals in the analytics field?

For professionals aspiring to build a career in data science, having expertise in Power BI provides a significant advantage.

Power BI skills are in high demand across industries. Employers value professionals who effectively utilize Power Business intelligence to analyze and visualize data, making them valuable assets in data-driven organizations.

Power BI Features for Analytics Professionals

Power BI offers a range of features specifically designed for analytics professionals:

  • Data Modelling: Power BI allows analytics professionals to create robust data models by defining relationships between data tables. This helps organize data and enables efficient analysis.
  • DAX (Data Analysis Expressions): DAX is a formula language used in Power BI to create custom calculations and aggregations. Analytics professionals can leverage DAX to perform complex calculations and create custom measures for their analysis.
  • Data Security: Power BI provides robust security measures to protect sensitive data. Analytics professionals can define role-based access controls and implement data-level security to ensure data confidentiality.

How Power BI Simplifies Data Analysis

Power BI simplifies the data analysis process for data scientists and analytics professionals in several ways:

  •      Drag-and-Drop Interface: Power BI’s intuitive drag-and-drop interface makes it easy to import and manipulate data without writing complex code.
  •      Automated Refresh: Power BI can automatically refresh data from various sources, ensuring the analysis is always current.
  •      Natural Language Queries: Power BI enables users to ask questions in natural language to generate visualizations and insights. This feature allows data scientists and analytics professionals to explore data interactively and get instant answers to their queries.

Integrating Power BI with Other Tools and Platforms

Power BI seamlessly integrates with other tools and platforms, enhancing its capabilities for data scientists and analytics professionals. It can connect with tools like Excel, Azure Machine Learning, and SQL Server Analysis Services, enabling users to leverage existing workflows and combine data from multiple sources for comprehensive analysis.

Power BI vs. Other Data Visualisation Tools

While several data visualization tools are available, Power BI stands out due to its unique features and capabilities. 

When compared to other tools, Power BI offers the following:

  • Ease of Use: Power BI’s intuitive interface and drag-and-drop functionality make it accessible to users with varying technical expertise.
  • Scalability: Power BI can handle large datasets & can scale to meet the needs of enterprise-level data analysis.
  • Integration with Microsoft Ecosystem: As a Microsoft product, Power BI seamlessly integrates with other Microsoft tools and services, creating a unified ecosystem for data analysis and reporting.

The Future of Power BI in Data Science and Analytics

As the demand for data-driven decision-making continues to grow, Power BI is poised to play a crucial role in the future of data science and analytics. Microsoft continues to invest in Power BI, introducing new features & enhancements to meet the evolving needs of data professionals. With its ease of use, powerful capabilities, and integration with the Microsoft ecosystem, Power BI is expected to remain an essential tool for data scientists and analytics professionals.

Ending Note

Power BI certification and training programs are vital in enhancing the skills & knowledge of data scientists and analytics professionals. These programs validate an individual’s proficiency in Power BI and provide valuable credentials for career advancement. 

One renowned institution that offers comprehensive training in data analytics, including Power BI, is Imarticus Learning. Their Data Analytics course with placement covers a wide range of topics, providing participants with a solid foundation in data science and analytics. 

Enrolling in the Data Analytics course in india with placement by Imarticus Learning opens doors to a successful career in data analytics. Graduates and professionals looking to transition into the field can benefit from the extensive curriculum covering essential topics such as data analytics, business intelligence, and data visualization. The course equips participants with the necessary skills to thrive in the dynamic field of data science and analytics.

The Data Analytics course focuses on Power BI and comprehensively explains various analytical tools, techniques, and methodologies. By acquiring a diverse skill set, participants can excel in different areas of data analytics and make valuable contributions to organizations across industries.

Related Posts:

Top 10 Power BI Interview Questions and Answers [For Freshers and Experienced]

Business intelligence or BI posed a considerable challenge to Microsoft back in 2011. It made them build their own BI tool and compete with various analytical capabilities of the existing Microsoft Excel. This not only upgraded the entire programming but also helped in generating interactive reports. 

Nowadays, Power BI has taken over the world with its robust features, intuitive features and widespread adoption. It provides connectivity to various data sources and facilitates collaborative decision-making. Power BI has revolutionised the way businesses analyse and interpret their data to make informed decisions.

The career prospects of Power BI are quickly growing as businesses rely more and more on data visualization and business intelligence to inform their decisions. Roles such as BI Developer, Data Analyst, and BI Consultant are in high demand in a variety of sectors, including banking, healthcare, retail, and technology.

Preparing well for Power BI interview questions is crucial for anyone hoping to land these positions. This preparation not only allows you to showcase your experience in topics such as DAX (Data Analysis Expressions), Power Query, and data modeling, but it also keeps you up to date on the tool’s latest developments. Getting enough hands-on practice and the ability to transform complex data into meaningful insights is important. With thorough preparation, you can effectively highlight your technical skills, problem-solving skills, and expertise in working with Power BI to achieve business success while greatly enhancing your chances in the highly competitive job market. 

become a Data Analyst

In this article, let’s understand the concepts of Power BI along with some beginner, expert and intermediate-level Power BI interview questions

What is Power BI? 

Power BI is a scalable, unified platform for self-service and businesses. It helps to connect and visualise all kinds of data and also seamlessly infuses visuals into various applications one might use daily. 

Power BI is beneficial for both technical and non-technical business users. It is classically used for commercial purposes for analysing, aggregating, visualising and sharing data. Even though its User Interface is fairly similar to Microsoft Excel, it is a much more versatile self-service tool which can be operated through upfront training. 

Power BI Interview Questions for Freshers 

What is Power BI? 

It is a known business analytics tool by Microsoft that uncovers valuable data sources into various valuable interactive insights. It can either be in the form of an Excel or a spreadsheet or can be spread across the cloud via different data warehouses. 

Why should one use Power BI? 

Power BI benefits a technical person, and even a non-technical individual can access it to connect, visualise and change their raw business data from varied sources into valuable data. This, in turn, helps in making smart business decisions. 

Difference between Power BI and Tableau 

Both Power BI and Tableau are one of IT’s leading data analytics tools that are also known for their impeccable visualisation skills. Even though they just have a few significant differences, like Power BI uses DAX for calculating measures while Tableau uses Tableau Calculation Language (TCL). Other than that, Power BI is a great analytical tool to be used by beginners, whereas Tableau has to be mastered by an experienced technical person. 

What are Power Pivot and Power Query? 

Power Pivot is a data gathering and data transformation tool which uses an in-memory data modelling component. Power Query is an ETL service tool which is used to analyse raw data. 

Power BI Interview Questions for Intermediate Level 

Where is data storage made in Power BI? 

Power BI is often assisted by cloud storage to store the data. However, Power BI is also capable enough to use a desktop service. Microsoft Azure is the primary cloud service for data storage. The other storage platforms are: 

  • Azure SQL Database 
  • Azure Blob Storage

Why should one apply general formatting in Power BI? 

General formatting in Power BI makes it easy to categorise and identify data. This also facilitates a seamless work environment and gains results in no time. 

What are the various versions of Power BI? 

The various versions of Power BI are: 

  • Power BI desktop
  • Power BI service
  • Mobile Power BI apps

    What are the critical components of the Power BI toolkit? 

The critical components of the Power BI toolkit are: 

  • Power Query 
  • Power Pivot
  • Power View
  • Power Map
  • Power Q&A

Power BI Interview Questions for Experienced 

List the standard techniques of data shaping 

Power BI uses data shaping to integrate various kinds of data. The standard techniques of data shaping in Power BI are: 

  • Adding indexes 
  • Applying for sort order 
  • Removing rows and columns

What are the fundamental concepts of Power BI? 

Syntax: This comprises a formula with elements. It also included functions like SUM, where you need to add figures. If the syntax is not correct, you will get an error message. 

Functions: These formulas comprehensively use specific arguments or values for calculations that are similar to various functions in Excel. The formulas comprise date/time, time intelligence, logical, statistical, and mathematical contexts. 

Context: These formulas consist of two categories: row context and filter context. Row contexts are used when the formula consists of a specific function to identify the personalities of every single row. When more filters are employed in the calculation, that is when filter context comes into play. 

Conclusion 

Power BI has now become an integral part of the tech industry. Companies are now striving to incorporate Power BI in their business model to gain more appropriation. 

If you are interested in taking up a course where you can learn all about Power BI interview questions and other aspects of data analytics, check out Imarticus Learning’s Postgraduate Programme in Data Science and Analytics. This is an ideal job opportunity for a tech professional and also for freshers.