What Is Data Science & Why It Is A Smart Career Decision

Introduction

Let me ask you a straightforward question: What if the decision of a new career, could land you right in the heart of a vast, global pool of innovation, high-paying job opportunities, and a game of limitless potentials? Tempting, right? That’s all Data Science in 2025. Regardless of whether you’re a new graduate, a working professional, or somebody looking to pivot your career, being asked what is data science could open doors to pathways previously unimagined.Firstly, in the last five years, Data Science has moved from a buzzword to an integral part of our everyday reality across many industries including: finance, healthcare, retail, and entertainment to name a few. By 2026 there will be over 11 million Data Science Job openings in India alone, therefore, it could be an incredibly smart and transformational career move.

Table of Contents

  • What is Data Science?
  • Careers in Data Science: Scope and Opportunities
  • How to Begin a Career in Data Science in India
  • Best Data Science Course with Placement Opportunities
  • Selecting the Best Data Science and AI Postgraduate Course
  • Why Data Science Is The Smartest Career Choice for 2025
  • Key Takeaways
  • FAQs
  • Conclusion

What is Data Science?

The world creates approximately 328 million terabytes of data on a daily basis. However, raw data itself is not useful unless we can interpret it. That’s precisely where Data Science helps. So, let’s dissect what is data science in easy words.

Data Science

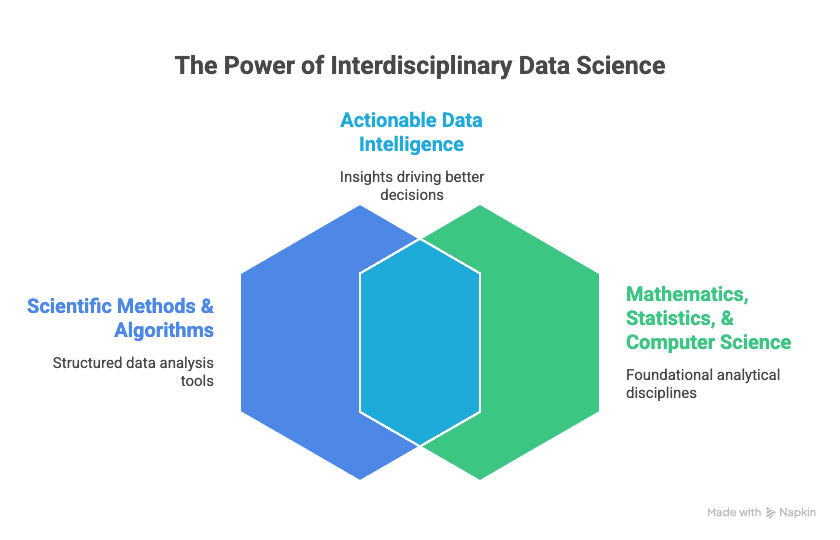
Data Science is an interdisciplinary field that uses -scientific methods, algorithms, and systems to extract knowledge & insights from structured & unstructured data. It uses mathematics, statistics, computer science, and other subject courses to make data actionable to the organization and have them use their intelligence to make better decisions.

Key Components of Data Science

Component Description
Data Collection Gathering raw information from multiple sources.
Data Cleaning Removing errors, duplicates, and inconsistencies from data.
Data Analysis Applying statistical methods to identify patterns and trends.
Machine Learning Building predictive models that improve with more data.
Data Visualisation Presenting findings in understandable formats like graphs.

In simple terms, Data Science is the process of extracting meaning from data to address actual problems.

Data Science Careers: Scope and Opportunities

It’s great to know what data science is, but to know where it can lead is more thrilling. The world has seen a rapid rise in careers related to data science, and hence, it’s one of the most future-proof and fulfilling career options today.

In India, organizations from all industries are hiring data professionals at a fast pace to remain competitive. Startups and mega players such as Infosys, TCS, Amazon, and Google – no one is leaving data teams behind.

Top Careers in Data Science

  • Data Scientist: The most desirable job, whose task is to develop models and draw out insights.
  • Data Analyst: Delivers on interpreting data that already exists to aid business decisions.
  • Machine Learning Engineer: Experts at creating AI-based solutions.
  • Data Engineer: Develops and sustains data infrastructure.
  • Business Intelligence Analyst: Converts data into strategic insights.
  • AI Engineer: Develops artificial intelligence technologies for implementation.
  • Big Data Engineer: Maintains and analyzes large-scale data sets.
  • Statistician: Implements statistical theories to address intricate problems.

With this diverse range of roles- jobs in data science have something for everyone, ranging from technical coders to business professionals.

How to Start a Career in Data Science in India

The question in everyone’s mind is – how to begin a data science career? The good news is, you don’t have to be a technical wizard to begin. But you do need to follow a systematic approach.

Here’s an Indian student and professional’s roadmap:

  • Step-by-Step Guide to Begin Your Data Science Career
  • Know the Basics: Learn what Data Science is.
  • Develop Technical Skills: Learn Python, R, SQL, and data visualisation software.
  • Mathematics & Statistics: Refresh probability, linear algebra, and stats.
  • Choose the Right Course: An MBA in Data Science with placement can speed up your career very much.
  • Work on Real Projects: Practical experience is priceless.
  • Build a Portfolio: Display your skills with GitHub, Kaggle, or personal projects.
  • Stay Updated: Be abreast of industry developments and trends.
  • Network and Apply: Go to meetups, LinkedIn networking, and apply for internships.

For those seeking a guided learning process, taking admission in a well-known data science course with placement is usually the best way to begin.

Top Data Science Course with Placement Options

If you’re serious about entering this industry, opting for a placement data science course is a big ticket. It provides you with not only technical skills but also job guarantee and industry exposure.

Best Courses to Make Career-Ready Data Scientists

Program Name Features
Imarticus Learning – PG Program in Data Science and AI Placement support, industry projects, AI integration
IIT Roorkee – Data Science and Machine Learning Certificate Focus on advanced ML tools with placement assistance

For Indian students seeking best-of-breed training with job assurance, the Imarticus Learning Data Science and AI Program is one of the most reliable choices.

Selecting the Top Postgraduate Course in Data Science and AI

After deciding you want to venture into this area, the second step is finding the best postgraduate course in data science and AI. But with all the possibilities, how do you select?

A proper postgraduate course should have – industry-focused curriculum, practical projects, experience with AI technologies & career guidance. Considering how interdependent AI and Data Science are, studying both together maximizes your job opportunities.

Factors to Keep in Mind When Selecting a Program

  • Curriculum crafted by industry professionals.
  • Both Data Science and AI emphasis.
  • Hackathons and real-world projects.
  • Career services and placement assistance dedicated.
  • Flexible online or blended learning possibilities.
  • Good student feedback and sector standing.

The best postgrad program in data science and AI gives you both technical skills and the skills to solve business issues with data-driven solutions.

Why Data Science is the Smartest Career Move for 2025

Let’s be honest – technology is not going to slow down anytime soon, nor will the need for data experts. Adopting Data Science as your career choice in 2025 is equivalent to investing in a future-proof property.

The latest findings from Forbes indicate that Data Science and AI will be the driving forces in global job markets over the next decade. India, with its thriving digital economy, is amongst the prominent markets for this boom.

Why 2025 is the Ideal Time

  • Massive opportunities for data science careers in India and around the world.
  • Competitive pay and high job satisfaction.
  • Opportunity to work on state-of-the-art AI and ML projects.
  • Freedom to work across industries such as healthcare, finance, and e-commerce.
  • High impact and mentally stimulating work.
  • Global mobility and work-from-anywhere options.

The Future of Jobs Report of the World Economic Forum marks Data Science among the most emerging fields.. and therefore it is a wise career choice. 

Key Takeaways

  • Data Science is transforming business decision-making. 
  • Careers in data science are booming in India.
  • You can begin with a placement-oriented data science course. 
  • Picking the right postgraduate course in data science and AI guarantees career-readiness.
  • 2025 is the best time to make the transition into this line of work.

FAQs

1. What is data science and why is it so important?

 Data Science is the process of extracting insights from data to answer real-world questions & that’s why it’s so important for companies to remain competitive.

2. What do data science careers require?

 You require technical skills such as – Python, SQL, statistics, and machine learning, in addition to problem-solving and critical thinking skills.

3. How to begin a career in data science with no technical background?

Start with entry-level courses and build your technical skills step by step, particularly with a data science course with placement.

4. What is the best postgraduate data science and AI program?

Programs like Imarticus Learning’s PG Program are best known for industry focus, AI, and placement support.

5. Are data science careers just for engineers?

 Not at all! There are professionals from mathematics, economics and business to those coming from non tech backgrounds who have transitioned successfully.

6. How much does a Data Scientist earn in India?

— Entry level salaried roles can earn you between 6-10 LPA, and with experience, you can earn 20 LPA or even more.

7. What industries hire Data Scientists?

 IT , finance, healthcare, e-commerce and even government organisations.

8. Does Data Science have a future in India?

 Yes. with India’s digital transformation, the demand for Data professionals, will be exponential.

9. Can I take a data science program online?

 Yes! There are many providers like Imarticus Learning which have platforms that offer extensive programs with flexible learning options and placement support.

10. How long will it take to be job ready?

Working with a structured program, most learners can be job ready in 6-12 months.

Conclusion

There has never been a better time to step into Data Science! With so many people interested in data, it’s possible to dominate industries and even economies based on data. The rigorous the increase in demand, potential salaries, and job satisfaction represents one of the best long-term decisions in your career.

If you are starting from scratch, or simply want to transition to a new career in data, 2025 could represent the beginning of the smartest decision in your career with its leap into Data Science.

Ready to begin your journey? Join the Imarticus Learning PG Program in Data Science and AI today and get your career on track for success.

External References:

  1. Forbes: Data Science Trends for 2024 and Beyond
  2. World Economic Forum: Future of Jobs Report 2023
  3. Harvard Business Review: Why Data Science is the Sexiest Job of the 21st Century

Top In-Demand Data Science Skills Employers Are Looking For

Introduction

Want to land your dream job in data science? You’re not alone. With companies across industries doubling down on data-driven strategies, the demand for data scientists has exploded in India. But here’s the twist—just having a degree isn’t enough anymore. Recruiters are looking for something more: the right data science skills. If you’re asking yourself what differentiates one candidate from the resume ocean, more often than not it boils down to the quality of their skillset and its match with actual business requirements. In this blog, we will guide you through the most in-demand data science skills employers need and how you can learn them to accelerate your data science career advancement.

Data Science Skills

Table of Contents

  • Essential Data Science Skills for 2025
  • Understanding Data Science Job Requirements
  • Most In-Demand Skills for Data Scientists
  • Technical Skills for Data Science Success
  • Programming Languages for Data Scientists
  • Machine Learning Skills for Jobs
  • Boosting Your Data Science Career Growth
  • FAQs
  • Key Takeaways
  • Conclusion

Essential Data Science Skills for 2025

The world of data science continues to change rapidly, as do the skills needed by employers from applicants. While some skills have remained mostly the same, others are becoming mandatory with the introduction of new tools and technologies.

Here are some essential data science skills you should have in 2025:

  • Data wrangling: Cleaning, sorting, and pre-processing raw data. 
  • Exploratory Data Analysis (EDA): Finding trends and outliers in datasets. 
  • Data visualization: Telling a story and presenting findings with tools like Tableau, Power BI. 
  • Model Deployment: Understand how to deploy models into production. 
  • Cloud Computing: Especially AWS, Azure, and Google Cloud. 

These data science skills will not only help you become more technically competent – but will also improve your problem solving mindset, allowing you to think in the style of a data person.

Understanding Data Science Job Requirements

So, what are companies actually asking for in job descriptions? Many freshers and professionals make the mistake of assuming that learning Python or R is enough. But recruiters want a mix of technical prowess, business acumen, and communication skills.

Let’s break down common data science job requirements in a table:

Requirement CategoryExamples
Programming SkillsPython, R, SQL
Machine LearningRegression, Clustering, Decision Trees
Business IntelligenceTableau, Power BI
Cloud PlatformsAWS, GCP, Azure
CommunicationReport writing, stakeholder presentations

Keep an eye on job portals like Naukri, LinkedIn, or global ones like Glassdoor to stay updated on what employers are demanding.

Most In-Demand Skills for Data Scientists

The competition is real—and so is the opportunity. The most successful data scientists are those who develop a combination of domain knowledge and tech stack mastery. From statistical modelling to working on big data platforms, here’s what you should focus on.

Most in-demand skills for data scientists include:

  • Data Engineering: Knowing how to build pipelines using tools like Apache Spark.
  • Model Explainability: Understanding SHAP, LIME, and other interpretation techniques.
  • AI Integration: Merging machine learning models into larger AI workflows.
  • Version Control: Using Git to collaborate and manage code versions.

When these data science skills are part of your toolkit, you position yourself as an asset in any business environment.

Technical Skills for Data Science Success

Beyond theoretical understanding, your technical chops will be scrutinised during interviews and assessments. Technical skills form the backbone of any successful data scientist’s career.

Let’s look at the core technical skills for data science:

  • Statistics & Probability: Hypothesis testing, A/B testing, distributions.
  • Database Management: SQL queries, joins, indexing.
  • Big Data Technologies: Hadoop, Spark, Kafka.
  • APIs: RESTful APIs for model deployment.
  • Scripting: Shell scripting for automation tasks.

Tip: Build projects using real-world datasets to strengthen these skills. Sites like Kaggle are great for practice.

Programming Languages for Data Scientists

You can’t name yourself a data scientist if you don’t know how to use at least – one programming language fluently. But most importantly.. you need to know when & how to use each language for each use case.

The most important programming languages for data scientists:

  • Python: The number one language for machine learning, data cleaning, and data visualization.
  • R: Excellent for statistical analysis and academic research.
  • SQL: Essential for querying relational databases.
  • Scala/Java: Often used in big data environments.

A well-rounded grasp of these tools adds immense weight to your data science skills portfolio.

Machine Learning Skills for Jobs

Machine learning isn’t just a buzzword anymore—it’s a job essential. From fintech to healthcare, every sector is integrating ML models to make smarter decisions. Your understanding of these algorithms can set you apart.

Machine learning skills for jobs include:

  • Supervised Learning: Regression, classification, ensemble methods.
  • Unsupervised Learning: Clustering, dimensionality reduction.
  • Deep Learning: CNNs, RNNs, transformers.
  • Model Evaluation: Precision, recall, F1 score, ROC curves.

The better your grasp on these concepts, the more confident you’ll be in interviews and real-world applications.

Boosting Your Data Science Career Growth

Acquiring skills is just the first step. Strategic learning, mentorship, and networking play a huge role in scaling your data science career growth. The key is to never stop learning and updating your toolkit.

Actionable tips to boost your data science career:

  • Enrol in Certification Programs: Choose ones with real-world projects.
  • Follow Industry Leaders: Stay inspired and updated via LinkedIn or Twitter.
  • Contribute to Open Source: Collaborate on GitHub projects.
  • Attend Webinars and Hackathons: Great for networking and experience.

Remember, growth in data science is exponential when you stay curious and proactive.

FAQs

Q1. What are the most important data science skills to learn first?

 Start with Python programming, statistics, and SQL. These form the foundation of almost every data science role and are universally in demand.

Q2. Are soft skills relevant in a data science job?

 Absolutely, communication, storytelling and managing stakeholders are extremely important for demonstrating data-driven insights effectively.

Q3. Which certification can someone use to reflect their data science skills?

 The certifications available on Coursera, EdX or other platforms like Imarticus Learning will help you be noticed, these certifications will add credibility to your profile. 

Q4. How do I showcase my machine learning skills?

 You can showcase ML projects on GitHub or participate in competitions on Kaggle and write blogs or case studies on Medium.

Q5. How do I become job ready in data science, how long will this take?

 With learning and practice the goal is achievable in 6–9 months, depending on your input and previous experience. 

Q6. Which companies are hiring data scientists in India?

 The top employers are TCS, Infosys, Accenture, Flipkart, and listings include Amazon and fintech companies like Razorpay and Paytm.

Q7. Is it necessary to know both Python and R?

 Not necessarily. Knowing one language well is more valuable than knowing two superficially, though Python is more widely used in the industry.

Q8. Do I need a master’s degree for a data science career?

 It helps but is not mandatory. Skill-based hiring is gaining traction. A strong portfolio can outweigh a formal degree.

Q9. What’s the best way to stay updated on data science trends?

 Follow resources like Towards Data Science, Analytics India Magazine, and DataCamp blogs.

Q10. How important is domain knowledge in data science?

 Very important. Understanding business context enhances the relevance and applicability of your models.

Key Takeaways

  • Mastering data science skills is essential for cracking job interviews & thriving in the industry.
  • Focus on building essential data science skills – from programming to storytelling.
  • Understand data science job requirements thoroughly and tailor your profile accordingly.
  • Learn and apply technical skills for data science through projects and hands-on practice.
  • Boost your data science career growth with the right strategy, certifications, and networking.

Conclusion

The world of work will be driven by data, and businesses want people who not only have the right technical acumen but are also business-aware as well as verbal communicators. It takes the effort and time to acquire those data science skills which are most sought after at that point to make your job future-proof. If you’re a student weighing options or a working individual career-switching, the ideal skillset will stand you apart amidst a noisy marketplace. Get yourself updated, inquisitive, and most crucially, continue building.

AI for Data Analytics: How Artificial Intelligence is Transforming Decision-Making in 2025

In the data-overflowing world, making sense of it all seems highly impossible. Businesses are in a constant pursuit of an edge concealed amidst mountains of data. The good news is that AI for data analytics is becoming an enabler, redefining decision-making processes in the year 2025. 

Gone are the days of intuition-based decisions or those made through obsolete Excel sheets. AI-enabled insights equip organisations to cut through noise, isolate patterns, and make decisions faster and more cleverly. For all the data geeks, business heads, and just the technically curious out there, this blog will break down the ways AI for data analytics is bending decision-making in ways that we couldn’t have even fathomed a few years ago.

Table of Contents

  • The Rise of AI in Business Analytics
  • Machine Learning for Data Analysis: The Backbone of AI Insights
  • Data-Driven Decision Making: A New Standard
  • AI-Powered Analytics Tools Changing the Game
  • The Future of Data Science and AI: What’s Next?
  • Key Takeaways
  • Frequently Asked Questions (FAQs)
  • Conclusion

The Rise of AI in Business Analytics

The use of AI in business analytics is not only a trend, but a revolution. In 2025, businesses of all industries are tapping into AI to better comprehend their operations, customers, and markets. AI algorithms, with the ability to process structured and unstructured data of magnitude, bring about real-time insights that were previously unimaginable.

Companies no longer need to wait for manual reports or past data. AI now facilitates continuous predictive analytics, sentiment analysis, and automated reporting at record-breaking speed and precision. This change allows decision-makers to anticipate actions before market and competitive action arises.

AI for data analytics

Main Advantages of AI Business Analytics

  • Real-time analytics for large, messy data
  • Predictive analysis for proactive decision-making
  • Improved customer experience through personalisation
  • Automated report automation and anomaly detection
  • Competitive edge with quicker interpretation of data

Machine Learning for Data Analysis: The Pillar of AI Insights

Machine learning is at the core of AI for data analytics. Intelligent machines learn from patterns in the data & get better over time.. rendering them invaluable for discovering latent relationships and trends within large pools of data.

Machine learning for data analysis drives everything from bank fraud detection to factory predictive maintenance. It allows businesses to shift from -reactive to proactive, minimizing risks & maximizing opportunities.

Table: Common Applications of Machine Learning for Data Analysis

ApplicationIndustryImpact
Fraud DetectionBanking & FinanceIdentifies suspicious transactions fast
Predictive MaintenanceManufacturingReduces downtime and maintenance costs
Customer Behaviour ModellingRetail & E-commerceEnhances targeted marketing strategies
Risk AssessmentInsuranceImproves underwriting and claim handling
Healthcare DiagnosticsHealthcareAssists in early and accurate diagnoses

Data-Driven Decision Making: The New Standard

If your organization is not adopting data driven decision making.. you’re already lagging behind. In 2025, decisions based on instinct alone will no longer do. With AI, companies can support every decision with hard data evidenced from good data.

Thanks to artificial intelligence for data analytics.. even non-tech leaders have access to visual dashboards & easy-to-understand reports – making informed decisions more accessible than ever before. From pricing to resource allocation, data-driven insights now inform almost every business function.

Benefits of Data-Driven Decision Making

  • Minimizes decision-making bias
  • Rapid response to market changes
  • Enhances operational efficiency
  • Maximizes profitability and minimizes waste
  • Drives innovation with actionable insights
  • AI-Powered Analytics Tools Revolutionizing the Game

The recent explosion of AI-driven analytics software has made sophisticated data insights accessible to everyone. Large companies & small alike can utilize such tools in 2025 without necessarily requiring an army of data scientists.

From automated dashboards to natural language processing (NLP)- that interprets intricate data in simple English, these devices make decision-making easy for all members of organisation. Tools such as Tableau, Power BI & Google’s Looker are integrating AI to make data more accessible and actionable.

Most Popular AI-Powered Analytics Tools in 2025

  • Tableau with AI Extensions – Predictive insights, smart alerts
  • Microsoft Power BI – AI-driven data visualisation and reporting
  • Google Looker – AI-enhanced business intelligence
  • Qlik Sense – Machine learning augmented analytics
  • IBM Watson Analytics – Predictions and automated data exploration

Need to become proficient in these and acquire hands-on skills? Join the Postgraduate Program in Data Science and AI by Imarticus Learning. It’s crafted to enable professionals to stay ahead of the curve with the AI-driven analytics revolution.

The Future of Data Science and AI: What’s Next?

The future of data science & AI looks – bright, dynamic, and truly inspiring. In 2025, the evolution is happening with the convergence of AI alongside blockchain technology, edge computing, and the Internet of Things (IoT). This array of technologies is paving the way for efficient, safe, and real-time analytics environments.

It is expected for AI to grow in explainability and to grow ethical while being intertwined with everyday working functions. As generative AI and low-code platforms gain strength, even non-technicians shall be capable of contributing to the AI map, thereby transforming the workforce dynamics.

New Trends That Will Define the Future of Data Science and AI

  • Explainable AI (XAI) to provide transparency and trust
  • Generative AI generating realistic data for training models
  • AI at the Edge enabling real-time insights with zero latency
  • AI-driven Automation eliminating repetitive tasks
  • Hybrid AI Models that integrate symbolic and machine learning methodologies

For an in-depth look at these trends.. see sources such as Gartner’s AI Trends 2025, McKinsey’s AI Adoption Insights, and Forbes’ AI Future Predictions.

Key Takeaways

  • AI for data analytics is transforming business decision making in 2025.
  • Combining AI with business analytics provides real time knowledge & competitive strengths.
  • Machine learning for data analysis helps in discovering patterns & facilitate forward thinking decision-making.
  • Organisations that adopt data-driven decision making become more efficient and profitable.
  • AI-powered analytics platforms are democratizing advanced insights for everyone.
  • The future of AI and data science is defining a future where AI is ethical, explainable, and deeply embedded.

Frequently Asked Questions (FAQs)

1. How much have new advancements of AI for data analytics disrupted business in 2025?

 Fast and accurate insights have become just a matter of giving the AI the data, yet this allowed businesses in making smarter choices, foreseeing trends, and improving operation efficiencies more than ever. 

2. What effect does machine learning for data analysis have on the transformation?

 Machine learnings build pattern recognition, outcome prediction, and automate data analysis and, therefore, are at the heart of AI-driven decision-making processes.

3. Would these AI-powered analytics tools work for a small business?

 Indeed, many AI-powered analytics tools provide scalable solutions intended for small and medium enterprises so that they may, in the end, access further insights sans big budgets. 

4. How would AI diminish bias during decision-making?

 Depending on the observation of data patterns rather than human intuition, bias would be diminished while all decisions are based on logic and evidence. 

5. Why is it essential to make decisions based upon clear data?

When organisations make decisions from data, they can respond to changes quickly, reduce the risk caused in operations, and sharpen the allocation of resources towards better performances. 

6. How will the future of data science and AI impact jobs?

While some repetitive roles may be automated, new opportunities will emerge for professionals skilled in AI, data science, and analytics, making continuous learning essential.

7. Can non-technical professionals leverage AI for data analytics?

Yes, thanks to user-friendly AI-powered tools and platforms, even those without technical backgrounds can access, interpret, and act on data insights.

8. What industries are seeing the biggest impact from AI in business analytics?

Industries like finance, healthcare, retail, and manufacturing are experiencing significant benefits through improved forecasting, risk management, and customer engagement.

9. What are the ethical concerns around AI for data analytics?

Key concerns include data privacy, algorithmic bias, and lack of transparency, which is why there’s a growing focus on explainable and ethical AI practices.

10. Where can I learn more about AI and data analytics?

A great place to start is the Imarticus Learning Data Science and AI Program, which offers hands-on training in the latest tools and techniques to future-proof your career.

Conclusion

Data analytics, when harnessed by AI, is simply unrivaled. Going into 2025, AI is not only augmenting technological capacities in analysing data but transforming the decision-making processes, problem-solving, and value creation. With AI within business analytics, machine learning speeding up data interpretation, and analytics tools easy for end users to operate, organisations have more than ever been equipped to stay afloat in the era of data.

To professionals, staying ahead means embracing continuous learning and mastering tools that drive the modern decision-making processes. Future lies in using AI, data science, and analytics in unison-and this future is loaded with opportunities.

Are you ready to protect your career? Check out the Postgraduate Program in Data Science and AI by Imarticus Learning and walk that path towards becoming a data-driven leader.

How to Pick the Best Online Data Analyst Course in 2025

In today’s data-first world, becoming a data analyst isn’t just smart — it’s strategic. With companies across industries using data to power decisions, a career in analytics is not only lucrative but future-proof. That said… the real challenge is figuring out how to choose a data analytics course that’s right for you.

With 2025 just around the corner, there’s a flood of options online — bootcamps, certifications, postgrad diplomas, GenAI-enabled courses… & that’s where things get overwhelming.

So, let’s simplify it. In this guide, we’ll explore how to evaluate a data analyst course online, what key factors to prioritise, & how to avoid falling for generic, outdated programs.


Why Does the Right Data Analyst Course Online Matter?

Not all online data analysis training programs are created equal.

Some are too theoretical… others lack real-world projects… & a few don’t even offer decent placement support.

Picking the right course can fast-track your career into top-paying roles — whereas the wrong one might leave you confused, underprepared, & broke.

💡 Want to know which companies pay the most for data roles in India? Check out this blog on the Top Paying Companies for Data Scientist Salary in India.


How to Choose Data Analytics Course: 6 Factors That Actually Matter

Let’s walk through a smart checklist you should use to pick the best online data analyst course 2025:

CriteriaWhat To Look For
Curriculum RelevanceCovers SQL, Python, ML, data visualisation, cloud, GenAI, real-world projects
Mentorship & FacultyIndustry-experienced instructors who’ve worked in real data environments
Projects & CapstoneScenario-based assignments + global capstone project
Career SupportResume building, mock interviews, job portal access, at least 2–3 interview guarantees
Flexibility & FormatWeekend batches, interactive live sessions, recorded classes
Reviews & Success StoriesAlumni outcomes, salary hikes, LinkedIn testimonials

…tick most of these boxes & you’re on the right track.


The Rise of AI & Why It Affects Course Selection

2025 is all about GenAI & cloud integration. A traditional data analyst course online won’t cut it anymore — because tools like ChatGPT, AWS SageMaker, Hugging Face & Tableau are reshaping what hiring managers expect.

The Executive PG Program in Data Science & AI by Imarticus Learning is a great example of a future-ready course. It combines a cloud-first approach, AI labs, 35+ tools, weekend-only format, & a capstone with an international startup.

✅ This isn’t just an online data analysis training program… it’s a career transformation journey.


Best Online Data Analyst Course 2025: What Sets It Apart?

While there are hundreds of programs, the best online data analyst course 2025 will go beyond just teaching Excel & Python.

Here’s how top-tier courses stand out:

ElementGeneric CourseBest Data Analyst Course Online
Tool ExposureExcel, TableauPython, SQL, Power BI, AWS AI/ML, GenAI, Git
Placement SupportSelf-paced job portalResume/LinkedIn makeover, interview prep, hiring partners
Learning FormatRecorded lecturesLive instructor-led sessions, hands-on labs
Capstone ProjectsSimulations onlyReal-world global startup projects
CertificationsInternal certificatesRecognised data analyst certification online 2025

Need more perspective on long-term career potential? This blog might help: Top Data Science Careers by 2030


Top Data Analytics Courses Online: What to Compare in 2025

Still wondering how to choose data analytics course that’s actually worth it? Let’s compare a few options:

ProgramDurationKey HighlightsIdeal For
Imarticus PG in Data Science & AI11 months35+ tools, GenAI + AWS labs, real-world capstoneWorking professionals
Coursera (Google DA Certificate)6 monthsBeginner-friendly, theoretical, no placementCollege students
Simplilearn Data Analyst Program9 monthsLive classes, tool exposureMid-career professionals
Udemy BootcampsVariesSelf-paced, limited supportSelf-learners on a budget

🚨 Want to understand if switching from a non-tech background is viable? Don’t miss this read: Data Scientist Qualifications: A Guide for Career Changers


What’s Inside a Future-Ready Data Analyst Certification Online 2025?

A good data analyst certification online 2025 should help you build, apply & deploy analytics solutions in real-world scenarios.

Here’s what that typically includes:

ModuleKey Concepts
Foundation BootcampPython, SQL, Excel, Git, Tableau
Supervised LearningRegression, Classification, Decision Trees
Unsupervised LearningClustering, PCA
Visualisation & BIPower BI, Tableau Dashboards
Cloud & GenAIAWS ML Labs, LLMs, Hugging Face, Prompt Engineering
Capstone ProjectStartup problem statement with end-to-end solution

Want to see a sneak peek into real learning journeys? Watch this YouTube video featuring alumni stories & career shifts.


Online Data Analysis Training Programs: Who Are They For?

You don’t need to be a math wizard to become a data analyst. In fact, the top data analytics courses online cater to:

  • Working professionals from finance, marketing, operations, HR
  • Tech professionals moving into AI/ML
  • Fresh graduates looking to upskill fast
  • Career changers without a data background
Data analyst course online

…because the focus isn’t just technical — it’s also strategic & business-oriented.


Final Checklist: Is This the Right Course for You?

Before you enrol in any data analyst course online, ask yourself:

✅ Does it offer 1-on-1 mentorship?

✅ Are there real-world case studies & not just mock data?

✅ Is the certification recognised by recruiters?

✅ Will I get placement support — or am I on my own?

✅ Can I finish it without quitting my job?

If it’s a YES to at least 4 of these, you’re close to finding the best online data analyst course 2025 for your goals.


FAQs

1. What is the best online data analyst course 2025?
The best online data analyst course 2025 includes hands-on projects, GenAI tools & strong placement support.

2. How to choose data analytics course that suits beginners?
Look for a course that covers Python, SQL & business cases with mentor support — ideal for beginners.

3. Are top data analytics courses online suitable for non-tech professionals?
Yes, top data analytics courses online are designed for both tech & non-tech backgrounds.

4. Is a data analyst certification online 2025 recognised by employers?
A well-structured data analyst certification online 2025 is highly valued by hiring managers.

5. What do online data analysis training programs usually cover?
They cover Python, visualisation tools, ML basics & cloud-based analytics platforms.

6. How long are top data analytics courses online?
Most top data analytics courses online range from 6 to 12 months, depending on depth & format.

7. Will a data analyst certification online 2025 help in getting a job?
Yes, a practical data analyst certification online 2025 improves your job prospects significantly.

8. What should I avoid when picking online data analysis training programs?
Avoid outdated content, no mentor support & courses without real-world projects.

Conclusion

So now you know how to choose data analytics course in 2025 — look for curriculum depth, project-first learning, tool mastery, & GenAI readiness.

If you’re still unsure where to start, consider exploring Imarticus’ Executive PG Program in Data Science & AI. It ticks the boxes we discussed… offers career mentorship… & helps you stay ahead in an AI-powered world.

Remember, don’t rush the decision. Compare, review, & invest wisely — because your future deserves the best.

 Data Analysis Course with Placement for Career Start

In today’s digital-first world, where data drives decisions & insights fuel innovation, data analysts have become one of the most sought-after professionals. If you’ve been wondering how to break into this high-growth field, here’s your answer — a data analysis course with placement.

Yes, you heard it right…

You can now fast-track your entry into the world of analytics through a placement-assured path that’s built to make you job-ready, industry-relevant & highly skilled. Let’s break it all down.


Why Data Analysis is the Career of the Future

From e-commerce giants to healthcare startups… from financial firms to sports analytics… data is everywhere. Companies are collecting massive amounts of information & they need experts to interpret it, visualise it, & turn it into actionable insights. That’s where data analysts come in.

A data analysis course with placement ensures that you’re not just learning theories — you’re preparing for real-world roles in top companies.

In fact, as per this blog on top-paying companies for data scientists in India, firms like Amazon, TCS, Google & Flipkart are paying handsomely for analytics professionals.

And the good news?

You don’t need years of experience to get started.


What is a Data Analysis Course with Placement?

Simply put, it’s a job-ready data analytics program that combines technical training with dedicated placement support. You’ll learn essential tools & techniques — while also getting coached for interviews, resumes, & job applications.

Here’s what it typically includes:

ComponentDetails
CurriculumPython, SQL, Excel, Power BI, Tableau, Statistics, Predictive Modelling
Hands-on ProjectsReal industry use-cases across domains
Placement SupportResume building, mock interviews, job portal access
CertificationsRecognised data analyst certification with job support
Capstone ProjectFinal live project simulating business scenarios

And that’s exactly what the Postgraduate Program in Data Science & AI by Imarticus offers — a placement-assured data analytics training experience with 35+ tools, live projects & top-tier faculty.


Who is This Program For?

You might be wondering… “Do I need to be a techie to do this?”

Not really.

A data analysis course with placement is ideal for:

  • Recent graduates from any background
  • Professionals in finance, marketing, HR, etc. looking to switch careers
  • Tech professionals wanting to upskill
  • Anyone looking to become a data analyst in India without a tech degree
Data analysis course with placement

In fact, many successful analysts today started out in completely different fields… only to pivot through a job-ready data analytics program.

And if you’re still unsure about making a transition, this guide for career changers into data science offers some great insights.


5 Reasons to Choose a Placement-Assured Data Analytics Training Program

Let’s be honest — there are tons of courses online. So what makes placement-assured data analytics training a game-changer?

Here’s why:

1. Job Guarantee Means Peace of Mind

You don’t just study… you start working. The data analyst certification with job support ensures you’re not left to navigate the job market alone.

2. Curriculum Built by Experts

These programs are designed by data scientists, AI specialists & hiring managers. You learn exactly what companies want.

3. Real-World Projects Build Confidence

Theory is nice, but practice makes a pro. You work on real datasets, real problems… & real outcomes.

4. Mentorship & Networking

Get 1:1 sessions with mentors, connect with alumni, & access a network of 2500+ hiring partners.

5. Flexible Learning Format

Learn online on weekends, manage work-life balance… & still upskill like a pro.


What You’ll Learn Inside the Course

Here’s a snapshot of the high-demand data analytics skills taught in most placement-assured courses:

ModuleSkills You Gain
Data Analysis & VisualisationExcel, Power BI, Tableau
Programming & ScriptingPython, SQL, NumPy, Pandas
Statistics for Data ScienceDescriptive & Inferential Statistics
Machine Learning EssentialsRegression, Clustering, Classification
Capstone ProjectEnd-to-end industry problem-solving

With these high-demand data analytics skills, you’ll not just learn how to clean data or create charts… but how to become a data analyst in India who drives real business impact.


Career Outcomes: Where Do You Land a Job?

Once you complete a data analysis course with placement, you can expect roles like:

  • Data Analyst
  • Business Intelligence Analyst
  • Junior Data Scientist
  • Reporting Analyst
  • Product Analyst

And where do people get hired?

According to Imarticus alumni reports…

Hiring CompaniesRoles Offered
Deloitte, Accenture, IBMData Analyst, BI Consultant
Genpact, Cognizant, TCSAnalyst, Data Consultant
Flipkart, Zomato, SwiggyProduct Analyst, Ops Analyst
Fintech Startups & Healthtech FirmsData Analyst, Decision Scientist

This is why enrolling in a job-ready data analytics program is often the first step towards a global career.

Also check this blog on top data science careers by 2030 — you’ll see how analytics roles are shaping the future workforce.


Hear from Our Alumni

Want to see real stories?

Watch this quick alumni success story video… and see how learners like you have transitioned into high-growth roles.

You’ll find stories of professionals from finance, sales & even teaching backgrounds — all landing roles after completing a data analysis course with placement.


FAQs: Quick Answers Before You Start

Q1: Can beginners enrol in a data analysis course with placement?
Yes… most programs are designed for beginners & non-tech professionals too.

Q2: How long is a placement-assured data analytics training program?
Typically around 6 to 11 months depending on intensity & mode (weekend/weekday).

Q3: What tools do I need to learn?
Python, Excel, SQL, Power BI, Tableau… these are foundational.

Q4: Do I get a certificate?
Yes… a data analyst certification with job support is awarded after completion.

Q5: Is placement guaranteed?
Reputed institutes like Imarticus offer assured interview support & extensive placement services.


How to Choose the Right Data Analytics Program

There are several options out there… but here’s a checklist before you decide:

Must-HavesWhy It Matters
Placement GuaranteeHelps you land a job without delay
Updated Curriculum (with GenAI modules)Keeps your skills future-proof
Live Projects + CapstoneBuilds practical job-readiness
Strong Alumni & Mentor SupportAdds credibility & confidence
Industry CollaborationsHelps with networking & placements

The Postgraduate Program in Data Science & AI by Imarticus checks all these boxes… & more.


Final Thoughts

If you’re serious about entering the data domain, a data analysis course with placement is your best bet. It’s not just about learning tools… it’s about building a future.c

With the right training, mentorship & job support — you can become a data analyst in India faster than you think.

So why wait?

Start your journey with a job-ready data analytics program that understands your goals, supports your growth & connects you to the companies that matter.

From Data to Decisions: The Role of Financial Data Analysis 

Table of Contents

  1. Introduction
  2. The Rise of Financial Data Analysis in FinTech
  3. Predictive Financial Analytics: Anticipating Trends Before They Hit
  4. Regulatory Technology (RegTech) Solutions: Ensuring Compliance in a Digital World
  5. Alternative Data Integration in Finance: Going Beyond Traditional Metrics
  6. Dynamic Financial Analysis (DFA) Techniques: The Real-Time Game Changer
  7. Cloud-Based Financial Analytics Platforms: Agility Meets Accuracy
  8. Machine Learning in Credit Scoring: Precision in Lending Decisions
  9. Blockchain-Enhanced Financial Transparency: Trust through Tech
  10. Key Takeaways
  11. FAQs
  12. Conclusion

Introduction

Every modern FinTech revolution begins with a seemingly simple question: What do the numbers say? In today’s digitally driven economy, the answer lies not just in traditional spreadsheets or quarterly reports, but in deep, continuous financial data analysis. This analytic engine fuels decision-making throughout the industry–from predicting future market trends to developing customer-centered lending models. 

The FinTech space that was, not long ago, defined by audacious innovation and disruption is now evolving to the status of a well-formed data ecosystem. Finance data analysis is key to forming strategies, mitigating risks, and increasing profits. Let’s examine how the FinTech has embraced advanced techniques and tools to convert raw data into meaningful business outcomes.

The Rise of Financial Data Analysis in FinTech

financial data analysis

As FinTech companies scale, their access to real-time and historical data expands. But raw data alone isn’t enough. The true power lies in extracting insights through structured financial data analysis. That means that an agile company with data-driven decision abilities will analyze financials, customer behavior, transaction history, market indicators, and alternative data sets for its advantage.

For the newer FinTechs, this analysis stands as a nexus between profit and loss, risk exposure, customer lifetime value, and compliance issues. It facilitates real-time monitoring and forecasting-everything the industry needs because the Incubator-type sector of FinTech thrives on rapid innovation and adaptation.

Impact of Financial Data Analysis Across FinTech Functions

FinTech FunctionRole of Financial Data Analysis
Credit ScoringAccurate borrower risk profiling
Fraud DetectionIdentifying anomalies instantly
Investment AppsPortfolio forecasting
Payment SystemsCost optimization & compliance
InsurTechClaim prediction & pricing models

Predictive Financial Analytics: Anticipating Trends Before They Hit

Gone are the days of reacting to market changes. With predictive financial analytics, FinTech firms now anticipate future scenarios, enabling pre-emptive actions. This involves using past financial data, customer trends, and market indicators to forecast outcomes with high accuracy.

When paired with financial data analysis, predictive models help startups allocate resources more efficiently, build resilient product strategies, and optimise customer acquisition costs. These analytics solutions are crucial for personalised financial services and dynamic pricing models.

Predictive Use Cases in FinTech

  • Forecasting credit defaults using transactional behaviour
  • Anticipating seasonal cash flow trends in SMEs
  • Projecting churn rates for digital wallet users
  • Predicting insurance claims for InsurTech firms
  • Assessing loan performance before disbursal
  • Forecasting interest rate volatility
  • Budgeting marketing campaigns based on ROI patterns

External Link: Deloitte – Financial Forecasting

Regulatory Technology (RegTech) Solutions: Ensuring Compliance in a Digital World

FinTechs operate in a complex regulatory environment that evolves constantly. Regulatory Technology (RegTech) solutions powered by financial data analysis allow businesses to stay ahead of compliance mandates. These tools automate monitoring, flag potential violations, and generate timely reports for regulatory bodies.

RegTech integrated with advanced analytics can also track changes in regulations across geographies, automatically adjusting internal compliance frameworks. This reduces manual oversight, enhances accuracy, and minimises fines or legal issues.

Core RegTech Capabilities Supported by Financial Data Analysis

RegTech FunctionBenefit
KYC/AML AutomationFast onboarding, reduced fraud
Transaction MonitoringInstant anomaly detection
Regulatory ReportingTimely, accurate disclosures
Risk AssessmentContinuous compliance scoring

External Link: World Economic Forum on RegTech

Alternative Data Integration in Finance: Going Beyond Traditional Metrics

FinTechs are increasingly combining financial data analysis with non-traditional data sources like- mobile usage, social media activity, utility payments, and even geolocation data. This is known as Alternative Data Integration in Finance & it’s transforming credit scoring, investment decisions, and fraud detection.

By analysing this broader dataset, FinTechs can reach the underbanked, create more nuanced customer profiles, and offer more inclusive financial products. These insights help companies tailor financial solutions that reflect the real-world behaviour of their users.

Alternative Data Sources Driving FinTech Innovation

  • eCommerce transaction records
  • Ride-sharing and travel history
  • Social media sentiment
  • Smartphone metadata
  • Rental and utility payment history
  • Satellite imagery for agri-loans
  • App usage and in-app payments

External Link: Forbes – Alternative Data

Dynamic Financial Analysis (DFA) Techniques: The Real-Time Game Changer

Dynamic Financial Analysis (DFA) techniques introduce a continuous and flexible model of financial scenario analysis. Unlike static financial planning, DFA uses live data feeds to model potential outcomes under varying economic and market conditions.

These techniques are particularly powerful in insurance, lending, and trading platforms. Combined with financial data analysis, they help FinTech leaders test strategic responses under simulated stress conditions, improving resilience and crisis planning.

DFA vs Traditional Financial Analysis

FeatureTraditional AnalysisDynamic Financial Analysis
FrequencyQuarterly/AnnuallyReal-time/Continuous
Scenario FlexibilityLimitedHigh
Data Source IntegrationManualAutomated APIs
Decision Making SpeedSlowerImmediate

Cloud-Based Financial Analytics Platforms: Agility Meets Accuracy

The transition to cloud-based financial analytics platforms has democratised access to sophisticated financial tools. These platforms allow FinTech companies of all sizes to store, analyse, and visualise massive volumes of financial data in real time.

By centralising operations and enabling remote collaboration, cloud solutions reduce infrastructure costs while increasing scalability. Embedded financial data analysis tools enhance strategic insights, allowing teams to respond to customer needs and regulatory changes more swiftly.

Benefits of Cloud-Based Analytics in FinTech

  • Real-time data sharing across global teams
  • Seamless integration with CRM and ERP systems
  • Scalable computing for large datasets
  • Improved data governance and audit trails
  • Reduced IT and maintenance overheads
  • Enhanced cybersecurity protocols

Machine Learning in Credit Scoring: Precision in Lending Decisions

Traditional credit scoring models rely heavily on outdated financial metrics. With Machine Learning in Credit Scoring, FinTechs can now evaluate borrowers using advanced behavioural patterns, social data, and real-time financial activities.

Machine learning models trained on financial data analysis uncover nonlinear relationships and hidden risks in applicant profiles. These systems constantly improve their accuracy as more data is fed, resulting in fairer, faster, and more flexible lending decisions.

Traditional vs Machine Learning Credit Scoring

CriteriaTraditional ModelsML-Based Models
Data SourcesCredit reportsMulti-source, real-time
AdaptabilityStaticContinuously evolving
AccuracyModerateHigh
Bias ReductionLowAdaptive fairness models

Blockchain-Enhanced Financial Transparency: Trust through Tech

At the intersection of trust and technology lies Blockchain-Enhanced Financial Transparency. By leveraging immutable ledgers and smart contracts, FinTechs are ensuring every transaction is traceable, secure, and verifiable.

When combined with financial data analysis, blockchain enables efficient auditing, fraud detection, and transparency in investment processes. It particularly benefits peer-to-peer lending, trade finance, and digital asset exchanges, where integrity and trust are paramount.

Blockchain Use Cases in Financial Transparency

  • Tamper-proof audit trails
  • Automated compliance via smart contracts
  • Instant reconciliation across partners
  • Transparent investment reporting
  • Cross-border transaction verification
  • Secure digital ID verification systems

Key Takeaways

  • Financial data analysis is central to decision-making in modern FinTech.
  • Predictive analytics enable accurate forecasts and early risk detection.
  • RegTech and blockchain innovations are reshaping compliance and trust.
  • Alternative and cloud-based data sources enhance strategic agility.
  • Machine learning and DFA bring real-time, personalised financial insights.

FAQs

1. What is financial data analysis in FinTech?

Financial data analysis in FinTech is defined as -analyzing financial data from diverse sources to derive actionable insights that aid business decisions, minimize risks, and better customer experiences.

2. How does predictive financial analytics benefit FinTech firms?

Predictive financial analytics enables FinTech companies to predict trends in markets, user activity & risk factors ahead of time, thus making informed proactive decisions that increase profitability and operational effectiveness.

3. What is the contribution of RegTech to financial data analysis?

 RegTech ensures automated compliance by real-time analysis of financial data, which makes FinTechs able to efficiently comply with regulations while preventing expensive fines.

4. Why is alternative data significant in financial services?

Alternative data broadens the decision making universe by adding non-conventional sources such as mobile usage and utility bills, which yield richer and more comprehensive financial portraits.

5. What is Dynamic Financial Analysis (DFA)?

 DFA is a real time scenario planning approach that employs real-time data feeds to model financial outcomes across various market scenarios, facilitating nimble and risk-aware decisions.

6. What are cloud-based financial analytics platforms?

These are cloud-hosted software platforms through which FinTech companies can conduct robust financial data analysis with scalability, lower IT expenses, and remote access.

7. Software-enhanced credit scoring models: how are they better?

 Machine learning algorithms learn from large real-time financial data to discover patterns and make lending decisions that are more accurate and less biased than conventional models.

8. What is the benefit of using blockchain in financial data analysis?

Blockchain offers secure, transparent transaction records, which when analysed, enhance fraud detection, audibility, and overall financial system integrity.

9. Will small FinTech startups gain from financial data analysis?

Yes, with the emergence of cloud-based platforms and open-source software, even nascent FinTechs can take advantage of financial data analysis to drive better forecasting and product strategy.

10. How does data analysis influence investor confidence in FinTech?

 Strong data analysis raises transparency, delivers reliable forecasting, and improves governance—and all of these contribute to more robust investor trust and funding opportunities.

Conclusion

The advancement of referenced financial data analysis has shifted FinTech from a disruptor to a data-fueled market leader. Technologies such as machine learning, cloud technology, and blockchain will refine their methods of associated predictive analytics and utilization of data for powerful decision making in Fintech. The evolution of those technologies together with financial analytics will closely characterize the next evolution of technological innovation in FinTech. Success will require companies to learn how to not just collect data, but ultimately learn it, leverage it, and to act on it. For in FinTech, the future is undoubtedly data-driven, and isn’t simply digital.

SQL vs Python: What is the Right Data Analysis Tool?

Data analysts are living in a world of ample opportunities. On one hand, you’ve got SQL vs Python for data science, and they’re both serious contenders. SQL is what you need if you’ve got fantastic big relational databases that you need to query; Python’s what you need if you’ve got to clean, model and visualise.

This detailed comparison of SQL and Python, like which is better: SQL or Python, major tricks of Python and SQL for data analysts, data analysis tools comparison, this guide will assist in comparing sql and python, sql vs python pros and cons, and what you need in optimizing your use of both tools so that you can select the optimum tool for each step of your workflow.

Table of Contents

  • What Is SQL vs Python? 
  • Why Use Both SQL and Python?
  • Feature Comparison: SQL vs Python
  • Pros and Cons of Each Tool
  • When to Use SQL or Python
  • Best Practices for Hybrid Workflows
  • Real-World Usage Statistics
  • Unique Pipeline Example
  • Frequently Asked Questions
  • Conclusion & Key Takeaways

What Is SQL vs Python? 

SQL vs Python: which is better?

Depends on the task: use SQL for database queries and set-based operations in a flash; use Python for automation, in-depth analysis and visualisation. Both are used by most analysts to construct robust data pipelines.

Why Use Both SQL and Python? 

Data Extraction: SQL queries a large table with speed.

Data Transformation: pandas and NumPy in Python do sophisticated joins and reshaping.

Machine Learning: scikit-learn, TensorFlow and PyTorch reside in Python.

Visualisation: Matplotlib, Seaborn and Plotly provide low-level control.

Automation & Integration: Python scripts hook into APIs, schedule with cron or Airflow.

Together they offer speed as well as flexibility.

Feature Comparison: SQL vs Python

FeatureSQLPython
Typical UseRelational queries & reportingEnd-to-end analytics, ML, visualisation
SyntaxDeclarative (“what” to retrieve)Imperative (“how” to retrieve)
Learning CurveEasy for simple SELECTs; steep for window functionsModerate; simple Python first, then libraries
PerformanceHigh for indexed-table set operationsHigh using C-backed libraries like NumPy
ExtensibilityOnly to SQL dialect extensionsBig ecosystem: pandas, scikit-learn, Dask
PortabilityDialect variations (MySQL, PostgreSQL, T-SQL)Universal across platforms using virtual environments
Community & SupportMature DB-orientedMassive data-science community
SQL vs Python

Advantages and Disadvantages of Each Tool 

Advantages of SQL

  • Optimised for server bulk data operations.
  • Simple groupby aggregation queries.
  • Built-in security and user access control.

SQL Disadvantages

  • Poorly fitted for nested or unstructured data.
  • Procedural operations need stored procedures or external scripts.
  • Dialect splitting may cause portability problems.

Python Advantages

  • Scales well to accommodate multiple sources of data (CSV, JSON, APIs).
  • Handles machine-learning libraries extremely well.
  • Supports interactive Jupyter notebook development.

Python Disadvantages

  • Slower in direct database querying without optimisation.
  • Needs environment and dependency management.
  • Sloping initial setup for data-pipeline frameworks.

When to Use SQL or Python 

  • Simple Aggregations & Joins: SQL
  • Exploratory Analysis: Python on Jupyter
  • Production Pipelines: SQL ELT with Python transformations
  • Machine Learning Models: Python
  • Ad-hoc Reporting: SQL + Python automation scripts

Best Practices for Hybrid Workflows

  • Push Down Computation: Offload heavy aggregations to the database using SQL.
  • Selectively Extract: Only fetch required columns and rows using SQL.
  • Version Control: Put Python scripts and SQL queries under version control in Git repositories.
  • Parameterised Queries: Do not permit SQL injection in Python connectors (e.g., psycopg2).
  • Reusable Modules: Bundle common Python functions into modules for ease of maintenance. 

Real-World Usage Statistics

A Stack Overflow 2023 survey illustrated that 68% of career experts use SQL and Python together, highlighting their complementary relationship. 

As DeepLearning.AI illustrates how over 90% of data experts use Python for analysis while close to 53% still use SQL as a default query language .

Unique Pipeline Example: ELT + Python

  1. Extract: Query raw data in PostgreSQL with SQL’s COPY command.
  2. Load: Import CSV into a pandas DataFrame.
  3. Transform: 
  • Clean missing data with df.dropna().
  • Create new variables (e.g. rolling mean).
  1. Analyse: Run statistical tests with SciPy.
  2. Visualise: Plot trends with Matplotlib.
  3. Deploy: Save last tables to a database or publish with Flask API.

This hybrid workflow combines SQL’s performance with Python’s flexibility.

Introduction to SQL Commands | Essential SQL Basics for Beginners| Part 1 

What is Python? Introduction to Python | Python Tutorial

Frequently Asked Questions 

Can I learn SQL and Python?

Absolutely—begin with straightforward SQL SELECTs, then learn pandas and NumPy in Python.

Which one is faster for big data?

SQL is set-based optimised; Python accelerates through C-backed libraries.

Do I need to know both to do data science work?

Pandas and SQL are both essential for most data analyst and data scientist jobs.

One can use them together or separately, depending on the project.

How do I link Python with my database?

Utilise adapters like psycopg2 for PostgreSQL or pyodbc for SQL Server.

Is machine learning feasible in SQL?

Some platforms (e.g. BigQuery ML) do support ML, but Python and its libraries otherwise are more versatile.

Can Python replace SQL entirely?

Not for simple relational queries—SQL remains ideal for rapid database querying.

What should I learn?

  • Official SQL Tutorial (W3Schools)
  • pandas Documentation
  • Python.org

How do I enjoy performance with Python?

Utilise vectorised operations via NumPy and avoid Python-level loops.

Do best-practice frameworks matter?

Utilise Airflow. Prefect. to schedule SQL and Python tasks in production.

Conclusion & Key Takeaways 

An understanding of SQL vs Python is the best data analysis toolset. Utilise SQL for fast wrangling and pre-aggregating data; utilise Python for running advanced analysis, building predictive models and automating reports.

Key Takeaways:

  • Utilise SQL for database querying and ELT at scale.
  • Utilise Python for data conversion, machine learning and visualisation.
  • Utilise a hybrid approach for optimising performance with flexibility.

Want to change your career to a better one? Stop by Imarticus Learning’s Postgraduate Program in Data Science & Analytics, learn from industry experts on SQL and Python, and become a part of the league of data professionals who make business decisions a reality today:

From Novice to Expert: Excel For Data Analysis Mastery

Excel for Data Analysis is the tool of decision-making today, enabling business professionals to extract usable insights from unstructured data. 

This blog guide will show you how to leverage the amazing power of Excel—from simple formulas to high-level add-ins—so that you can advance from novice to expert.

In this guide you will learn how to master excel for data science, what are the excel functions for data analysis, what are the excel tools for business analysis. From business analyst to budding data scientist or just enthusiastic about developing your spreadsheet skills, this article is a step-by-step, easy-to-understand guide.

What Is Excel for Data Analysis?

Excel for Data Analysis is using Excel functions and formulas of data and visualisation tools to derive insights, identify patterns and enable evidence-based decisions.

Excel for Data Analysis leverages native functions (SUMIFS, XLOOKUP), data preparation (Power Query, PivotTables) and visualisation (dashboards, charts) to transform raw datasets into clear, actionable reports.

Why Excel Matters in Data Science

In spite of the introduction of specialised BI platforms, Excel is non-negotiable:

  • Daily Workflow: 81% of professional data analysts use Excel on a daily basis as part of their workflow to perform rapid explorations.
  • Global Adoption: Microsoft 365 has been used by more than 750 million users globally, and Excel is therefore the shared baseline to work with data.
  • Sequences Easily: Excel sequences easily with Power BI, SQL and Python with xlwings
  • Job Market Demand: According to Indeed, 87% of jobs require data analysis skills in Excel as a minimum.
  • Industry Standard: 45% of finance professionals cite Excel as their go-to analytics tool based on a 2023 Financial Times survey.

Key Excel Formulas for Data Analysis

Become familiar with essential Excel formulas for data analysis by memorising the following essential formulas:

  • SUMIFS / COUNTIFS: Spends, sales and conditional counts totalling.
  • XLOOKUP / VLOOKUP: Return matching values between tables.
  • IF, AND, OR, IFERROR: Logical tests and errors.
  • INDEX / MATCH: Flexible lookups without sorted data.

Comparison of Core Functions

FunctionPurposeExample
SUMIFSTotal values that meet constraintsTotal sales where Region = “APAC” and Month = “Jan”
XLOOKUPReturn values in rows or columnsReturn Price for ItemID 102 in another sheet
IFERRORReplace error with friendly messageDisplay “N/A” instead of #DIV/0!
INDEX/MATCHTwo-step lookup replacing VLOOKUPLookup Salary for “Arun” without sorted data

Advanced Add-ins and Advanced Tools

Aside from formulas, these add-ins provide advanced analysis:

  • Power Query: Automate extract, transform, load work in Excel.
  • Power Pivot: Build relational data models and execute DAX calculations.
  • Power Map: Map geographic data in 3D maps to analyse spatial data.
  • Analysis ToolPak: Run regressions, histograms and ANOVA tests with a click of a button.
  • Third-Party Add-ins: Advanced operations such as batch merging or sophisticated cleaning are eased by Ablebits (https://www.ablebits.com) and other programs.

Step-by-Step Excel Training Track

Follow this step-by-step Excel training track:

ModuleTopics Covered
Fundamentals & FormattingLearn ribbon navigation, manage worksheets, and conditional formatting
Core Formula SkillsSUM, AVERAGE, COUNT, DATE/TEXT functions, and nested IFs
Intermediate FeaturesPivotTables, data validation, and custom number formatting
Advanced AnalysisPower Query for cleaning, Power Pivot for modeling, simple VBA macros
Dashboards & VisualizationInteractive charts, slicers, and dynamic dashboards

Tips, Tricks & Keyboard Shortcuts

Spend less time working with these Excel skills for data analysts shortcuts:

ShortcutAction
Ctrl + TConvert range to Table
Alt + D + PAdd PivotTable
Ctrl + Shift + LToggle filters
F4Repeat last action or toggle reference
Alt + H + O + IAuto-fit column width
Ctrl + ;Insert current date
Ctrl + `Alternate between formula view
Alt + F11Open VBA editor

Advanced Visualisation Techniques

Clearness of visualisation is the secret to reporting success. Try:

  • Sparklines: Insert small-charts in cells to uncover trends.
  • Waterfall Charts: Illustrate incremental change in a series.
  • Treemaps & Sunbursts: Show hierarchical data within a constrained space.
  • Dynamic Dashboards: Alternate between PivotCharts and slicers and timelines for dynamic views.
Excel for Data Analysis

Pitfalls to Avoid

The masters are not infallible. Avoid:

  • Hard-coding Values: Never hard-code fixed values in formulas—use cells instead.
  • Overcomplicated Formulas: Break complex logic into helper columns to make it readable.
  • Ignoring Data Types: Keep dates and numbers in different columns than text data.
  • Overlooking Documentation: Include comments or a Data Dictionary sheet to explain your model.

Real-World Case Study

A Fortune 500 company required real-time campaign measurement via worldwide marketing. By blending feeds of day-to-day sales with Power Query and optimizing monthly performance reports, they reduced report development time by 60% and boosted campaign ROI by 30% within three months.

Collaborative & Secure Analysis

New workflows require collaboration:

  • Excel Online & Teams: Enable co-authoring in real-time and discussion with your workbook.
  • OneDrive & SharePoint: Version history with centralized storage.
  • Secure Sheets/Workbooks: Lock edit and password-protect sensitive information.

Data Analysis Using Excel Spreadsheets

To analyse data with Excel spreadsheets, use the following procedure:

  • Initial Audit: Check data quality—missing or conflicting records.
  • Data Cleaning: Trim whitespace with Power Query, remove duplicates and column splits.
  • Structured Tables: Range to Table to allow dynamic named ranges.
  • Analysis & Visualisation: Create PivotTables, chart best practice.
  • Review & Interpret: Add captions, annotations and conditional formatting to highlight key findings.

Video Tutorials to Accelerate Learning

Excel Tutorial | Beginner to Advanced – Part 1 

FAQs

1. What Excel Data Analysis skill set is needed?

Arithmetic basics, interest and learning approach to functions and tools.

2. Can Excel manage large sets of data?

Excel 365 can deal with 1 048 576 rows; Power Pivot can deal with very much larger tables.

3. Is VBA a requirement for analysis?

VBA does repetitive work, but Power Query will make unnecessary macros irrelevant and replace ETL for most tasks.

4. How do I begin with PivotTables?

Select your data, Ctrl + T to make it into a Table, then Insert → PivotTable.

5. XLOOKUP vs VLOOKUP—what do I use?

XLOOKUP looks both ways, exact match default and handles missing values nicely.

6. Are Excel certifications worth the cost?

Yes—certifications help in improving the credibility of your CV.

7. What add-in do I use for stats?

Analysis ToolPak has regressions, ANOVA, t-tests and descriptive stats.

8. How frequently should I practice Excel skills?

Daily bite-sized practice (15–20 minutes) solidifies learning and builds habit.

9. Can you use Excel with other platforms?

Yes—works with SQL Server, Power BI, Azure services and Python (with xlwings).

10. How do I share secure reports securely?

Use password-protected sheets, share using OneDrive/SharePoint and manage permissions centrally.

Conclusion

Excel Data Analysis Master allows you to gain transferable, world-class data-driven decision-making skills in any industry.

Key Takeaways:

  • Formula Foundations: Excel formulae like SUMIFS, XLOOKUP and logical tests are your analysis foundation blocks.
  • Automation & Modelling: Use Power Query and Power Pivot to handle large data and routine workflows.
  • Good Visualisation: Employ Tables, PivotCharts and slicer-based dashboards to provide clean, interactive insights.

Ready to take the next step? Learn more about the Postgraduate Programme in Data Science & Analytics by Imarticus Learning and master hands-on skills on Excel and more.

Power BI Training: Business Intelligence Unlocked

Power BI Training allows professionals to transform raw facts into insightful reports. Having skills in features such as Power Query, DAX measures and interactive dashboards, students can offer automated reporting and facilitate strategic planning. 

Power BI Training bestows business value on your company’s analytical potential and accelerates career growth.

In this blog post, we will cover how you can enhance business intelligence with Power BI, what are some great Power BI certification programs are, how to do data visualisation using Power BI and some great Power BI skills for data analysis that one should learn.

What Is Power BI Training?

Power BI Training is a systematic training of data extraction, modelling and visualisation with Microsoft Power BI. Students get hands-on practice using Power BI Desktop, Power BI Service and Power BI Mobile. This short definition can be used as a featured snippet for quick queries.

Why Power BI Training for Professionals?

  • Improve data-driven decision-making with interactive dashboards
  • Save time with report generation and minimise manual effort by up to 30%

Acquire Power BI expertise for analytics and Advanced Power BI techniques

Plan for Power BI certification course (PL-300 test)

Sync business analytics fundamentals with business strategy and maximise ROI

With the acquisition of Power BI expertise for professionals, companies realise a 25% stakeholder satisfaction gain and a 40% team productivity boost (Gartner).

Key Modules in a Comprehensive Power BI Certification Course

  • DataConnectivity & Transformation – Excel, SQL Server and cloud data source import
  • Data Modelling & DAX – Define calculated columns, measures and relationships
  • Data Visualisation Using Power BI – Design charts, maps and custom visuals
  • Power BI Dashboard Training – Publish, share and administer dashboards in Power BI Service
  • Advanced Power BI Techniques – Leverage row-level security, Paginated Reports and AI insights

Each module enforces Learn Power BI business intelligence best practices and puts them into real-world practice.

Unique ROI-Centric Approach

Attributes are often the target of courses, but ours links every skill with measurable business value. A logistics unit, for example, can monitor real-time supply chain KPIs and cut delays by 15%. ROI design ensures Business intelligence via Power BI equals cost savings and competitive advantage.

Statistic Spotlight

80% of businesses will be employing business intelligence software to inform strategic decisions by 2026 (Gartner).

The demand for data visualisation specialists is expected to grow by 40% by 2026 (Source).

Companies using BI software experience a 127% ROI in three years.

Programme Insights: Imarticus Learning Case Study

Imarticus Learning Postgraduate Program in Data Science and Analytics includes training in Power BI dashboards alongside Python, SQL and Machine Learning. 

Highlights:

  • 6-month duration of learning with 300+ hours of study
  • 25+ interactive projects using real business datasets
  • 100% job assurance with 10 interviews
  • 10+ tools exposure like Power BI, Tableau and AWS

Best Practices of Implementing Power BI

Successful organisations adopt the following practices while implementing Power BI:

  • The Governance Framework: Establish data access rules and version control.
  • Standardised Visuals: Create template dashboards in order to maintain consistency across teams.
  • Continuous Training: Provide refresh sessions and office hours to solidify skills.
  • Monitoring Performance: Track usage statistics to find unused reports and improve them.

Setting these practices will increase user adoption by 50% in the first quarter (Power BI Community).

Bridging Common Challenges

Common Power BI Challenges and Solutions

ChallengeSolution
Slow Refresh RatesStreamline data models by removing redundant columns
DAX ComplexityStart with template measures and work incrementally to customize
Security ConcernsUtilize row-level security to protect sensitive information
Integration IssuesUse Power BI gateways to connect easily to on-premises data

Resolving these concerns early prevents bottlenecks and ensures smoother deployment.

Community and Learning Resources

ResourceDescription
Power BI CommunityForums, blogs, and user groups
Microsoft LearnOfficial tutorials and learning paths
YouTube ChannelsPragmatic Works, Guy in a Cube
LinkedIn LearningProfessional courses led by experts

These resources complement formal Power BI training and help you stay updated on new features.

Watch this video series to understand Power BI from beginner to expert

Introduction to Power BI – Master Data Visualization & Business Intelligence | Module 01 

Frequently Asked Questions

Q1: What prerequisites are needed for Power BI Training?

A basic understanding of Excel and general database concepts will make learning easier.

Q2: How long does it take to obtain Power BI certification?

Typically 4–12 weeks, based on full-time or part-time study schedules and the quantity of detailed advanced modules.

Q3: Can non-technical departments learn Power BI skills too?

Yes—marketing, HR, and finance departments can leverage dashboards to monitor KPIs and automate reports.

Q4: Are Advanced Power BI techniques involving programming skills?

No, but proficiency in SQL or Python enhances the ability to work with AI insights and tailored visuals.

Q5: What do I certify?

The authentic PL-300: Microsoft Power BI Data Analyst certification exam delivers global validity (Microsoft Learn).

Q6: Is placement support available for courses?

Companies like Imarticus Learning offer career guidance, mock interviews and company interview guarantees.

Q7: How does Power BI differ from Tableau or Qlik?

Power BI works in harmony with Microsoft 365, is budget-friendly, and is perfect for cloud collaboration.

Q8: Will there be AI functionality in Power BI?

Yes—AutoML, cognitive services and AI visuals enhance predictive analysis and natural language query.

Q9: Is online learning a possibility?

Live online classes, recorded classes, and virtual labs are available for the majority of courses for students across the globe.

Q10: What jobs can graduates find?

Typical roles include Data Analyst, BI Developer, Business Intelligence Manager and Data Scientist.

Conclusion

Power BI Training concepts—spanning from data transformation to AI-powered insights—makes you ready to lead data-driven initiatives. Your training investment will result in real business value and professional growth.

Key Takeaways:

  • Gain real-world proficiency in data modelling, visualisation and dashboard deployment.
  • Apply advanced techniques like AI insights, row-level security and Paginated Reports.
  • Apply best practices, community support and certifying help towards long-term success.

Ready to game-change with data?

Enrol in our Postgraduate Program in Data Science and Analytics, learn Power BI and start making decisions today from your data!

Top Visualization Tools 2025

With our data in front of us today, information at speeds, the game is not about data, it’s about story. It’s not fiddling with data, it’s the way you dress up the story behind it. And that is where nice data visualization software comes into play to take raw sets of data and convert them into nice stories that teach, persuade, and inform decision-makers. Whichever one’s role, business executive, analyst, or future data scientist, by 2025, it is no kindness to be able to select the right visualization tools and employ them.

From dashboards to infographics, data visualization tools are the critical bridge between action and comprehension when it comes to data complexity. We’ll be marking, within this article, as listed below, the best data visualization tools, chronicling data storytelling practice, and walking you through how you can choose best-suited visualization tools for data storytelling from your needs and use case.

Why Are Visualization Tools Important for Storytelling?

The phrase “a picture is worth a thousand words” can never carry more waters more so in the era of data. It’s only with data visualization through stories that substance understanding is built, stimulation is evoked, and decision-making accelerated. Dailies will no longer be adequate in the era of big data and analytics. Visualization platforms are capable of uncovering:

  • Gigas of data
  • Informed analysis results
  • Best practices in performance
  • User behavior

These are technologies which are yet embedded in the data storytelling process, mining analytics and converting them into raw data which are converted into stories stakeholders can visualize and react to.

Visualization Tools

What Are the Best Data Visualization Tools in 2025?

Time to view the crème de crème of data visualisation software already having its way out here in 2025. They’re all going all-out on the frontline of interactivity, pipeline integration, and design autonomy—all that one needs for data visual storytelling.

1. Tableau

Why it’s popular:

Tableau is still one of the top interactive data visualisation software creators. Its robust drag-and-drop tool and real-time analysis are used by business and users in huge numbers.

Use Case:

  • Business dashboards
  • Sales and marketing analysis
  • KPI monitoring

Strengths:

  • Sweet appearances, interactive
  • Does massive amounts of data sets
  • Easy to navigate

2. Power BI

Why it’s trending:

Power BI is one of Excel’s and actually Azure’s better-aligned products. One of the more useful data science courses that also teaches Power BI.

Use Case:

  • Enterprise reports
  • Cross-department KPIs
  • Stakeholder reports automated

Strengths:

  • Functions well in Microsoft ecosystem
  • AI capabilities built-in
  • Cost-effective with large team sizes

3. Looker (Google Cloud)

Why it’s crucial in 2025

Looker offers data storytelling features in the guise of embedded analytics and real-time dashboards. It is not so directly connected with SQL databases for high-performance applications.

Use Case:

  • Real-time customer insights
  • Predictive model dashboards

Strengths:

  • Cloud-native
  • Custom visualization with Looker Blocks
  • Robust developer support

4. D3.js

Why developers love it:

D3.js is a JavaScript library where you have complete control of your visualizations. It’s perfect for custom visual data storytelling.

Use Case:

  • Individual custom infographics
  • Interactive web embeds
  • Scientific data discovery

Strengths

  • Free and open-source
  • Adjustable to the pixel
  • Extremely interactive

5. Plotly

Why everyone loves it:

Plotly is cross-language with Python, R, and JavaScript support and is therefore extremely versatile. With Jupyter notebook support, it’s the most convenient way of using data science in Python.

Use Case:

  • Exploratory data analysis
  • Technical Research
  • Machine learning model visualizations

Strengths:

  • Open-source options are available
  • Get good-looking charts
  • Interactive 3D plots

Visualization Tools for Data Storytelling: Key Features to Consider

Choosing between top visualization tools is based on a set of factors:

FeatureWhy It Matters
InteractivityInteractive charts improve engagement.
CustomizationEnables precise branding and layout control.
Real-time updatesEssential for operational dashboards.
IntegrationConnects easily to your data warehouse or APIs.
CollaborationShared dashboards for team-wide insights.

Data Storytelling Techniques Using Visualization Tools

Some of the effective data storytelling strategies you can employ with visualization tools are the following:

Start with the “Why”

Choose one question to be the pivot of your visualization. Inform the viewer why the chart is responding.

Focus on One Message per Chart

Simple. One picture, one important message.

Show Trends, Not Just Numbers

Line charts, bar charts, and scatter plots help to draw attention to change and relationship.

Use Colours Wisely

Colours are emotive and memorable. Use good, thoughtful colour schemes.

Sequence Your Visuals

Your data movie has a start, middle, and finish, like film.

Interactive Data Visualization Tools: What Makes Them Different?

Interactive data visualization platforms support clicking, hovering, and filtering to levels of comprehension. It is required in:

  • Executive dashboards for managers
  • Real-time monitoring
  • Exploratory analytics in product teams

Tableau, Power BI, and Looker are the most interactive. They support drill-downs, dynamic filtering, and real-time refreshes—2025’s data visualization software program necessities.

Choosing the Right Data Visualization Software in 2025

Every tol does not fit every user. Use the comparison table below to assist you in choosing the data visualization tool 2025 best for you:

ToolBest ForCostCustomisationLearning Curve
TableauEnterprises & AnalystsMedium–HighHighModerate
Power BIBusiness UsersLowMediumLow
LookerCloud TeamsHighHighModerate
D3.jsDevelopersFreeVery HighSteep
PlotlyData ScientistsFree/PaidHighModerate

Real-World Application: Imarticus Learning’s Data Science Program

If you wish to be a data storyteller with visualization capacity, then Imarticus Learning’s Postgraduate Program in Data Science and Analytics takes you there.

What You Get:

  • 6 Months Course Duration
  • Classroom & Live Online Training
  • 10 Interview Guarantees
  • 25+ Assignments on Visualisation Tools such as Power BI & Tableau
  • Tools Included: Python, SQL, Tableau, Power BI, and more
  • Hackathons to develop visual storytelling skills

This 100% job-introduction course for freshers and early professionals has placed over 15,000 students, some in the top 22.5 LPA.

Frequently Asked Questions (FAQ)

1. What are today’s top used data visualization tools?

They consist of Tableau, Power BI, Looker, D3.js, and Plotly. They go from dashboards to complex data science visualizations.

2. Why 2025 data visualization is so important?

Data visualization in 2025 is required because quicker interpretation of data-driven decisions is the hour of need. Data visualization tools facilitate quicker interpretation of data and insights for every member of every department.

3. Are new recruits able to learn such kinds of tools easily?

Yes. Such tools like Power BI and Tableau can be easily learned by freshers. Freshers can become masters of such tools through training like that done by Imarticus.

4. Is data visualization built with Python?

Yes. With the help of libraries like Plotly, Seaborn, and Matplotlib, extremely interactive plots can be created, especially for the data science pipeline.

5. What is the best tool to present business tales?

Both Power BI and Tableau are good to design business-oriented dashboards and presentations.

6. Is there a free data visualization tool?

Yes. Plotly and D3.js are free but need coding and a lot of customizing.

7. What is the go-to tool of the data scientist?

Python libraries such as Seaborn, Matplotlib, and Plotly are utilized because they are installed by default in Jupyter Notebooks and machine learning pipelines.

8. Do we work with more than one tool for each project?

Yes. For instance, batch image cleaning using Python, Tableau visualisation, auto-reportings via Power BI.

9. How to be a data storytelling master?

Begin with learning a tool, followed by project-based learning, and then job-assure courses such as the Imarticus course so that there is hands-on exposure to projects.

10. Data visualization future?

It will be visualisation based on AI-driven narrative, natural language searching, and anticipated real-time visualisations.

Conclusion

In today’s era of big data, gold is not accumulation—but show. Great visualization tools can turn raw results into great stories that make decisions and produce outcomes. Beginning 2025 and onwards, through the use of platforms such as Tableau, Power BI, Looker, Plotly, and D3.js, you can narrate more real stories, whether you are a finance expert, marketer, or tech expert, or educator.

If you start from the ground up or even if you want to start from scratch, an investment in systematic learning in Postgraduate Program in Data Science and Analytics by Imarticus Learning opens doors to the new technology, experiential practice on skills, and assured placement.

It is the quickest, strategy-oriented way to become the graphically story-telling wizard with data in today’s era of competition.