

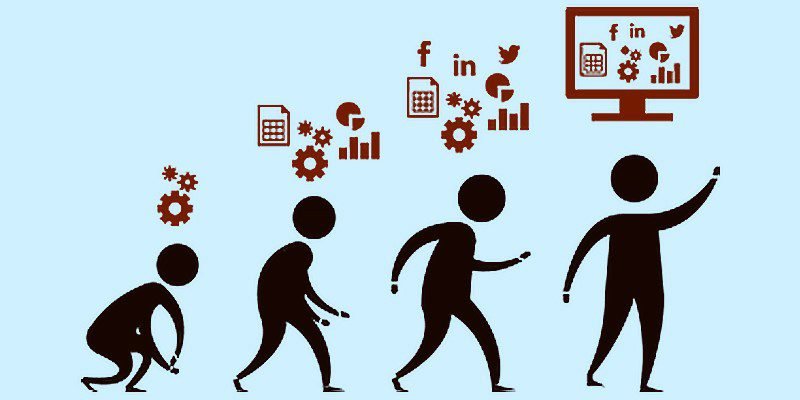
Evolution of data science in India
In today’s bustling world an unprecedented amount of data is being generated by businesses and firms. The pinnacle of data proliferation pressurized on the businesses to employ specialized professionals apt for the tasks. The amount of digital data that exists today is at a staggering rate and is bound to increase by a large extent in the future. Data science is considered a young profession or a relatively new concept which became popular after a decade in 2010.
Initially, statistics and statistical tools were implanted in data science which later clubbed with the growing technology and newer and sophisticated concepts like Artificial Intelligence, Internet of Things and Machine learning for better results. Data science is basically the study of data which is in structured or unstructured form. It is a process of collecting, storing, analyzing and processing the data using various statistical tools and machine learning for producing meaning insights.
Revolutionary data science in India
Before the arrival of data analytics, the blue-chip companies and consulting businesses ruled the analytics market. By removing the barriers in the industry cloud technology has made it possible for start-ups to emerge in this field fearlessly. Big businesses to start-ups all rely largely on data science for solving their simple to complex problems.
Hence, it is appropriate to say data is the new oil for businesses. Many developed countries like USA, UK, Singapore, and Australia are a favorite destination for Indian analytic experts next to software professionals. A study by Analytics India Magazine reveals that the US pays $11b to India for data analytics annually.
The evolution of data science in India is tremendous and hence India is amidst top 10 countries for analytics in the world with over 600 analytic firms out of which half of them are start-ups and the number is expected to increase with the increased efficiency in its solutions and products.
Banking and finance are the prominent industries that use data analytics and revenue generated from these industries is more than 30% in India. Apart from finance and banking, marketing, pharma, advertising, and healthcare are other sectors which rely on data analytics by a large extent. Thus, data analytics, data science, and big data industry are set to double in India by 2020.
Digitalization banking data science to a great extent
In the present business, data is considered the most valuable thing even more vital than money, since data analysts use them for figuring more opportunities. Data science is a multi-disciplinary subject which effectively produces smarter business moves convincing the customers generating more revenue. Digital business is able to build a larger customer base by utilizing smarter data analytic techniques to identify the tastes and preferences of individual customers in India and brings about a satisfying solution.
Once online retailing has established a positive outcome from using big data to understand its customers, the same big data technique is applied in different sectors like engineering, medical, academic research, and social science to name a few. The availability of the huge amount of data has led to its widespread application for arriving at effective and efficient solutions or products.
Cloud and its impact on millennials favorite data science
Cloud computing has created a revolution in data sciences which has made data centers more accessible at moderate prices thus creating a boom in the Indian market. The trending fact is that earlier only Bangalore and Delhi were major contributors in this sector in India but Pune, Chennai, and Hyderabad are not far from joining the racing market.
Data science is a vast sector with the widespread application of its techniques business identify opportunities, frame better goals and create productive solutions. This has created more demand for professionals who can analyze and scrutinize the data by understanding better insights within the data.
To flourish in this exciting field full of challenges one needs Data Science Training for gaining a comprehensive knowledge of the subject. The millennials like data science as it does not pose and restrict their functionality. Data science and millennials are interconnected as highly responsive and engaging marketing based on their preferences using data analytics drive today’s marketing with the use of advanced cloud technology.
To sum up
As you can see the evolution of data science over the last ten years has been tremendous and will continue to do so with the splurging demand for data analytics across many sectors. Data science is a promising sector which got prominent attention with the advancement in technology. As consumers are embracing digitalization, more scope of data science in India is inevitable.
Tag: data science courses
Sandeep’s Review of Imarticus’ Data Science Course

We caught up with Sandeep, a recent graduate of the Post Graduate program in Analytics, for a quick chat to get his perspective on the program, the curriculum, Imarticus Learning’s placement process and more.
Tell us a little bit about yourself.
Sandeep: My name is Sandeep Singh. I recently completed my B.Sc. in Computer Science and was looking for an avenue to enhance my analytics skills and start my career.
 I came across Imarticus’ data science course and, after thorough research, decided to enroll for it. I completed the course and have been placed at M Technologies through Imarticus.
How has your experience been with Imarticus Learning?
Sandeep: My experience with Imarticus Learning was super! The course focused on practical training with hands-on learning of various analytical tools and thorough practice with numerous datasets.
Looking back, I see the importance of actually applying Analytical tools and techniques to the projects I worked on because it gave me a running start when I began working.
What has changed since you joined Imarticus Learning?
Sandeep: Since the day I joined Imarticus my confidence has been boosted to a very high level. Through the practice of various analytical tools such as R, Python, SAS, Tableau, etc. I’ve come to believe in myself. My soft skills have also been elevated with the help of business communication workshops, mock interviews, and soft skill sessions throughout the course.
Would you recommend the program to someone else?
Sandeep: While researching various institutes, I came across some reviews that say Imarticus Learning is fake. Well, I wanted to see for myself and now that I have, I would definitely recommend Imarticus. If you’re looking for an institute, the first thing that comes to mind is the faculty and the learning material.
The faculty and staff are very cooperative and help you both inside and outside the classroom. The learning material is extensive and covers every aspect of data analytics. The best part is all of the lectures, notes, datasets, and quizzes are stored in an online Learning Management system and is available to students anytime, anywhere.
What do you like most about Imarticus?
The best thing about Imarticus Learning was the course content, the cooperative staff and the informative notes that are easily accessible. The resume building workshops and mock interviews definitely prepared me for the placement drives and I was able to crack the interview and land a job at M Technologies.
Looking to get started on your data science career, Speak with a counselor and get matched with the best course for you.
What Business Analysts Do?
Most of us have heard the term “business analyst”, but seldom people know what their expertise or roles are. According to the BABOK Guide by the International Institute of Business Analysis, business analysis is “knowing how organizations function to accomplish their objectives and defining the capabilities an organization needs to produce products and services to external stakeholders”. In short, they bring about the change stakeholders want to see in their organization.
Explaining all the things a business analyst do might not be helpful as this varies from industry to industry. However, there are a few, critical aspects of their role that span across industries and are specific to their key skills. They comprise of:
Understanding the Business
A business analyst training courses are primarily required to understand the organization and the way it works in the current scenario. In the second stage, they plan a road-map that details the ideal future of the company, in-line with the inputs of project team members, leaders, stakeholders, and subject matter experts.
One important thing they can do is that they can ask dumb questions without actually looking stupid. These questions often help to devise easier ways to take the organization where it needs to be.
The next thing a business analyst has to do is documentation of the current process to help solve the problem they are trying to refine. These documents involve modelling of the current system using diagrams. These models help to figure out the difference between actual and established protocols.
Devising the Solution
After proper understanding of the business and its requirements, brainstorming sessions are led by the business analyst to devise a solution for the problem. Researches are conducted both inside and outside of the organisation. Data analysts participate in the requirements gathering process to ensure his/her knowledge has the depth and context demanded by the problem.
Zeroing in on the best solution for the problem statement given to them, is the responsibility of a business analyst. A business analyst should also translate the organization-specific lingo into the terms that engineers can keep in their mind. To do this, rudimentary understanding of technical systems and their working is recommended. Various tools such as Gap Analysis, Root Cause Analysis, and Business Process Modelling can be used to compare the different solutions.
Blend Business with Technology
The job of a business analyst does not end with implementing the solution. They have to make sure that the technical operations meet the business needs of the organization. For that, involvement in system testing and creation of user manual are common practices followed by the analysts.
Business analysts offer choices to the organization without being afraid of ideas being shot down. They collect every data about each process and pick at every facet to see how things work. These people work as a catalyst for the change in the organization. With their documentation and analysis skills, they give valuable suggestions to the organization.
First, they understand the organization, its processes and goals and then implement the changes they need. This quote especially pertinent to the role that business analysts play when Stephen Covey’s fifth habit of highly successful people: “Try first to understand, then to be understood.”
Become Data Scientist in 90 Days
Data science is similar to any other field of science. The scientists involved conducted their own research and based on the information available form hypothesis and theories. However, in the case of data science, these hypotheses are created based on the data made available to the concerned scientists. The primary factor which an individual must consider in order to become a data scientist within a span of 90 days is to understand and to have a knack for analyzing data.
A career in data science is a hot topic in the present market. Organizations all around the globe are relying on big data, and for that skilled data, a scientist is required. Analysis of collected data involves the visualization of the data which is then backed up by creating reports after identifying specific patterns. However, what sets Data Science apart from the more traditional business analysis is the use of complex algorithms. The advanced algorithms such as neural networks, machine learning algorithms, and regression algorithms are used to scan the available data in order to identify the meaning and the purpose of the numbers and codes.
To become a data scientist an individual must have adequate knowledge about the fundamentals and the framework of these algorithms. This can only be possible when the concerned individual has a tremendous foundation for mathematics and statistics. So if you are aspiring to be a data scientist, make sure to get the basics right by keeping track of your mathematics as well as statistic skills.
Another foremost fundamental of data science is to know and understand the purpose of this study. The sole objective of a data scientist is to answer various questions. The study of data is carried out so that the probable questions can be answered by going through and analyzing a large set of recorded data. Let us consider the example of the popular entertainment network Netflix. In 2017, Netflix put forth a petition where a million dollars would be paid to a data scientist who would successfully improve the suggestion algorithm of the network.
Such is the demand and the requirement of the data scientist in the current market. Now for beginners, it is essential not to get into complex codes and a large amount of data. Analysis of large data would automatically mean the use of multiple algorithms. In order to become an efficient data scientist within a span of 90 days, it is critical to know personal strengths and weaknesses. Taking small steps helps as it builds confidence as well as enhances skill gradually. By considering these subtle factors, an individual can learn data science in no time and become proficient at it.
Another essential factor of becoming a data scientist is to go beyond the learning of Hadoop. There are many data science courses which not only helps you to be efficient with Hadoop but also assists you to gain real knowledge about reading and understand the various algorithms which are part of this data science game.
So to conclude, data science is a field which requires knowledge from all domains. A combination of mathematics, statistics, and algorithms give rise to data science. The job of a data scientist is not only to create a hypothesis, but also to find data which proves the formulated hypothesis to be correct. Thus, all these elements make the study of data science unique and challenging to master. However, with the right guidance made available through data scientist courses, an aspiring individual can surely reach the pinnacle of the data science industry.
Tips that Will Help Elevate Your Career as a Data Scientist
For a data scientist, appearing smart should be the topmost priority. It will not only elevate your self-esteem among others but will also keep you self-motivated. It’s not just for the data scientists but also for the individuals employed in different sectors as well. Even if you have a great knowledge and depth in your field, may not be able to reach the heights of your potential.
In this case, having the right attitude, personality, and communication skill helps you to achieve your targets. Also, the job market for the data scientists is getting tougher day by day. Thus, in order to bag the right job for you, only if you learn data science, that may not be enough. That is why in this article, let’s explore four tips that will make you stand above the rest in your data scientists career.
Have a Sporting Attitude towards Competitiveness
There is no doubt today, wherever you go, you will face competition. Even if you are looking for a job or in a company, you will face tough competition from others. If you feel scared or if you just back off from that competition thinking that you are beyond it or don’t have the ability to compete then I am afraid you will never going to make it. If you want to have a successful career as data scientist after completing data science courses then you have to embrace the competition that you have in front of you. Only having the knowledge of statistics for data science will not going to help your cause because, at this age, your attitude plays a key role.
Look Beyond the Job Title
Data science salary and job titles may vary from company to company. By just hearing the name of the position, it will be hard for you to make out whether the position you are getting in that company is the position you wanted for yourself after completing the data science courses. Asking about what would your responsibilities be in the company and what methodologies you will be using to fulfill your responsibilities will help you to get an idea of your job responsibility. However, if you are looking to have a good career as a data scientist, then you should be selecting your company solely based on the job title.
Having Multiple Skills is a Plus Point
This is an age where companies look for specialists. However, if those specialists have other skills that might be helpful for the company then that is a plus point for the candidate. There are companies looking for other skills as well apart from the knowledge you have in data science. Sometimes you may miss out on grabbing the job opportunity even after knowing statistics for data science just because you don’t have the required skill set the company is looking for. Also, having an extra skill might have an impact on your data science salary.
Be Prepared to Face the Tests
Anyone can put data scientist on their resume. But, that does not mean that they have the required skill set to handle the work of data scientists. That is why even if you have put data scientist on your resume, the companies will test how much of that is actually true. They will test whether the candidate knows his or her R or Python or you have a vague idea of these terms. That is why you need to learn data science in a robust manner so that whichever test companies put in front of you, you will have the confidence of passing them.
Final Thoughts
The career as a data scientist is very lucrative and everyone knows that. However, in this competitive world, many fail to establish themselves as data scientists simply because they don’t have the X-factor that will elevate their career. Following the aforementioned tips will surely help you to succeed as data scientists.
Do Data Scientist Use Statistics?
Do Data Scientists Use Statistics?
Data science has been the buzzword of the tech industry for the past few years. Everyone is aware of the endless opportunities and large pay scale awaiting the data scientists. But when the question becomes “what do they do?” or “how do they do it? ” Only a few people know it. This article discusses whether data scientists use statistics in their operations. Read on to find out.
Statistics in Data Science
Statistics can be a very powerful tool in data science. It is simply the use of mathematics to analyse the data technically. The following are the few important instances where data scientists use statistics.
- Design Experiments to Inform Product Decisions.
Data scientists use Frequentist Statistics and experimental design to determine whether or not the difference in the performance of two types of products are significant to take action. This application help data scientists to understand the experimental results especially when there are multiple metrics being measured. - Models to Predict the Signal
Using Regression, Classification, Time series analysis and casual analysis, data scientists can tell the reason behind a change of rate of sales. They use these techniques to predict the sales of upcoming months and point out the relevant trends to be careful of. - Turning Big Data Into Big Picture
Consider a large group of customers buying products. The data about each person’s shopping list is worthless if it stays like that. Data scientists can label each customer and put similar ones into a group and understand the buying pattern. It helps to identify how each group of people affect the business development. Statistic techniques such as clustering, latent variable analysis and dimensionality reduction are used to achieve this. - Understand User Engagement, Retention, Conversion and Leads
It is known that many customers would be lost from the signing-in stage to the actual regular use stage. Data science use techniques such as regression, latent variable analysis, casual effect analysis and survey design to find out the reason behind this loss. It also identifies the successful leads the company is using to engage more customers. - Predicting the Customer Needs
Statistical techniques such as latent variable analysis, predictive modelling, clustering and dimensionality reduction help data scientists to predict the items a customer might need next. A matrix of users and their interactions with the company product is all that is needed to obtain this. - Telling the story with Data
It is the end product of all operations of data scientists. He acts as the ambassador between the company and data. All the findings from data should be properly communicated with the rest of the company without losing any fidelity. Rather than summarizing the numbers, a data scientist has to explain why each number are significant. To do that properly, data visualisation techniques from statistics are used. Clearly, data scientists use statistics to solve various problems in their day to day life. If data science seems the right career choice for you, don’t wait for long. Imarticus Learning is now providing course on data science prodegree. This Genpact data science course will equip you with all the necessary skills for a successful data science career.
Which is better for data analysis: R or Python or else?
Data sciences have become a crucial part of everyday jobs. The availability of data, advanced computing software, and a focus on decisions that are analytics-driven has made data sciences a booming field. Jobs abound in this field and hence large interest also exists on which languages to learn.
R and Python are the most popular tools for data science work. Both are flexible, open source, and evolved just over a decade ago.R is used for statistical analysis while Python is a programming language that can be termed general-purpose. These are both in combination essential for data analysis where you are involved in working with large data sets, machine learning, and creating data visualization insights based on complexities involving data sciences.
The process of Data Science:
Very simply put the course on data science involve the four subdivisions discussed below. Let’s compare the two for the following.
Data Collection:
Python is supportive of different data formats. You can use CSVs, JSON and SQL tables directly in your code. You can even find Python solutions when stuck on Google. Rvest, magrittr, and beautiful soup packages in Python resolve issues in parsing, web scraping, requests etc.
Data can be imported from CSV, Excel, text files etc. Minitab or SPSS file formats can be converted into R data frames. R is not as efficient in getting web information but handles data from common sources just as well.
Data Exploration:
One can hold large volumes of data, sort, display data and filter large amounts of data using Pandas without the lag of Excel. Data frames can be redefined and defined throughout a project. You can clean data and scan it before you clean up empirical sense data.
R is an ace at numerical and statistical analysis of large datasets. You can apply statistical tests, build probability distributions, and use standard ML and data mining techniques. Signal processing, optimization, basics of analytics, statistical processing, random number generation, and ML tasks are easy to perform from its rather limited libraries.
Data Modeling:
Numerical modelling analysis with Numpy, scientific computing with SciPy and the scikit-learncode library with machine learning algorithms are some excellent working features in Python.
The R’s core functionality and specific modelling analysis are rather limited and compatible packages may have to be used.
Data Visualization:
The Anaconda enabled IPython Notebook, the Matplotlib library, Plot.ly, Python API, nbconvert function and many more are great tools available in Python.
ggplot2, statistical analysis abilities, saving of files in various formats like jpg, pdf etc, the base graphics module and graphical displays make R the best tool for statistical analysis complexities.
Before choosing, ask these questions
• Do you have programming experience?
• Do you want to do a Python course for business analytics or a business analytics course?
• Do you want to go into research and teaching or work in the industry?
• Do you want to learn ML or statistical learning in data sciences?
• Do you want to do software engineering?
• Do you want to visualize data in graphics?
Research well and you will find that depending on what functions you need both are excellent languages to learn for a career in data science.
How AT and Analytics Work at OpenText Enterprise World
OpenText customers must surely understand the value that Artificial Intelligence Systems and analytics offers to them, by now. AI is quickly trending around the world as the go-to system for many tech enterprises since it offers the capability of processing a large amount of data within a short time to get some amazing insights and suggestions from that.
OpenText is one of the leaders in Enterprise Information Management, and works to create an intelligent, connected enterprise for the benefits of its customers. Such a structure can be created only after in-depth analyses of large amounts of data – however, it leads to some amazing insights for the customers to benefits from.
OpenText employs the best minds in the industry, with most of the employees learning to use business analytics and undergoing data science courses in some capacity or the other. This is done so as to get a competitive advantage over the others, and thus provide better services to the customers. Some of the questions dealt with in the OpenText conference, regarding their functioning includes the ones discussed below.
AI Or BI?
Business Intelligence refers to the long tradition of using analytics to get a competitive edge in business processes, by qualitatively analysing the data available. Artificial Intelligence or AI is a more recent development – using computers and machine learning algorithms, large troves of data are analysed so as to get an idea about the best way to move forward. AI deals more with predictive analysis so that the customer receives a clear idea about the benefits and negatives associated with a particular action.
So which way would be suitable for the current business scenario? The answer is that both, in a balance – AI and BI are now converging, and organisations are increasingly becoming insight-driven from data-driven.
How Data Can Help Build a Better World
The constant between both BI and AI is that both require a large amount of data to work well. Companies, therefore, have the opportunity to make a huge difference in the world with their philanthropic ambitions, if the available data is used well. Today, large amounts of innovations are coming out every day which deal with the methods using which AI can be used to make the world a better place with every passing day.
If you find yourself interested in AI and wanting to change the world, check out the business analytics training courses available on Imarticus Learning!
How AI Drives Innovation in Next Generation Cloud Business Intelligence?
Today, we have access to a huge amount of technology and other systems through the internet – Artificial Intelligent systems are one of those. AI is becoming a larger part of our lives with each passing day, and the chances are that AI systems would already have affected us in some way or the other.
AI, in essence, is a predictive technology. The main function of every AI system is to essentially make a prediction based on the amount of data and information that it analyses. Since it can sift through any large amount of data, it is thus a type of technology that improves our lives in a huge manner. Similarly, the role of business intelligence and business analytics has changed too – it is now something that deals with increasing amounts of predictive analysis rather than historical analysis, and is available to users as an interactive, easy-to-use tool.
Thought Spot
Thought Spot is one of the pioneers in the segment of Business Intelligence – the California based company can be credited for creating a Google-like search engine which can analyse large amounts of data quickly and completely so as to provide the user with some great insights into the data. Thought Spot’s Ad-hoc version of data analytics provides various amazing services, like extremely transparent calculations into how each insight was derived, accompanying of natural language narratives with the rendered charts and a guided, curated search experience which generates suggestions for the users based on the role, the data model and the search history of the person. Thought Spot and its data analytics model is truly something to watch out for, in the future.
Anticipatory Models
Companies like Thought Spot and other data-driven Business Intelligence organisations are considered to be the forerunners of the next, and perhaps the largest wave in Business Intelligence called the anticipatory intelligence. They aim to leverage the usage of AI in a number of scenarios, like anticipatory devices, conversations and contexts. In this first one, the aim is to automate something that a large number of users are trying to do in a small time period so that it happens quicker and better. In the second and third, natural language processing systems are used so as to predict what the users are going to say, and thus promote rapid communication.
If all of this fascinates you, you should definitely look at the business analytics training courses and the data science courses that Imarticus Learning has to offer.
Build Your Own AI Applications in a Neural Network
Today Big Data, Deep Learning, and Data Analytics are widely applied to build neural networks in almost all data-intensive industries. Machine learning courses in India offers such learning as short-term courses, MOOCs, online classrooms, regular classrooms, and even one-on-one courses. Choices are aplenty with materials, tutorials and options for training being readily available thanks to high-speed data and visualization made possible by the internet.
The study on jobs in Data Sciences says that core skills in Python are preferred by recruiters and is requisite for jobs in data analytics. The challenge lies in formulating a plan to study Python and the need of a specialist to help understand the technical and practical aspects of this cutting edge technology.
Why do a Specialization Course for Beginners?
Not all are blessed with being able to learn, update knowledge and be practically adept with the Python platform. It requires a comprehensive knowledge of machine learning, understanding of data handling, visualization techniques, AI deep learning, statistical modelling and being able to use your expertise on real-time practical examples of data sets from various industries.
Machine learning courses and case studies on Python platform are conducted in flexible learn-at-your-own-pace sessions in modes like instructor-led classroom sessions at select locations, virtual online classes led by certified trainers or even video sessions with mentoring at pre-determined convenient times.
One can do separate modules or certificate Big data Hadoop training courses with Python to understand data science analytics and then opt for modules using AI for deep learning with Python or opt for a dual specialization by doing the beginners course and courses covering AI and Deep Learning with Python. The areas of Deep Learning and AI both require prior knowledge of Deep Learning, Machine Learning, and data analytics with Python.
An example of one such course is the AnalytixLabs starter classes in Gurugram and Bangalore as a speedy boot-camp followed by a package of two courses in AI Deep Learning with Python and the Data Science with Python. The prerequisites are knowledge of at least one OOPs language and familiarity with Python. Their 36 classes, 250-hour course offers dual specialisations, and 110 hours of live training using multiple libraries in Python.
Just ensure you choose the right course to allow your career prospects to advance and allows further learning in Python-associated specialised subjects.