The shift for a company from the private to the public sector brings numerous challenges. One of those includes creating accountability reports for various existing company segments, of which financial reporting is among the most popular.
Therefore, segment reporting is essential, especially for public companies. The ACCA exam has included segment reporting in their curriculum to promote its real-life implications. Let’s dive into this article to learn about segment reporting in detail!
What is Segment Reporting?
The procedure of generating reports for various operations segments of an organisation is termed Segment Reporting. This reporting also creates and discloses a company’s entire financial statements. Segment Reporting is mostly required by public sector companies rather than private sector companies.
Creditors and investors wholly rely on a Segment Report as it provides them with authentic finance results and conditions of various working segments within a company. This reporting system is generally used to compute a company’s assets, liabilities, expenditures and revenue. It also assists the managing team in evaluating the future profitability of the company as well as its pitfalls.
Why is Segment Reporting Essential for a Business?
Segment Reporting is essential for businesses and stakeholders as it helps to comprehend the company’s total gain, revenue, and operation. It assists the management team to take better decisions for the benefit of the company’s future.
Investors also receive advantages from segment reporting as they can get accurate details about the various activities of a business in which it is indulged and its economic status in which they are performing. This information allows an investor to understand the following elements:
The performance and economic position of a company.
This report assists them in making better decisions and making profitable investments.
Investors can easily predict the future net cash flow of the company with the help of Segment Reporting.
Segment Reporting allows investors to see a wider and more vivid scenario before investing in the company.
Basic Rules that Are Followed While Generating a Segment Report for Business
The basic rules to generate a Segment Report have been enumerated below:
To evaluate the final report, a company can calculate the average of two or more segments offering similar services or products. This also applies to segments with similar distribution procedures, working environments and customers.
Those segments are eligible for a segment report if it contributes 10% of the entire revenue, profit, and loss of the company.
Until and unless the selected segments for generating the segment report contribute 75% of the company’s entire revenue, the report cannot be computed. If the percentage is less than 75%, more segments must be added.
One of the most important rules while evaluating a segment report is that a company should try to incorporate not more than ten segments. If it crosses more than ten segments, then it must be curtailed.
What is the Essential information that is attached to a Business Segment Reporting?
There is a lot of information that is available within a company. However, all of this information is not required while determining a segment report. Here is a list of information that must be included in a segment report:
Total revenue of a company
The types of derivatives and services that are offered by various segments
The geographic location of the company
Material and interest expenditures
Profit and loss of the company
Total tax paid by the company
Depreciation
Amortisation
Material non-cash items
Real-life Illustration of Segment Reporting
Bank is a perfect example of a public business which comprises multiple segments. The three main segments of a bank are commercial lending, consumer lending, and credit card section. Therefore, while evaluating the annual financial statement, the officers have to compute the three segments of the bank separately.
The balance sheet thus will contain three various incomes and assets data. After segregating the three segments, the officers integrate all three segments into a larger balance sheet and income statement. The outcome of the final and combined income statement will make things easier and more comprehensive.
An individual can easily identify which segment within the bank has performed profitably. Many banks in various Nations have already adopted Segment Reporting.
Limitation of Segment Reporting
There are many positive aspects of conducting Segment Reporting. However, there are certain limitations as well. These have been discussed down:
Segment Reporting is time-consuming as a company must disclose confidential information.
Sometimes the data from the report can be misinterpreted by the stakeholders because of its vastness.
There are various techniques for evaluating a report. It depends upon the company and the method they are willing to choose. This can be tedious work.
Finally, the computation of the report is time-consuming and not economical.
Conclusion
In this course, well-trained teachers will teach and provide comprehensive study materials. An individual will be able to learn all the required knowledge and skills.
The ACCA course has also guaranteed placement to every individual who has enrolled. So without any further delay, enrol yourself In the ACCA course to bag lucrative opportunities.
Whether you are watching the news on the television, catching up on the news or OTT content on your phone, listening to ‘finfluencers,’ or just talking to your friends, you will have heard the mention of ‘finance’ at least once throughout the day. This one word captures the complex dynamic system of money, currency, investments, capital assets, and other financial instruments.
A finance degree is just what you need to grasp the workings of this system. By the time of degree completion, you will be able to make sense of how money moves and how it makes the world move.
The final year of college is an exciting, stressful and busy time for students. The excitement for the future is peppered with anxieties about final-year projects and exams. To help you make the most of your time left in college without compromising your grades, we offer you a curated list of the best-advanced projects for your finance course.
Let’s walk you through 10 handpicked advanced projects for final-year finance students.
10 Advanced Project Ideas for Final Year Finance Students
As a final-year finance student, choosing the right topic for your final project is crucial. Here are some advanced project ideas that will give you the practical experience you need.
Merger and Acquisitions: The Zomato-Blinkit Case
Mergers and acquisitions are at the heart of understanding how finance works. The recent acquisition of the quick commerce company, Blinkit by Zomato, the food delivery company, is an interesting study. The acquisition deal and the ensuing controversy is a case study in the intricacies of mergers and acquisitions and their impact on the wider market.
Business Model: The Rise, Fall, and Rise of Cafe Coffee Day
How businesses manage their cash flows, and liquidity can tell you a lot about them. The case of Cafe Coffee Day and its rise, fall and rise again is a story that generated a lot of attention. As a finance student, the historical trajectory of this business can give important insights into how companies can improve their financial health after severe liquidity issues. It can help you develop business models to achieve the positive fiscal health of organisations.
Securities and Investment: The Karvy Stock Broking Controversy
Institutional and retail investors invest their money into the stock market in the hopes of gaining returns that beat the returns of more secure investment options. However, the case of Karvy Stock Broking Limited misappropriating client funds shook up the market. The stock broking company illegally pledged the shares of its clients to lending agencies to raise loans, diverting securities to group companies, and more. The fall of the agency can be an interesting study for a deeper knowledge of the securities market.
Market Regulatory Bodies: The Securities and Exchange Board of India
The Securities and Exchange Board of India (SEBI), established in 1988, is the regulatory body for the securities and commodities market in India. They are the overseer, executor and judge of the market. As one of the most powerful regulatory bodies in the world, the SEBI presents an interesting case to understand how regulations are formulated, implemented and enforced in the securities and commodities market.
Retail Investment: The Growth of Retail Investment and the Pandemic
Retail investment constitutes an important section of the investment market. In India, the pandemic did something strange. The market witnessed all-time highs in retail investments that have continued beyond the pandemic. Through this unique project, you can explore the dynamics of retail investment and what is driving its growth. It will help you understand how markets can be kept afloat through the participation of retail shareholders in the equity market.
Insurance Sector: Health Insurance and the Indian Population
A recent study suggests that most Indians don’t have health insurance or at least adequate health insurance. The study of the health insurance industry and people’s attitudes towards investing in health insurance can shed further light on the subject. Health is one of the most important dimensions of measuring the quality of life, and so it is an important aspect to account for when studying finance.
Pandemic: The Growth of ‘Revenge Tourism’
Unexpected events that shake up the world, like Covid-19, make a big dent in the financial world. With social distancing policies becoming the norm, people were locked in their homes. However, when the restrictions were lifted, people rushed out of their homes and flocked to tourist destinations. It led to the beginning of ‘revenge tourism’ that not only revived the hard-hit tourism industry but made it flourish. A look at the phenomenon of revenge tourism can be an interesting study of how the pandemic’s impact can affect how people and money move.
Bankruptcy: The Demise of Kingfisher Airlines
Bankruptcy is a scary word in the financial world. It is the epitome of a seriously unhealthy financial health of a business. The bankruptcy of Kingfisher Airlines and the fall in the grace of the ‘King of Good Times,’ Vijay Mallya, is one of the most high-profile bankruptcy cases in India. The legal implications are still ongoing. The fortune of a billionaire, crushing debt, the humane story of unpaid employees, and more make the case a saga that requires in-depth analysis to understand businesses and their financial management or mismanagement.
Benefits: Direct Benefit Transfer in India
Governments have several programmes and policies that require the state to transfer benefits to its citizens. Direct Benefit Transfers (DBT) is the mechanism adopted by the Government of India to transfer subsidies directly to its citizens through their linked bank accounts. A comprehensive analysis of the system is integral to understanding how state subsidies in India work. It is an exceptionally interesting project for those who want to effect transformational change in the system.
Taxes: The New Tax Regime
As a citizen of a country, everyone is required to pay taxes. It is a public policy that has very personal implications and affects how consumers spend money. An understanding of India’s New Tax Regime and its evolving nature can show the inter-relationship between public policy and individual financial behaviour.
Conclusion:
Finance students have a very bright future ahead of them with an ever-expanding job market. The jump from a student to a professional is significant. Your final-year finance project can bridge this distance by allowing you to explore real-world scenarios and how to navigate their issues.
Courses like capital market courses and even financial markets course online make it a point to include projects that let you look closely at financial realities. IIM Lucknow finance courses are among the best in the world if you want to expand your horizons and upskill.
In today’s globalised and interconnected world, the concept of diversity and inclusion has become much more critical than ever for business enterprises. According to a recent survey, as much as 57% of recruiters feel that their talent acquisition strategies are designed specifically for attracting diverse candidates.
However, that being said, creating a diverse and inclusive workforce is not just about checking boxes but includes fostering an environment wherein everyone feels valued and respected. On that note, mentioned below are some of the best practices HR professionals can implement to build a diverse and inclusive workforce.
What is Workplace Diversity and Inclusion?
Workplace diversity and inclusion refers to the practice of creating a work environment that embraces and values individuals from various backgrounds, experiences, as well as perspectives. However, when you take a closer look at this concept, you will realise that diversity and inclusion are actually quite different from each other and do not mean the same thing.
Simply put, diversity refers to the presence of individuals with varied backgrounds, perspectives, and characteristics, within an organisation. It encompasses a wide range of factors, including, but not limited to, race, ethnicity, sex, age, nationality, and socio-economic status.
On the other hand, inclusion signifies creating a work environment where all individuals, irrespective of their differences, feel welcomed and valued. It primarily focuses on promoting a sense of belonging for every employee in an organisation and ensures that every voice is given due importance and consideration.
If an organisation is aiming to truly offer an inclusive work environment, they need to implement policies and practices that promote fair and unbiased hiring, opportunities for the professional development of all employees, and diversity recruitment.
Diversity and Inclusion Best Practices
Listed below are some of the best and essential practices that every organisation must implement in order to promote a diverse and inclusive workplace.
Establish A Sense Of Belonging
Fostering a sense of belonging is essential for a workspace to be inclusive and cohesive for all its employees. HR professionals should conduct in-depth diversity training sessions for all staff members to achieve relevant results. Unconscious bias and cultural competency should be the main topics of discussion throughout these sessions, which should also promote candid conversations to clear up any misunderstandings or concerns.
Equal and Fair Treatment of All Employees
Fairness is yet another crucial prerequisite for employees to feel valued and respected. More often than not, unfair salaries or undue advantages to employees of different backgrounds can create an unhealthy workplace culture. To prevent the same, HR professionals should develop and enforce comprehensive non-discrimination policies that protect employees from any form of discrimination based on age, race, gender, sex, or any other protected characteristic.
Conduct Regular Diversity Audits
Conducting audits on a regular basis helps keep track of progress, identify potential areas for improvement, and hold the organisation accountable for diversity and inclusion goals. In addition to this, it also helps to understand the effectiveness of diversity initiatives.
Promote Diversity In Hiring
In order to build a diverse workforce, HR professionals must also implement the necessary changes in their hiring process. This includes expanding the talent pool through targeted outreach, implementing bling resume screening processes to prevent the occurrence of unconscious bias, and partnering with diverse organisations. In addition to this, interviewers must also be trained in inclusive interviewing techniques that focus on skills and qualifications rather than cultural fit.
Conclusion
Adhering to these best practices can help HR professionals to create a workplace where every employee feels empowered to reach their full potential, thus fostering a more inclusive and high-performing organisation. If you wish to explore more about such practices or simply enhance your people management skills, you can check out multiple strategic HR management courses that are available online.
One such among them includes the People Leadership and Strategic HR Managementprogram brought to you by the prestigious IIM Lucknow. Such IIM Executive HR courses are specifically designed for business managers and emerging senior HR professionals who wish to advance their careers in this field. Additionally, with the IIM L leadership course, you also get to explore multiple benefits, such as access to masterclass sessions and professional certifications, among others.
Staying on top of technology in today’s fast-paced world demands more than just basic-level knowledge. The new era’s digital transformation requires the workforce’s proficiency in full stack web development. So, gear up your team with the best training to stay ahead of the game. Make sure they’re well-versed in both front-end and back-end technologies. It will enable them to navigate the intricacies of modern web development with confidence and innovation.
This is where comprehensive employee full stack training is useful. Professionals need to upgrade themselves with the help of training programmes that cover data analytics, finance, marketing and technology. Let’s discuss the significance, need and unmatched advantages of giving your employees integrated full stack skill development training.
Significance
Full-stack engineers are essential for web development success. They handle everything, from user design to data. This removes roadblocks and boosts team speed. Their skills connect design and tech effortlessly.
Need
Talking about a full stack web development training programme is important. While traditional experts might work in separate groups, full stack developers know the whole development game. This helps teams work better together, solve problems faster and finish projects quicker. By choosing a good full stack web development training programme, you help your team stay flexible and creative.
Problem
Understanding the rapid evolution of technology is essential. As your organisation grows, integrating online apps and digital solutions becomes indispensable. However, securing talent proficient in both front-end and back-end development poses a challenge. Here lies the void. The solution isn’t just to bridge this gap but to equip your workforce with a comprehensive full stack skill development programme.
The solution to the problem
Contemplate introducing a full stack web development training programme to your employees. Choosing a well-rounded course is pivotal. Beyond familiar front-end frameworks such as React and Angular, seek a curriculum that immerses employees in back-end technologies like Node.js and Python, as well as databases like MySQL and MongoDB. Optimal training programmes strike a balance between theory and hands-on experience.
An all-encompassing full stack training for employees transitions them from mere professionals to versatile programmers adept at both front-end and back-end tasks. Such training empowers them to transform ideas into polished applications, ensuring not only captivating user interfaces but also a robust and secure back-end infrastructure. Properly trained, your team can navigate diverse challenges, adapt to emerging technologies and effectively propel your business growth.
When selecting a full stack web development training programme for your team, prioritise institutions renowned for their upskilling prowess. Opt for a course that marries theoretical knowledge with practical tasks, enabling your employees to build an impressive portfolio as they hone their skills. Additionally, the programme’s flexibility is key, allowing your staff to progress at their own pace without compromising their day-to-day responsibilities.
Empower your team with top-tier full stack training
Investing in the best full stack web development training for your employees is no longer an option, it is a must in a world where digital transformation is the standard.
Providing your team with a comprehensive skill development programme will foster unparalleled creativity, boost productivity and drive business growth.
We understand the intricacies of employee training across various sectors. Our full stack web development programme is designed to empower your team with essential skills for thriving in the digital landscape. Explore more by visiting the Imarticus Learning website.
The world of effective leadership is illuminated by different styles that resonate in different contexts. These key leadership styles include adaptive approaches that strengthen teams and move organisations forward. As Martin Luther King Jr. exemplified, transformational leadership creates change through inspiration and vision. Situational leadership, as demonstrated by figures such as General Dwight D. Eisenhower, adapts strategies to the developmental levels of followers. Servant leadership, as embraced by Mother Teresa, emphasises humility and healing others.
Read the article to learn more about the types of leadership styles, their dynamic interplay and significance in today’s unpredictable work scape and the senior leadership programs available.
Transformational Leadership
Transformational leadership is a style that initiates change and innovation by inspiring and motivating followers with a compelling vision. A notable example of transformational leadership is Steve Jobs. The founder of Apple revolutionised the technology industry with his visionary ideas and charismatic communication. His ability to envision a future, where the personal computer is intuitive and easy to use, motivated his team to create unique products like the iPhone and iPad. With his passion and dedication, Jobs showed how transformational leaders can challenge the status quo and foster a culture of innovation that reshapes industries and societies.
Situational Leadership
Situational leadership is a multifaceted approach that adapts leadership behaviour to the individual team members’ level of readiness and development. An example of this style is Nelson Mandela, who showed adaptability during the apartheid era in South Africa. Mandela skillfully adapted his leadership tactics to the evolving political landscape and the needs of his followers. He moved from confrontation to negotiation and reconciliation as the circumstances required. That flexibility allowed him to lead his people on a transformative journey to democracy. Mandela’s eventual management demonstrates the ability to adapt strategies to achieve optimal results, making it an essential tool in complex and dynamic environments.
Authentic Leadership
Authentic leadership focuses on authentic, transparent, and self-aware leadership practices that build trust and nurture meaningful connections. An illustrative figure of authentic leadership is Sheryl Sandberg, COO of Facebook. Through her candour about the challenges women face in the workplace and her personal experiences, Sandberg has inspired a global dialogue on gender equality. Her ability to lead with vulnerability and authenticity made her a role model and helped transform workplace dynamics. Sandberg’s approach shows how authenticity in leadership fosters an environment of mutual respect and empowers people to reach their full potential while creating lasting positive change.
Adaptive Leadership
Adaptive management involves dynamic responses to uncertain and rapidly changing environments that foster innovation and flexibility. Elon Musk, CEO of companies like Tesla and SpaceX, embodies this style in his latest technology and space exploration ventures. Musk’s adaptive leadership is reflected in his willingness to change strategies, navigate challenges, and redefine industries. For example, in the face of adversity, he redesigned and successfully launched reusable rockets that revolutionised space travel. Musk’s ability to lead his organisations through uncharted territory shows how adaptive leadership can promote progress, embracing change, pushing boundaries, and creating new paradigms for success.
Blending Leadership Styles
Combining management styles requires the skilful integration of different approaches in different situations, leading to a comprehensive and effective management strategy. A good example comes from the presidency of Barack Obama, where he perfectly combined transformational and authentic leadership. He inspired change through his vision and charisma, promoting open dialogue and engaging with audiences personally. This combination helped him navigate complex administration and public opinion issues and created a legacy of dynamic leadership. The advantage of such a leadership style is the fusion that lies in its adaptability— it allows leaders to meet multiple challenges, fostering innovation, empathy, and resonance with followers, ultimately fostering a comprehensive leadership path.
Choosing the right style
Choosing the appropriate leadership style depends on several factors constituting the optimal approach in each context. Organisational culture, team dynamics, and overall goals are critical in this choice. A leader’s ability to match their style with these elements increases their effectiveness in leading their team to success. Equally critical is self-awareness — a keen understanding of one’s strengths, weaknesses, and tendencies. This introspection allows leaders to determine which style best suits their innate qualities, fostering authenticity and resonance.
The intersection of these elements empowers leaders to make informed decisions, creating a symbiotic relationship between style and environment that propels teams toward achievement while fostering a harmonious leadership journey.
Conclusion
The study of different leadership styles reveals their transformative effects. Imarticus Learning’s Global Senior Management Programme is a transformative course designed to elevate experienced professionals to a new leadership level. While engaged in this senior leadership programming, the immersive experiences, strategic insights, and cutting-edge tools, participants will improve their leadership, strategic thinking, and decision-making skills. This programme empowers leaders to navigate complex challenges, foster innovation, and advance organisational success worldwide.
Conflicts in workplaces are inevitable. People from different backgrounds come to work together. These individuals have different priorities and values, and most resist change.
Conflicts are always uncomfortable for most individuals in both professional and personal contexts. However, learning to handle conflicts – especially in a work setting – healthily and productively is highly essential.
Learning strategies for resolving conflicts is an essential part of leadership. With effective conflict management strategies, workplace conflicts can easily be handled.
Conflict resolution is a skill which is learnt best with experience and practice.
However, starting with some familiar and effective conflict resolution strategies will lay a solid foundation to work from for the upcoming years.
This blog will discuss the different conflict resolution strategies managers and those in leadership roles must learn. Enrolling in a general management programmecan also help you understand the techniques.
What is conflict, and why does it happen?
Conflict can be defined as a process which unfolds when two or more individuals’ interests are not in alignment with each other. A conflict can also happen because of social status, cultural beliefs, an individual’s biases etc.
In a work setting, conflicts of opinions, interests, beliefs and desires can escalate to serious arguments harming team bonds if not dealt with properly.
These issues mainly occur when individuals with conflicting points of view have to reach an agreement. Individuals on teams have different needs and goals and don’t always align.
Conflicts in the workplace can also occur because of poor communication. Unfulfilled expectations and crossed boundaries occur when teams donot prioritise open communication.
The best way to avoid conflicts is to create a work culture where people can communicate their interests, needs, feelings, thoughts, emotions and opinions honestly and transparently.
Why is conflict management essential for leaders?
Effective conflict management allows leaders to create a team of members working together to develop strategies, achieve goals and streamline processes.
When a team is built with individuals with varying personalities, it creates a potential for conflict. However, with proper knowledge and understanding of conflict management skills, managers can resolve conflicts quickly when they happen or avoid them altogether.
With effective conflict management, you can get a few more benefits, such as:
1. Improvement in processes
Resolving any conflict a team member might have with the goals or how to achieve them helps find areas for improvement. As a leader, allow members to offer opinions and thoughts on resolving issues using a positive conflict management method.
Using feedback to solve conflicts can help judge whether there is any potential for similar conflicts in the team.
Leaders can find ways to improve the current processes and make their assigned goals stronger. This will help prevent other issues and quickly achieve your goals.
2. Better teamwork
When there is a conflict between team members, it is best to work on achieving a solution favourable for all parties involved.
When a conflict between two or more members is resolved, push them to find ways to collaborate, improving productivity and morale. As the team works towards a common goal, implement some of these solutions throughout the rest of the team to strengthen it.
3. Stop any future conflicts
By adequately understanding conflict management and finding positive solutions, leaders can recognise patterns that may lead to a conflict. Managers can implement previous solutions to prevent such conflicts from reoccurring.
This guarantees that the project can progress on schedule, heightens the team’s morale and improves respect for the management.
Conflict Resolution Strategies
Effective conflict management comes with adequately understanding and implementing conflict management strategies. Learn about conflict resolution strategies from a well-designed general management programme. Listedhere are the top five conflict resolution techniques.
1. Don’t neglect conflict
Ignoring conflict is never the way to resolve it. On the contrary, often, this will worsen the situation.
With neglected conflict, things fester with time and tend to reappear in the future. Hence, for the betterment of the team, as a team leader, address conflicts as and when they occur. It is best to handle a potential conflict as soon as you recognise it.
2. Clarify the issue
When dealing with a conflict involving two team members, it is essential that leaders first get all the facts. Sit down with both parties involved and uncover the actual issue.
It is essential to gain the trust of involved parties, so they accept you as the impartial mediator and feel comfortable sharing sensitive information.
3. Make the involved parties talk
Once you have personally spoken to all the involved parties, make them sit together for a meeting to hash out the differences in a neutral setting.
In this meeting, the goal is to brainstorm, actively listen and be open to different perspectives. The parties should agree on a common ground of the issue, what role each person has played in the conflict and what possible solutions might be.
4. Come up with a solution
Once all the involved parties have had the chance to discuss any conflict, it’s time to discover satisfactory resolutions and how you can achieve them. It is expected that the parties will understand each other’s perspectives and that the conflict will be resolved.
However, if the situation needs further resolution, the leader must step in and negotiate a reasonable solution. This stage might take some time as both parties must find common ground by setting aside their preferences and differences.
5. Keep monitoring and follow up on the conflict
As a team leader, it is your job to check in with all the involved parties to make sure that the issue has been dealt with adequately and steps suggested to reach the solutions are being followed.
If everything is going smoothly, at times, stop and observe to see if things function smoothly in the long run.
Conclusion
To become a successful leader, it is essential to understand and implement conflict management strategies to run a successful team and maintain harmony in the workplace. Consider enrolling in a general management course online to bolster your career further as a manager.
Every brand vies for customers’ attention in this digitally-inclined world, making it arduous. This can be done by implementing multiple brand strategies or conducting a marketing mix aligned with the company’s aims. Retaining customers requires great effort and time to gain the consumer’s trust. Hence, a strong focus on customer retention becomes crucial for a business’s success. One can apply multiple strategies to improve customer retention, including more face-to-face interaction or working on the buyer-brand relationship.
This article will answer the prevalent question of ‘what are the strategies for customer retention companies can adopt’ and suggest a few CMO Training Programs to level up your career.
What does customer retention mean?
Customer retention refers to the metric organisations or businesses use to measure their customer’s loyalty over a time period and their overall success. Different strategies and tactics are implemented to boost the overall retention of consumers for the company. Using a proper strategy for customer retention ensures that they remain loyal to the brand over a long period of time.
Customer Retention Rate formula:
The customer retention rate (CRR) is a specific component representing the retained customer percentage for the brand over a specified time-bound period. Given below is the formula to determine the CRR-
CRR = [{E-N} / S],
Here,
E represents the number of customers the brand holds at the closing of the period,
S represents the number of customers the brand holds at the initial measuring stage, and
N the number of new customers that the brand acquired.
Important Strategies to Improve Customer Retention
Customer retention and loyalty marketing are crucial to sustainable and flourishing businesses. While gaining new customers is significant, zeroing in on retaining existing customers can yield better yields and cultivate a loyal customer base that promotes your brand image. Here are a few successful methodologies to accomplish this:
Customised Experiences
Tailoring your communications to customer requirements and behaviour can fundamentally uplift their association with your image. Use data analysis to grasp their buying history, inclinations, and socioeconomics. Leverage this data to make customised item suggestions, selective offers, and designated marketing efforts that reverberate with every customer.
Unmatched Customer Service
Offering unique customer service solutions is the foundation of customer retention. Including ideal and sympathetic responses to customer queries and problems can contribute to a pleasant overall experience with a long-term impact. Satisfied customers will remain loyal and recommend your products or services to others.
Loyalty Programmes
Executing a meticulously planned loyalty programme can entice customers to make them want more. Offer rewards like discounts, limited period offers, free products, or selective admittance to loyal customers. The pride and acknowledgement that comes from amassing rewards boosts rehash buys and improves customer commitment.
Multi-channel Engagement
Draw in your customers using online entertainment, email, in-person, and telephone channels. Consistency in providing information and the capacity to cooperate through their favoured channels influences consumers’ general insight. Be responsive and congenial, cultivating your areas of strength for association and dependability.
Help Customers Getting Associated With the Brand Positively
Creating a brand association can be an uphill task, especially when a company initially creates a brand name. This is followed by creating brand awareness leading to brand association with customers. Develop a positive outlook to entice customers into partnering with you.
Surveys and Feedback
Routinely look for customer feedback through surveys, feedback and audit structures. This shows that your brand values feedback from the market. Follow up on this feedback to improve your products, services, and customer experience.
Content and Guidance
Offer interesting and instructional content that resonates with your target customers’ needs to connect and engage them with your products or services. This could incorporate how-to guides, tips, industry experiences, and much more.
Selective Offers and Exclusive Discounts
Reward your loyal customers with discounts and offers. This makes them feel appreciated and esteemed, empowering them to keep selecting your brand over other potential competitors.
Community Building
Make a community around your brand where customers can interact with one another. This can be through internet-based gatherings, virtual entertainment gatherings, or in any event, facilitating customer-selective occasions. Building a customer-centric community can help consumers stay connected with the brand and instil a sense of loyalty.
The Bottom Line
A few approaches and strategies might work better than others depending on the type of organisation you own, for example, a physical area versus a web-based store, its size and target audience. Whether you shape a brand profile or opt for promotions, fostering the right customer retention strategies for your business is significant.
If you are inclined toward making a career in management, check out the CMO Training Program, such as Imarticus’s Executive Certificate Programme For Strategic Chief Marketing Officers, to upskill yourself against the competition.
Learn the ropes of customer acquisition, retention and development tactics from industry experts and enhance your professional profile to fit the role of a CMO.
Cloud computing, like a dependable friend, has been showing up and quietly revolutionising banking in ways that are changing the entire financial landscape. Whether you’re an industry veteran or a budding professional looking to make your mark, fintech and financial technology courses are here to help you understand and engage with this transformation.
Imagine having a reliable tool that changes the way you operate, creating a world of possibilities. That’s what cloud computing has become for the banking industry. According to a survey by Accenture, about 90% of banking executives globally are exploring the shift to cloud-based operations.
This change doesn’t just signify a new era but demonstrates a leap into a future where efficiency and innovation are key.
How Cloud Computing Helps Banking
From cost-saving prowess and powerful data protection abilities to an uncanny knack for elevating customer experiences, cloud computing is making a massive difference in banking.
Let’s take a closer look at some of these superpowers and see how they’re making banking better.
Cost Efficiency
Let’s start with what matters to us all – money. The pay-as-you-go model of cloud computing has been a game-changer for banks, giving them the flexibility to scale resources as needed, which in turn, cuts down massive investments in IT infrastructure.
Enhanced Data Security
In the world of banking, data security is non-negotiable. It’s like the secret recipe for your favourite dish – it needs to be guarded zealously. Thanks to cloud computing, banks now have tools like encryption and identity management, which, combined with disaster recovery solutions, keep your data as safe as a house.
Improved Customer Experience
Remember when banking transactions felt like just another chore on your to-do list? Those days are gradually fading into the past as cloud computing helps banks offer real-time, personalised services, transforming mundane transactions into enjoyable experiences.
The Cloud-Driven Era in Banking
We’re already stepping into the future, where banking is driven by cloud computing. This technology isn’t just an upcoming trend but a present reality dictating the course of the banking sector. From small community banks to multinational banking giants, everyone is leaning towards the benefits of cloud computing.
A Gartner report suggests that the public cloud services market will grow by 21.4% in 2023 alone, amounting to a total value of $404.9 billion. Such a surge indicates the growing trust and reliance on cloud technology across industries, including banking.
In this context, several significant aspects come to the forefront:
Greater Adaptability: In an ever-evolving landscape, cloud computing provides the flexibility to adapt to changes swiftly. It allows banks to scale operations based on demand, ensuring cost efficiency and optimum resource utilisation.
Digital Customer Experience:McKinsey predicts that digital banking will fully catch up in the near future, making branch visits a thing of the past. In this scenario, cloud computing forms the backbone of digital transformation, facilitating seamless, real-time services for customers.
Data-Driven Decisions: The banking sector generates vast amounts of data. Cloud computing provides the capacity and the analytical tools to process this data, enabling banks to make informed, strategic decisions.
Robust Security: With rising cyber threats, banks need a robust security framework to protect sensitive customer data. Cloud computing offers advanced security measures, including data encryption, regular backups, and disaster recovery plans, fostering a secure banking environment.
Financial technology courses are becoming increasingly relevant in this context. They provide an in-depth understanding of cloud computing, offering the tools to harness its potential effectively. As the future of banking becomes more intertwined with cloud technology, individuals equipped with such knowledge will be at the forefront of this transformation.
Investing in Yourself: The Value of Financial Technology Courses
In the era of cloud computing, knowledge is truly power. Financial technology courses are here to help you wield that power by not just understanding cloud computing but other disruptive technologies like AI and blockchain as well.
With a broad catalogue of certified Fintech courses from Imarticus, you can explore the depth of cloud computing and its growing relevance in the field of finance- eventually becoming a part of the dynamic Fintech world!
Wrapping Up
As we wrap up our talk, it’s clear that the world of banking isn’t the same as it used to be. Cloud computing has changed the entire banking domain – whether it concerns saving money, keeping important data safe, or giving great customer service. As a result of this, in order to make the most of these changes, one needs to understand and use the technology that makes it possible.
This is where financial technology courses can be very helpful. They not only help us understand how cloud computing works but also give us the skills and information we need to use it well.
The cloud-based future of banks looks bright and hopeful. And for those of us who are willing to change and learn, there are exciting chances to shape this change and lead it. So, here’s to the future of banks, where technology and new ideas work together to drive growth and progress. Are you ready to join in?
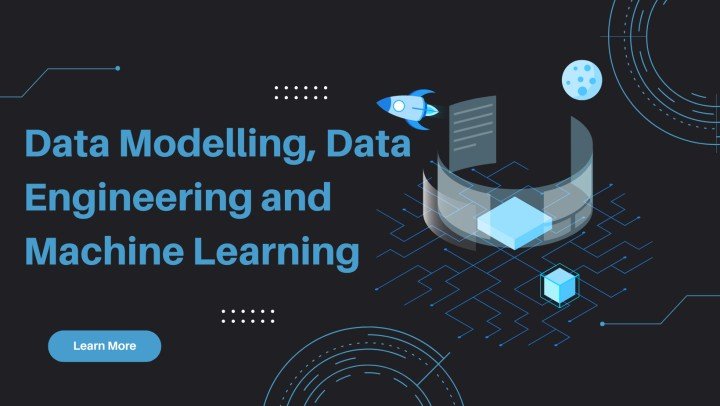
The worldly functions are now majorly changing with data usage. It has a wide spectrum of usage starting from the company’s revenue strategy to disease cures and many more. It is also a great flagbearer to get targeted ads on your social media page. In short, data is now dominating the world and its functions.
But the question arises, what is data? Data primarily refers to the information that is readable by the machine, unlike humans. Hence, it makes the process easier which enhances the overall workforce dynamic.
Data works in various ways, however, it is of no use without data modelling, data engineering and of course, Machine Learning. This helps in assigning relational usage to data. These help in uncomplicating data and segregating them into useful information which would come in handy when it comes to decision making.
The Role of Data Modeling and Data Engineering in Data Science
Data modelling and data engineering are one of the essential skills of data analysis. Even though these two terms might sound synonymous, they are not the same.
Data modelling deals with designing and defining processes, structures, constraints and relationships of data in a system. Data engineering, on the other hand, deals with maintaining the platforms, pipelines and tools of data analysis.
Both of them play a very significant role in the niche of data science. Let’s see what they are:
Data Modelling
Understanding: Data modelling helps scientists to decipher the source, constraints and relationships of raw data.
Integrity: Data modelling is crucial when it comes to identifying the relationship and structure which ensures the consistency, accuracy and validity of the data.
Optimisation: Data modelling helps to design data models which would significantly improve the efficiency of retrieving data and analysing operations.
Collaboration: Data modelling acts as a common language amongst data scientists and data engineers which opens the avenue for effective collaboration and communication.
Data Engineering
Data Acquisition: Data engineering helps engineers to gather and integrate data from various sources to pipeline and retrieve data.
Data Warehousing and Storage: Data engineering helps to set up and maintain different kinds of databases and store large volumes of data efficiently.
Data Processing: Data engineering helps to clean, transform and preprocess raw data to make an accurate analysis.
Data Pipeline: Data engineering maintains and builds data pipelines to automate data flow from storage to source and process it with robust analytics tools.
Performance: Data engineering primarily focuses on designing efficient systems that handle large-scale data processing and analysis while fulfilling the needs of data science projects.
Governance and Security: The principles of data engineering involve varied forms of data governance practices that ensure maximum data compliance, security and privacy.
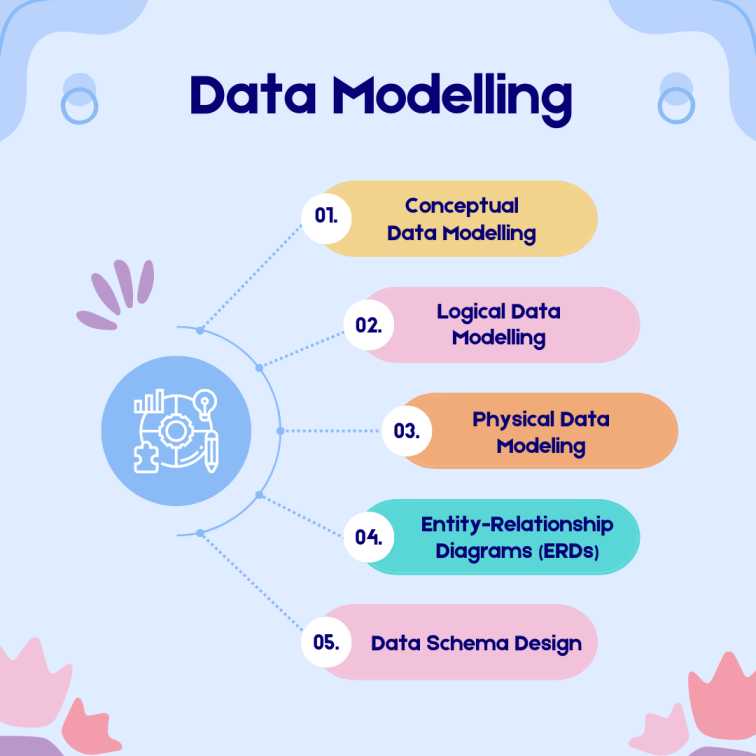
Understanding Data Modelling
Data modelling comes with different categories and characteristics. Let’s learn in detail about the varied aspects of data modelling to know more about the different aspects of the Data Scientist course with placement.
Conceptual Data Modelling
The process of developing an abstract, high-level representation of data items, their attributes, and their connections is known as conceptual data modelling. Without delving into technical implementation specifics, it is the first stage of data modelling and concentrates on understanding the data requirements from a business perspective.
Conceptual data models serve as a communication tool between stakeholders, subject matter experts, and data professionals and offer a clear and comprehensive understanding of the data. In the data modelling process, conceptual data modelling is a crucial step that lays the groundwork for data models that successfully serve the goals of the organisation and align with business demands.
Logical Data Modelling
After conceptual data modelling, logical data modelling is the next level in the data modelling process. It entails building a more intricate and organised representation of the data while concentrating on the logical connections between the data parts and ignoring the physical implementation details. Business requirements can be converted into a technical design that can be implemented in databases and other data storage systems with the aid of logical data models, which act as a link between the conceptual data model and the physical data model.
Overall, logical data modelling is essential to the data modelling process because it serves as a transitional stage between the high-level conceptual model and the actual physical data model implementation. The data is presented in a structured and thorough manner, allowing for efficient database creation and development that is in line with business requirements and data linkages.
Physical Data Modeling
Following conceptual and logical data modelling, physical data modelling is the last step in the data modelling process. It converts the logical data model into a particular database management system (DBMS) or data storage technology. At this point, the emphasis is on the technical details of how the data will be physically stored, arranged, and accessed in the selected database platform rather than on the abstract representation of data structures.
Overall, physical data modelling acts as a blueprint for logical data model implementation in a particular database platform. In consideration of the technical features and limitations of the selected database management system or data storage technology, it makes sure that the data is stored, accessed, and managed effectively.
Entity-Relationship Diagrams (ERDs)
The relationships between entities (items, concepts, or things) in a database are shown visually in an entity-relationship diagram (ERD), which is used in data modelling. It is an effective tool for comprehending and explaining a database’s structure and the relationships between various data pieces. ERDs are widely utilised in many different industries, such as data research, database design, and software development.
These entities, characteristics, and relationships would be graphically represented by the ERD, giving a clear overview of the database structure for the library. Since they ensure a precise and correct representation of the database design, ERDs are a crucial tool for data modellers, database administrators, and developers who need to properly deploy and maintain databases.
Data Schema Design
A crucial component of database architecture and data modelling is data schema design. It entails structuring and arranging the data to best reflect the connections between distinct entities and qualities while maintaining data integrity, effectiveness, and retrieval simplicity. Databases need to be reliable as well as scalable to meet the specific requirements needed in the application.
Collaboration and communication among data modellers, database administrators, developers, and stakeholders is the crux data schema design process. The data structure should be in line with the needs of the company and flexible enough to adapt as the application or system changes and grows. Building a strong, effective database system that effectively serves the organization’s data management requirements starts with a well-designed data schema.
Data Engineering in Data Science and Analytics
Data engineering has a crucial role to play when it comes to data science and analytics. Let’s learn about it in detail and find out other aspects of data analytics certification courses.
Data Integration and ETL (Extract, Transform, Load) Processes
Data management and data engineering are fields that need the use of data integration and ETL (Extract, Transform, Load) procedures. To build a cohesive and useful dataset for analysis, reporting, or other applications, they play a critical role in combining, cleaning, and preparing data from multiple sources.
Data Integration
The process of merging and harmonising data from various heterogeneous sources into a single, coherent, and unified perspective is known as data integration. Data in organisations are frequently dispersed among numerous databases, programmes, cloud services, and outside sources. By combining these various data sources, data integration strives to create a thorough and consistent picture of the organization’s information.
ETL (Extract, Transform, Load) Processes
ETL is a particular method of data integration that is frequently used in applications for data warehousing and business intelligence. There are three main steps to it:
Extract: Databases, files, APIs, and other data storage can all be used as source systems from which data is extracted.
Transform: Data is cleaned, filtered, validated, and standardised during data transformation to ensure consistency and quality after being extracted. Calculations, data combining, and the application of business rules are all examples of transformations.
Load: The transformed data is loaded into the desired location, which could be a data mart, a data warehouse, or another data storage repository.
Data Warehousing and Data Lakes
Large volumes of organised and unstructured data can be stored and managed using either data warehousing or data lakes. They fulfil various needs for data management and serve varied objectives. Let’s examine each idea in greater detail:
Data Warehousing
A data warehouse is a centralised, integrated database created primarily for reporting and business intelligence (BI) needs. It is a structured database designed with decision-making and analytical processing in mind. Data warehouses combine data from several operational systems and organise it into a standardised, query-friendly structure.
Data Lakes
A data lake is a type of storage facility that can house large quantities of both organised and unstructured data in its original, unaltered state. Data lakes are more adaptable and well-suited for processing a variety of constantly changing data types than data warehouses since they do not enforce a rigid schema upfront.
Data Pipelines and Workflow Automation
Workflow automation and data pipelines are essential elements of data engineering and data management. They are necessary for effectively and consistently transferring, processing, and transforming data between different systems and applications, automating tedious processes, and coordinating intricate data workflows. Let’s investigate each idea in more depth:
Data Pipelines
Data pipelines are connected data processing operations that are focused on extracting, transforming and loading data from numerous sources to a database. Data pipelines move data quickly from one stage to the next while maintaining accuracy in the data structure at all times.
Workflow Automation
The use of technology to automate and streamline routine actions, procedures, or workflows in data administration, data analysis, and other domains is referred to as workflow automation. Automation increases efficiency, assures consistency, and decreases the need for manual intervention in data-related tasks.
Data Governance and Data Management
The efficient management and use of data within an organisation require both data governance and data management. They are complementary fields that cooperate to guarantee data management, security, and legal compliance while advancing company goals and decision-making. Let’s delve deeper into each idea:
Data Governance
Data governance refers to the entire management framework and procedures that guarantee that data is managed, regulated, and applied across the organisation in a uniform, secure, and legal manner. Regulating data-related activities entails developing rules, standards, and processes for data management as well as allocating roles and responsibilities to diverse stakeholders.
Data Management
Data management includes putting data governance methods and principles into practice. It entails a collection of procedures, devices, and technological advancements designed to preserve, organise, and store data assets effectively to serve corporate requirements.
Data Cleansing and Data Preprocessing Techniques
Data preparation for data analysis, machine learning, and other data-driven tasks requires important procedures including data cleansing and preprocessing. They include methods for finding and fixing mistakes, discrepancies, and missing values in the data to assure its accuracy and acceptability for further investigation. Let’s examine these ideas and some typical methods in greater detail:
Data Cleansing
Locating mistakes and inconsistencies in the data is known as data cleansing or data scrubbing. It raises the overall data standards which in turn, analyses it with greater accuracy, consistency and dependability.
Data Preprocessing
The preparation of data for analysis or machine learning tasks entails a wider range of methodologies. In addition to data cleansing, it also comprises various activities to prepare the data for certain use cases.
Introduction to Machine Learning
A subset of artificial intelligence known as “machine learning” enables computers to learn from data and enhance their performance on particular tasks without having to be explicitly programmed. It entails developing models and algorithms that can spot trends, anticipate the future, and take judgement calls based on the supplied data. Let’s delve in detail into the various aspects of Machine Learning which would help you understand data analysis better.
Supervised Learning
In supervised learning, the algorithm is trained on labelled data, which means that both the input data and the desired output (target) are provided. Based on this discovered association, the algorithm learns to map input properties to the desired output and can then predict the behaviour of fresh, unobserved data. Examples of common tasks that involve prediction are classification tasks (for discrete categories) and regression tasks (for continuous values).
Unsupervised Learning
In unsupervised learning, the algorithm is trained on unlabeled data, which means that the input data does not have corresponding output labels or targets. Finding patterns, structures, or correlations in the data without explicit direction is the aim of unsupervised learning. The approach is helpful for applications like clustering, dimensionality reduction, and anomaly detection since it tries to group similar data points or find underlying patterns and representations in the data.
Semi-Supervised Learning
A type of machine learning called semi-supervised learning combines aspects of supervised learning and unsupervised learning. A dataset with both labelled (labelled data with input and corresponding output) and unlabeled (input data without corresponding output) data is used to train the algorithm in semi-supervised learning.
Reinforcement Learning
A type of machine learning called reinforcement learning teaches an agent to decide by interacting with its surroundings. In response to the actions it takes in the environment, the agent is given feedback in the form of incentives or punishments. Learning the best course of action or strategy that maximises the cumulative reward over time is the aim of reinforcement learning.
Machine Learning in Data Science and Analytics
Predictive Analytics and Forecasting
For predicting future occurrences, predictive analysis and forecasting play a crucial role in data analysis and decision-making. Businesses and organisations can use forecasting and predictive analytics to make data-driven choices, plan for the future, and streamline operations. They can get insightful knowledge and predict trends by utilising historical data and cutting-edge analytics approaches, which will boost productivity and competitiveness.
Recommender Systems
A sort of information filtering system known as a recommender system makes personalised suggestions to users for things they might find interesting, such as goods, movies, music, books, or articles. To improve consumer satisfaction, user experience, and engagement on e-commerce websites and other online platforms, these techniques are frequently employed.
Anomaly Detection
Anomaly detection is a method used in data analysis to find outliers or odd patterns in a dataset that deviate from expected behaviour. It is useful for identifying fraud, errors, or anomalies in a variety of fields, including cybersecurity, manufacturing, and finance since it entails identifying data points that dramatically diverge from the majority of the data.
Natural Language Processing (NLP) Applications
Data science relies on Natural Language Processing (NLP), enabling robots to comprehend and process human language. To glean insightful information and enhance decision-making, NLP is applied to a variety of data sources. Data scientists may use the large volumes of textual information available in the digital age for improved decision-making and comprehension of human behaviour thanks to NLP, which is essential in revealing the rich insights hidden inside unstructured text data.
Scikit-learn for general machine learning applications, TensorFlow and PyTorch for deep learning, XGBoost and LightGBM for gradient boosting, and NLTK and spaCy for natural language processing are just a few of the machine learning libraries available in Python. These libraries offer strong frameworks and tools for rapidly creating, testing, and deploying machine learning models.
R Libraries for Data Modeling and Machine Learning
R, a popular programming language for data science, provides a variety of libraries for data modelling and machine learning. Some key libraries include caret for general machine learning, randomForest and xgboost for ensemble methods, Glmnet for regularised linear models, and Nnet for neural networks. These libraries offer a wide range of functionalities to support data analysis, model training, and predictive modelling tasks in R.
Big Data Technologies (e.g., Hadoop, Spark) for Large-Scale Machine Learning
Hadoop and Spark are the main big data technologies that handle large-scale data processing. These features create the perfect platform for conducting large-scale machine learning tasks of batch processing and distributed model training to allow scalable and effective handling of enormous data sets. It also enables parallel processing, fault tolerance and distributing computing.
AutoML (Automated Machine Learning) Tools
AutoML enables the automation of various steps of machine learning workflow like feature engineering and data processing. These tools simplify the procedure of machine learning and make it easily accessible to users with limited expertise. It also accelerates the model development to achieve competitive performance.
Case Studies and Real-World Applications
Successful Data Modeling and Machine Learning Projects
Netflix: Netflix employs a sophisticated data modelling technique that helps to power the recommendation systems. It shows personalised content to users by analysing their behaviours regarding viewing history, preferences and other aspects. This not only improves user engagement but also customer retention.
PayPal: PayPal uses successful data modelling techniques to detect fraudulent transactions. They analyse the transaction patterns through user behaviour and historical data to identify suspicious activities. This protects both the customer and the company.
Impact of Data Engineering and Machine Learning on Business Decisions
Amazon: By leveraging data engineering alongside machine learning, businesses can now easily access customer data and understand their retail behaviour and needs. It is handy when it comes to enabling personalised recommendations that lead to higher customer satisfaction and loyalty.
Uber: Uber employs NLP techniques to monitor and analyse customer feedback. They even take great note of the reviews provided by them which helps them to understand brand perception and customer concern address.
Conclusion
Data modelling, data engineering and machine learning go hand in hand when it comes to handling data. Without proper data science training, data interpretation becomes cumbersome and can also prove futile.
If you are looking for a data science course in India check out Imarticus Learning’s Postgraduate Programme in Data Science and Analytics. This programme is crucial if you are looking for a data science online course which would help you get lucrative interview opportunities once you finish the course. You will be guaranteed a 52% salary hike and learn about data science and analytics with 25+ projects and 10+ tools.
To know more about courses such as the business analytics course or any other data science course, check out the website right away! You can learn in detail about how to have a career in Data Science along with various Data Analytics courses.
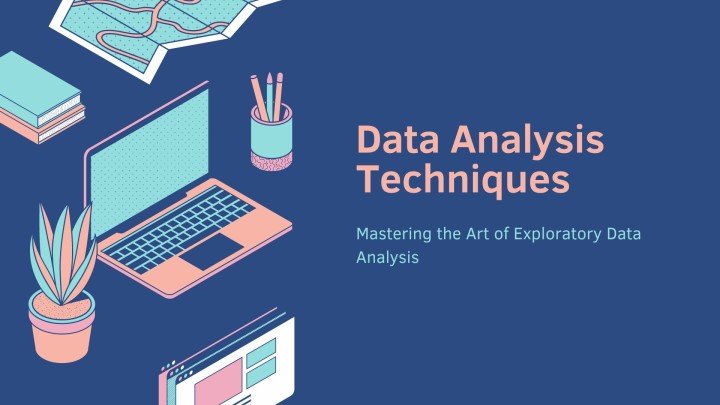
Exploratory data analysis (EDA) is an essential component of today’s data-driven decision-making. Data analysis involves handling and analysing data to find important trends and insights that might boost corporate success.
With the growing importance of data in today’s world, mastering these techniques through a data analytics course or a data scientist course can lead to exciting career opportunities and the ability to make data-driven decisions that positively impact businesses.
Whether you’re a seasoned data expert or just starting your journey, learning EDA can empower you to extract meaningful information from data and drive better outcomes for organisations.
Role of Data Analysis in Data Science and Business Decislpion Making
Effective business decision-making requires careful consideration of various factors, and data-driven decision-making is a powerful approach that relies on past data insights. Using data from business operations enables accurate and informed choices, improving company performance.
Data lies at the core of business operations, providing valuable insights to drive growth and address financial, sales, marketing, and customer service challenges. To harness its full potential, understanding critical data metrics is essential for measuring and using data effectively in shaping future strategies.
Businesses can achieve success more quickly and reach new heights by implementing data-driven decision-making.
Understanding Exploratory Data Analysis (EDA)
EDA is a vital tool for data scientists. It involves analysing and visualising datasets to identify patterns, anomalies, and relationships among variables. EDA helps understand data characteristics, detect errors, and validate assumptions.
EDA is a fundamental skill for those pursuing a career in data science. Through comprehensive data science training, individuals learn to use EDA effectively, ensuring accurate analyses and supporting decision-making.
EDA’s insights are invaluable for addressing business objectives and guiding stakeholders to ask relevant questions. It provides answers about standard deviations, categorical variables, and confidence intervals.
After completing EDA, data scientists can apply their findings to advanced analyses, including machine learning. EDA lays the foundation for data science training and impactful data-driven solutions.
Exploring Data Distribution and Summary Statistics
In data analytics courses, you’ll learn about data distribution analysis, which involves examining the distribution of individual variables in a dataset. Techniques like histograms, kernel density estimation (KDE), and probability density plots help visualise data shape and value frequencies.
Additionally, summary statistics such as mean, median, standard deviation, quartiles, and percentiles offer a quick snapshot of central tendencies and data spread.
Data Visualisation Techniques
Data visualisation techniques involve diverse graphical methods for presenting and analysing data. Common types include scatter plots, bar charts, line charts, box plots, heat maps, and pair plots.
These visualisations aid researchers and analysts in gaining insights and patterns, improving decision-making and understanding complex datasets.
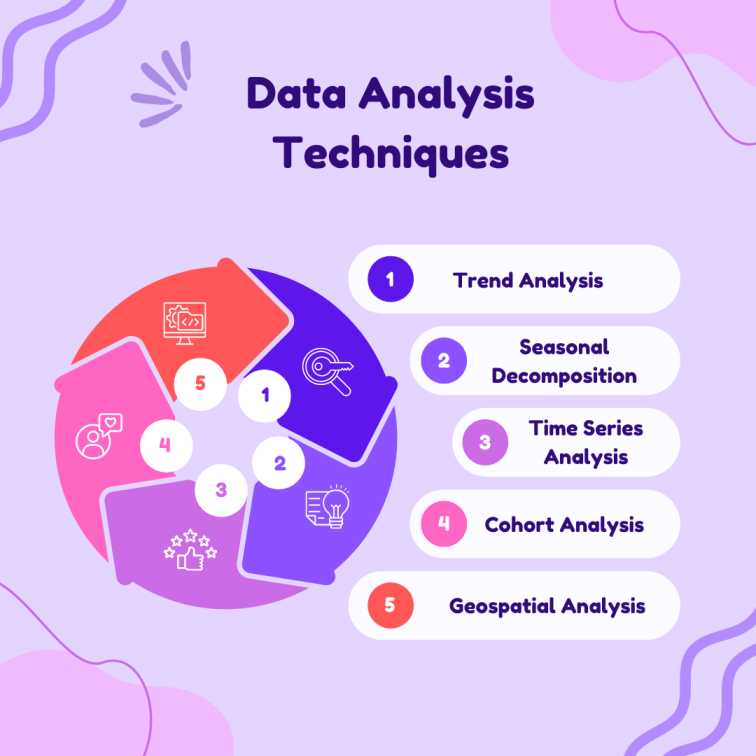
Identifying Data Patterns and Relationships
Correlation analysis: Correlation analysis helps identify the degree of association between two continuous variables. It is often represented using correlation matrices or heatmaps.
Cluster analysis: Cluster analysis groups similar data points into clusters based on their features. It helps identify inherent patterns or structures in the data.
Time series analysis: Time series analysis is employed when dealing with data collected over time. It helps detect trends, seasonality, and other temporal patterns.
Handling Missing Data and Outliers
Handling missing data and outliers is a crucial step in data analysis. Techniques like imputation, deletion, or advanced expectation-maximisation (EM) can address missing values.
At the same time, outliers must be identified and treated separately to ensure unbiased analysis and accurate conclusions.
Data Preprocessing for EDA
Data Preprocessing is crucial before performing EDA or building machine learning models. It involves preparing the data in a suitable format to ensure accurate and reliable analysis.
Data Cleaning and Data Transformation
In data cleaning and transformation, missing data, duplicate records, and inconsistencies are addressed by removing or imputing missing values, eliminating duplicates, and correcting errors.
Data transformation involves normalising numerical variables, encoding categorical variables, and applying mathematical changes to deal with skewed data distributions.
Data Imputation Techniques
Data imputation techniques involve filling in missing values using mean, median, or mode imputation, regression imputation, K-nearest neighbours (KNN) imputation, and multiple imputations, which helps to address the issue of missing data in the dataset.
Handling Categorical Data
In data science training, categorical data, representing non-numeric variables with discrete values like gender, colour, or country, undergoes conversion to numerical format for EDA or machine learning.
Techniques include label encoding (assigning unique numerical labels to categories) and one-hot encoding (creating binary columns indicating the presence or absence of categories).
Feature Scaling and Normalisation
In data preprocessing, feature scaling involves:
Scaling numerical features to a similar range.
Preventing any one feature from dominating the analysis or model training.
Using techniques like Min-Max scaling and Z-score normalisation.
On the other hand, feature normalisation involves normalising data to have a mean of 0 and a standard deviation of 1, which is particularly useful for algorithms relying on distance calculations like k-means clustering or gradient-based optimisation algorithms.
Data Visualisation for EDA
Univariate and Multivariate Visualisation
Univariate analysis involves examining individual variables in isolation, dealing with one variable at a time. It aims to describe the data and identify patterns but does not explore causal relationships.
In contrast, multivariate analysis analyses datasets with three or more variables, considering interactions and associations between variables to understand collective contributions to data patterns and trends, offering a more comprehensive understanding of the data.
Histograms and Box Plots
Histograms visually summarise the distribution of a univariate dataset by representing central tendency, dispersion, skewness, outliers, and multiple modes. They offer valuable insights into the data’s underlying distribution and can be validated using probability plots or goodness-of-fit tests.
Box plots are potent tools in EDA for presenting location and variation information and detecting differences in location and spread between data groups. They efficiently summarise large datasets, making complex data more accessible for interpretation and comparison.
Scatter Plots and Correlation Heatmaps
Scatter plots show relationships between two variables, while correlation heatmaps display the correlation matrix of multiple variables in a dataset, offering insights into their associations. Both are crucial for EDA.
Pair Plots and Parallel Coordinates
Pair plots provide a comprehensive view of variable distributions and interactions between two variables, aiding trend detection for further investigation.
Parallel coordinate plots are ideal for analysing datasets with multiple numerical variables. They compare samples or observations across these variables by representing each feature on individual equally spaced and parallel axes.
This method efficiently highlights relationships and patterns within multivariate numerical datasets.
Interactive Visualisations (e.g., Plotly, Bokeh)
Plotly, leveraging JavaScript in the background excels in creating interactive plots with zooming, hover-based data display, and more. Additional advantages include:
Its hover tool capabilities for detecting outliers in large datasets.
Visually appealing plots for broad audience appeal.
Endless customisation options for meaningful visualisations.
On the other hand, Bokeh, a Python library, focuses on human-readable and fast visual presentations within web browsers. It offers web-based interactivity, empowering users to dynamically explore and analyse data in web environments.
Descriptive Statistics for EDA
Descriptive statistics are essential tools in EDA as they concisely summarise the dataset’s characteristics.
Measures of Central Tendency (Mean, Median, Mode)
Mean, representing the arithmetic average is the central value around which data points cluster in the dataset.
Median, the middle value in ascending or descending order, is less influenced by extreme values than the mean.
Mode, the most frequently occurring value, can be unimodal (one mode) or multimodal (multiple modes) in a dataset.
Measures of Variability (Variance, Standard Deviation, Range)
Measures of Variability include:
Variance: It quantifies the spread or dispersion of data points from the mean.
Standard Deviation: The square root of variance provides a more interpretable measure of data spread.
Range: It calculates the difference between the maximum and minimum values, representing the data’s spread.
Skewness and Kurtosis:
Skewness measures data distribution’s asymmetry, with positive skewness indicating a right-tail longer and negative skewness a left-tail longer.
Kurtosis quantifies peakedness; high kurtosis means a more peaked distribution and low kurtosis suggests a flatter one.
Quantiles and Percentiles:
Quantiles and percentiles are used to divide data into equal intervals:
Quantiles, such as quartiles (Q1, Q2 – median, and Q3), split the data into four equal parts.
Percentiles, like the 25th percentile (P25), represent the relative standing of a value in the data, indicating below which percentage it falls.
Exploring Data Relationships
Correlation Analysis
Correlation Analysis examines the relationship between variables, showing the strength and direction of their linear association using the correlation coefficient “r” (-1 to 1). It helps understand the dependence between variables and is crucial in data exploration and hypothesis testing.
Covariance and Scatter Matrix
Covariance gauges the joint variability of two variables. Positive covariance indicates that both variables change in the same direction, while negative covariance suggests an inverse relationship.
The scatter matrix (scatter plot matrix) visually depicts the covariance between multiple variables by presenting scatter plots between all variable pairs in the dataset, facilitating pattern and relationship identification.
Categorical Data Analysis (Frequency Tables, Cross-Tabulations)
Categorical data analysis explores the distribution and connections between categorical variables. Frequency tables reveal category counts or percentages in each variable.
Cross-tabulations, or contingency tables, display the joint distribution of two categorical variables, enabling the investigation of associations between them.
Bivariate and Multivariate Analysis
Data science training covers bivariate analysis, examining the relationship between two variables, which can involve one categorical and one continuous variable or two continuous variables.
Additionally, the multivariate analysis extends the exploration to multiple variables simultaneously, utilising methods like PCA, factor analysis, and cluster analysis to identify patterns and groupings among the variables.
Data Distribution and Probability Distributions
Normal Distribution
The normal distribution is a widely used probability distribution known for its bell-shaped curve, with the mean (μ) and standard deviation (σ) defining its center and spread. It is prevalent in many fields due to its association with various natural phenomena and random variables, making it essential for statistical tests and modelling techniques.
Uniform Distribution
In a uniform distribution, all values in the dataset have an equal probability of occurrence, characterised by a constant probability density function across the entire distribution range.
It is commonly used in scenarios where each outcome has the same likelihood of happening, like rolling a fair die or selecting a random number from a range.
Exponential Distribution
The exponential distribution models the time between events in a Poisson process, with a decreasing probability density function characterised by a rate parameter λ (lambda), commonly used in survival analysis and reliability studies.
Kernel Density Estimation (KDE)
KDE is a non-parametric technique that estimates the probability density function of a continuous random variable by placing kernels (often Gaussian) at each data point and summing them up to create a smooth estimate, making it useful for unknown or complex data distributions.
Data Analysis Techniques
Trend Analysis
Trend analysis explores data over time, revealing patterns, tendencies, or changes in a specific direction. It offers insights into long-term growth or decline, aids in predicting future values, and supports strategic decision-making based on historical data patterns.
Seasonal Decomposition
Seasonal decomposition is a method to separate time series into seasonal, trend, and residual components, which helps identify seasonal patterns, isolate fluctuations, and forecast future seasonal behaviour.
Time Series Analysis
Time series analysis examines data points over time, revealing variable changes, interdependencies, and valuable insights for decision-making. Time series forecasting predicts future trends, like seasonality effects on sales, like swimwear in summer, and umbrellas/raincoats in monsoon), aiding in production planning and marketing strategies.
If you are interested in mastering time series analysis and its applications in data science and business, enrolling in a data analyst course can equip you with the necessary skills and knowledge to effectively leverage this method and drive data-driven decisions.
Cohort Analysis
Cohort analysis utilises historical data to examine and compare specific user segments, providing valuable insights into consumer needs and broader target groups. In marketing, it helps understand campaign impact on different customer groups, allowing optimisation based on content that drives sign-ups, repurchases, or engagement.
Geospatial Analysis
Geospatial analysis examines data linked to geographic locations, revealing spatial relationships, patterns, and trends. It is valuable in urban planning, environmental science, logistics, marketing, and agriculture, enabling location-specific decisions and resource optimisation.
Interactive EDA Tools
Jupyter Notebooks for Data Exploration
Jupyter Notebooks offer an interactive data exploration and analysis environment, enabling users to create and execute code cells, add explanatory text, and visualise data in a single executable document.
Using this versatile platform, data scientists and analysts can efficiently interact with data, test hypotheses, and share their findings.
Data Visualisation Libraries (e.g., Matplotlib, Seaborn)
Matplotlib and Seaborn are Python libraries offering versatile plotting options, from basic line charts to advanced 3D visualisations and heatmaps, with static and interactive capabilities. Users can utilise zooming, panning, and hovering to explore data points in detail.
Tableau and Power BI for Interactive Dashboards
Tableau and Microsoft Power BI are robust business intelligence tools that facilitate the creation of interactive dashboards and reports, supporting various data connectors for seamless access to diverse data sources and enabling real-time data analysis.
With dynamic filters, drill-down capabilities, and data highlighting, users can explore insightful data using these tools.
Consider enrolling in a business analytics course to improve your proficiency in utilising these powerful tools effectively.
D3.js for Custom Visualisations
D3.js (Data-Driven Documents) is a JavaScript library that allows developers to create highly customisable and interactive data visualisations. Using low-level building blocks enables the design of complex and unique visualisations beyond standard charting libraries.
EDA Best Practices
Defining EDA Objectives and Research Questions
When conducting exploratory data analysis (EDA), it is essential to clearly define your objectives and the research questions you aim to address. Understanding the business problem or context for the analysis is crucial to guide your exploration effectively.
Focus on relevant aspects of the data that align with your objectives and questions to gain meaningful insights.
Effective Data Visualisation Strategies
Use appropriate and effective data visualisation techniques to explore the data visually.
Select relevant charts, graphs, and plots based on the data type and the relationships under investigation.
Prioritise clarity, conciseness, and aesthetics to facilitate straightforward interpretation of visualisations.
Interpreting and Communicating EDA Results
Acquire an in-depth understanding of data patterns and insights discovered during EDA.
Effectively communicate findings using non-technical language, catering to technical and non-technical stakeholders.
Use visualisations, summaries, and storytelling techniques to present EDA results in a compelling and accessible manner.
Collaborative EDA in Team Environments
Foster a collaborative environment that welcomes team members from diverse backgrounds and expertise to contribute to the EDA process.
Encourage open discussions and knowledge sharing to gain valuable insights from different perspectives.
Utilise version control and collaborative platforms to ensure seamless teamwork and efficient data sharing.
Real-World EDA Examples and Case Studies
Exploratory Data Analysis in Various Industries
EDA has proven highly beneficial in diverse industries, such as healthcare, finance, and marketing. EDA analyses patient data in the healthcare sector to detect disease trends and evaluate treatment outcomes.
For finance, EDA aids in comprehending market trends, assessing risks, and formulating investment strategies.
In marketing, EDA examines customer behaviour, evaluates campaign performance, and performs market segmentation.
Impact of EDA on Business Insights and Decision Making
EDA impacts business insights and decision-making by uncovering patterns, trends, and relationships in data. It validates data, supports hypothesis testing, and enhances visualisation for better understanding and real-time decision-making. EDA enables data-driven strategies and improved performance.
EDA Challenges and Solutions
EDA challenges include:
Dealing with missing data.
Handling outliers.
Processing large datasets.
Exploring complex relationships.
Ensuring data quality.
Avoiding interpretation bias.
Managing time and resource constraints.
Choosing appropriate visualisation methods.
Leveraging domain knowledge for meaningful analysis.
Solutions involve data cleaning, imputation, visualisation techniques, statistical analysis, and iterative exploration.
Conclusion
Exploratory Data Analysis (EDA) is a crucial technique for data scientists and analysts, enabling valuable insights across various industries like healthcare, finance, and marketing. Professionals can uncover patterns, trends, and relationships through EDA, empowering data-driven decision-making and strategic planning.
Imarticus Learning’s Postgraduate Programme in Data Science and Analytics offers the ideal opportunity for those aspiring to excel in data science and analytics.
This comprehensive program covers essential topics, including EDA, machine learning, and advanced data visualisation, while providing hands-on experience with data analytics certification courses. The emphasis on placements ensures outstanding career prospects in the data science field.