Unlocking the Secrets: What Is a Linear Regression Model and How It Can Predict Your Future

One of the key challenges in the rapidly evolving world of Machine Learning (ML) is ensuring interpretability. As ML models become more complex, their decision-making processes often turn into ‘black boxes’. This can make it difficult for even experts to understand how predictions are made, posing a significant challenge to trust and widespread adoption, particularly in fields requiring high transparency, such as healthcare, finance, and legal systems.

Fortunately, not all ML models are enigmatic. Transparent models like decision trees and linear regression offer a clearer picture of how predictive analytics work. These models are not only simpler to understand but also provide clear insights into how various input factors influence the output. In this blog, we will demystify one of the most foundational and interpretable models in the ML toolkit: the linear regression model.

This blog will explore what is a linear regression model, how it works, and why it remains a cornerstone of predictive analytics. Additionally, we will delve into practical applications of linear regression, showcasing how it can be used to predict future trends and outcomes in various domains. Learn how to harness the power of linear regression to forecast your future with confidence with this detailed guide.

What is a linear regression model?

Linear regression models are essential statistical tools employed in predictive analytics to assess the connection between a dependent variable (typically represented as y) and one or multiple independent variables (represented as X). The primary goal of linear regression is to predict the dependent variable’s value based on the independent variables’ values.

The model assumes a linear relationship between the variables, which can be expressed with the equation:

y = β₀ + β₁X₁ + β₂X₂ + …+ βX+ ϵ

Here:

  • y- dependent variable
  • X₁, X₂,…, X​ – independent variables
  • β₀​ – intercept
  • Β₁, β₂, …, β​ – coefficients
  • ϵ – error term

The intercept and coefficients are derived from the data, and they define the regression line that best fits the data points.

The simplest form, called simple linear regression, involves one dependent and one independent variable, while multiple linear regression involves multiple independent variables.

Visualisation of linear regression

Visualisation is a powerful tool in linear regression, helping to illustrate the relationship between variables. A scatter plot is often used to display the data points. Each point represents an observation with values for the independent and dependent variables. The regression line is then plotted, showing the best fit through these points. 

This line minimises the sum of the squared differences between the observed and predicted values. Thus, it provides a clear visual representation of the relationship and allows analysts to identify trends and patterns easily.

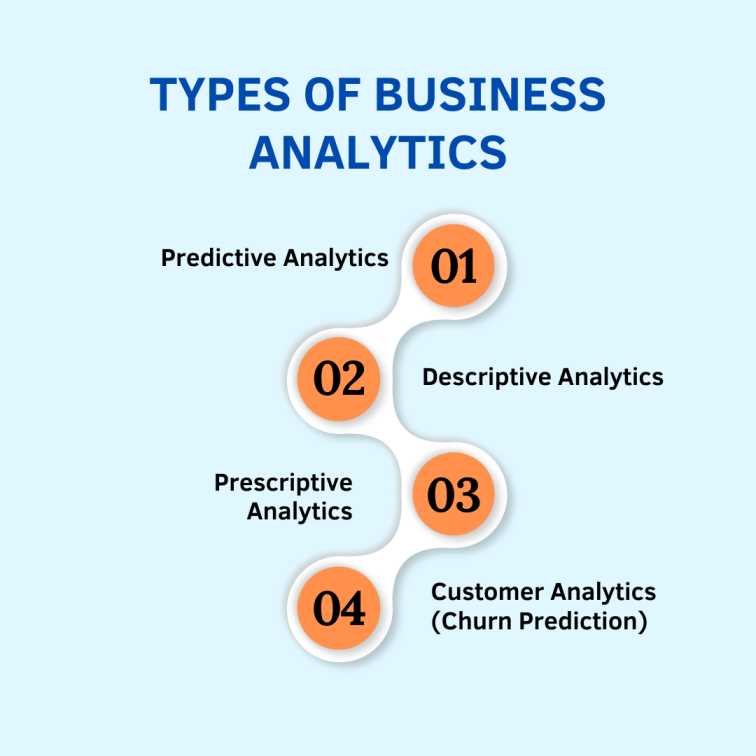
Importance and relevance of linear regression models in business analytics

Linear regression is a widely popular data science tool due to its simplicity and interpretability. It helps understand how the dependent variable changes with a unit change in the independent variable(s) and is applicable in various fields such as economics, biology, engineering, and social sciences for tasks like forecasting, risk management, and trend analysis. 

In businesses, it helps analysts understand the impact of one or more independent variables on a dependent variable, making it essential for forecasting and decision-making. For instance, a company might use linear regression analysis to predict sales based on advertising spend or understand how economic indicators like GDP influence market performance. 

This predictive capability allows businesses to: 

  • Strategise effectively, 
  • Allocate resources optimally, 
  • Make data-driven decisions, enhancing operational efficiency and profitability.

A business analytics course delves deeper into the models (linear, multiple) and their objectives. It offers an in-depth understanding of how these models are used in various scenarios to predict the future and make better decisions.  

How Linear Regression Analysis Works

Now that we have covered the basics of linear regression let’s take a look at how the analysis actually works. 

Steps involved in linear regression analysis

Linear regression analysis involves several key steps, as mentioned below:

  1. Start by clearly defining the problem and formulating a hypothesis.
  2. Specify the linear regression model to estimate the relationship between the dependent and independent variables.
  3. Estimate the coefficients that represent the relationship between the variables.
  4. Evaluate and validate the model to ensure its reliability and accuracy.

Data collection and preparation

Data collection is the foundation of any regression analysis. The quality and relevance of the data significantly impact the model’s effectiveness. Business analysts gather data from various sources, ensuring it is accurate and comprehensive. Data preparation involves cleaning the data, handling missing values, and transforming variables if necessary. This step ensures that the dataset is ready for analysis and free from any biases or inconsistencies.

Model estimation and interpretation of coefficients

Once the data is prepared, the next step is model estimation. This involves fitting the linear regression model to the data, typically using methods like least squares to estimate the coefficients. These coefficients represent the relationship between the independent variables and the dependent variable. 

Interpreting these coefficients helps analysts understand how changes in the predictors influence the outcome. For instance, a positive coefficient indicates a direct relationship, whereas a negative one signifies an inverse relationship.

Model validation techniques (R-squared, residual analysis)

Model validation is crucial to ensure the regression model’s reliability. One of the key metrics used is R-squared, which measures the proportion of variability in the dependent variable explained by the independent variables. A higher R-squared value indicates a better fit. 

Also, residual analysis involves examining the differences between observed and predicted values to detect patterns or inconsistencies. This helps identify model deficiencies and improves predictive accuracy.

Understanding Linear Regression Statistics

Aspiring business analysts must grasp key statistics to evaluate linear regression models effectively. Here are the essential statistics and how they aid in assessing model performance.

Key statistics: R-squared, p-values, standard error

  • R-squared: This statistic measures the proportion of variance in the dependent variable that is predictable from the independent variables. An R-squared value closer to 1 indicates a strong model fit, meaning the model explains a significant portion of the variability in the response variable.
  • P-values: P-values indicate the significance of each coefficient in the model. A low p-value (typically < 0.05) suggests that the corresponding independent variable has a statistically significant relationship with the dependent variable.
  • Standard Error: This metric measures the average distance that the observed values fall from the regression line. A lower standard error indicates that the model’s predictions are more precise.

How these statistics help in evaluating the model’s performance

  • R-squared: Helps determine the model’s explanatory power. A higher R-squared value means better predictive accuracy.
  • P-values: Help identify which variables contribute meaningfully to the model, ensuring the model is robust and reliable.
  • Standard Error: Assists in assessing the precision of predictions. A model with a lower standard error provides more accurate and reliable predictions.

Applications of Linear Regression in Business

Linear regression models help businesses make data-driven decisions. Aspiring business analysts can benefit from understanding its applications across various domains.

Examples of linear regression applications in various business domains (finance, marketing, operations)

  • Finance: Linear regression is used to predict stock prices, assess investment risks, and forecast financial performance. For example, it helps in estimating future sales and revenue by analysing past trends and market conditions.
  • Marketing: Businesses apply linear regression to understand customer behaviour, optimise pricing strategies, and improve marketing campaigns. It helps determine the effectiveness of different marketing channels and predict customer demand.
  • Operations: In operations, linear regression assists in inventory management, demand forecasting, and improving supply chain efficiency. Companies use it to predict product performance and optimise production schedules.

Advantages and Limitations of Linear Regression

Linear regression offers both advantages and limitations that are crucial for making informed decisions in data-driven environments.

Benefits of using linear regression in predictive modelling

  • Interpretability: Linear regression provides a straightforward explanation of coefficients, thus simplifying the illustration of relationships between variables.
  • Simplicity: Its implementation and comprehension are direct, ensuring accessibility even for individuals with minimal statistical expertise.
  • Efficiency: Training and prediction times typically outpace those of more intricate models, rendering it well-suited for extensive datasets.

Common pitfalls and how to address them

  • Assumption of Linearity: Linear regression typically assumes a linear association between variables, though this assumption may not universally apply across all datasets and scenarios. Techniques like polynomial regression or transformations can help address this.
  • Overfitting: Using too many variables can lead to overfitting, where the model performs well on training data but poorly on new data. Regularisation methods like Ridge or Lasso regression can mitigate overfitting.

Comparison with other predictive modeling techniques

  • Versus Non-linear Models: Linear regression is less flexible in capturing complex relationships compared to non-linear models like decision trees or neural networks.
  • Versus Ensemble Methods: While ensemble methods like Random Forests may provide higher accuracy in some cases, linear regression remains valuable for its simplicity and interpretability.

Future Trends and Innovations in Linear Regression

Business analysts exploring the landscape of data science must stay abreast of evolving trends in linear regression. This foundational statistical technique continues to evolve with advancements in machine learning and big data analytics, offering new possibilities and integration pathways.

Advances in linear regression methods and tools

  • Innovations in regularisation techniques like Ridge and Lasso regression improve model performance and robustness.
  • Bayesian linear regression offers probabilistic modelling benefits, enhancing uncertainty quantification in predictions.
  • Non-linear regression methods, such as polynomial regression, are being integrated to capture complex relationships in data.

Integration with other machine learning techniques

  • Ensemble Methods: Hybrid models combining linear regression with ensemble techniques like Random Forests are enhancing prediction accuracy.
  • Deep Learning: Integration of linear regression with neural networks for feature extraction and predictive modelling in complex datasets.

Impact of big data and AI on linear regression analysis

Scalability: Linear regression models are now capable of handling vast amounts of data, leveraging distributed computing frameworks.

Automation: AI-driven tools automate model selection, feature engineering, and hyperparameter tuning, streamlining the linear regression workflow.

Conclusion

Understanding the linear regression meaning and its application is fundamental for anyone involved in data analysis and predictive modeling. By leveraging linear regression statistics, analysts can make accurate predictions and gain valuable insights into their data. Whether you’re forecasting sales, analysing economic trends, or exploring scientific phenomena, linear regression provides a powerful and intuitive tool for unlocking the secrets hidden within your data.

The Postgraduate Certificate in Business Analytics offered by XLRI and Imarticus can help professionals acquire industry-relevant knowledge and hands-on skills, helping them hone their data-driven decision-making approach.

FAQs

  • How is linear regression used to predict future values?

Linear regression is employed to predict future values by establishing a relationship between a dependent variable and one or more independent variables from past data. This statistical method fits a straight line to the data points, enabling predictions of future outcomes based on the established pattern.

  • What does a regression model aim to predict?

Regression models are used to analyse and predict continuous variables, helping businesses and researchers make informed decisions based on data patterns.

  • Is the goal of linear regression for prediction or forecasting?

The primary goal of linear regression is prediction rather than forecasting. It aims to predict the value of a dependent variable based on the values of independent variables, establishing a linear relationship between them. While it can be used for forecasting in some contexts, such as predicting future sales based on historical data, its core purpose is to make predictions about continuous outcomes rather than projecting future trends over time.

  • How is linear regression used in real life?

Some common real-life applications of linear regression include predicting stock prices based on historical data, estimating the impact of advertising spending on sales, predicting patient outcomes based on clinical variables, etc.

Essentials of Business Analytics: Linear Regression Model

Linear regression is a crucial technique in many essential types of business analytics, serving as a powerful method for modelling the relationship between variables. In simpler terms, it allows us to quantify the influence of one factor (independent variable) on another (dependent variable). This understanding is crucial for informed decision-making across various business functions.

For instance, a marketing team can leverage linear regression to analyse the impact of advertising spend on sales figures. By establishing a statistical relationship, they can predict future sales trends and optimise marketing budgets for maximum return on investment. It is tasks such as these that make the linear regression model extremely useful in many different types of business analytics.

In this article, I will discuss the core principles of linear regression and then we will explore its practical applications in the business world. We will cover the model-building process and understand its benefits for strategic decision-making. I will also address its limitations so that you can gain a well-rounded understanding of this fundamental analytical tool.

Building Your Linear Regression Model

Constructing a robust linear regression model for different types of business analytics requires a systematic approach. Here is a breakdown of the key stages involved:

  1. Data Collection: The foundation of any successful model is high-quality data. Ensure your data is relevant to the question you are trying to answer and captures the variables of interest. Remember, “garbage in, garbage out” applies to data quality as well.
  2. Data Cleaning and Preparation: Real-world data often contains inconsistencies or missing values. This stage involves meticulously cleaning your data by addressing missing entries, identifying and handling outliers, and ensuring data consistency across variables. In essence, you’re preparing your data for a clean analysis.
  3. Model Fitting: Here, we fit a line (the regression line) to your data using the method of least squares. This method minimises the sum of the squared residuals (the difference between predicted values and actual values). The resulting line represents the statistical relationship between the independent and dependent variables.
  4. Model Evaluation: Just because we have a line does not mean the model is perfect. Evaluating the model’s performance is crucial. Common metrics used here include R-squared and adjusted R-squared. These metrics tell you how well the model explains the variation in your data, helping you assess its accuracy and generalisability.

Overfitting and Underfitting

Let us take two extremes as examples. A line that perfectly fits every single data point (overfitting) and a line with almost no slope (underfitting). While an overfitted line captures every detail of the data, it might not generalise well to unseen data. Conversely, an underfitted line fails to capture the underlying relationship between variables.

A model that captures the essential trend without overfitting the data is the key to striking the right balance. Techniques like cross-validation can help identify and address overfitting or underfitting, ensuring your model achieves a good balance between accuracy and generalisability. If you wish to learn different types of business analytics concepts, techniques and methodologies you can enrol in the comprehensive business analytics course by XLRI and Imarticus. This postgraduate business analytics course will teach you everything you need to know about techniques such as logistic regression.

The Different Types of Analytics in Business Analytics That Leverage Linear Regression

types of business analytics

Linear regression serves as a versatile tool across various business analytics domains. Here are some prominent types of analytics with examples:

1. Predictive Analytics

Example: Forecasting Sales

Linear regression models can analyse historical sales data alongside factors like marketing spend, seasonality, and economic indicators. By identifying trends and relationships, the model predicts future sales figures, enabling informed inventory management and production planning in these types of business analytics methods.

2. Descriptive Analytics

Example: Understanding Customer Behaviour

Linear regression can analyse customer purchase history data and demographics and thus it is used in these types of business analytics processes. The model can reveal relationships between purchase patterns and customer characteristics, helping businesses identify target segments and personalise marketing campaigns.

3. Prescriptive Analytics

Example: Optimising Pricing Strategies

Linear regression models can analyse historical pricing data, customer demand, and competitor pricing. By identifying the impact of price changes on sales volume, the model can suggest optimal pricing strategies to maximise revenue while considering customer price sensitivity for these types of business analytics methods.

4. Customer Analytics (Churn Prediction)

Example: Identifying Customers at Risk of Churn

Linear regression models can analyse customer behaviour data (purchase frequency, support interactions, etc.). This is why the linear regression model is used for these types of these types of business analytics techniques. By identifying patterns associated with churn (customers leaving a service), the model predicts which customers are at risk, allowing businesses to develop targeted retention campaigns and minimise churn rates.

Business Applications in Action: The Linear Regression Model for Strategic Decisions

Linear regression transcends theory and empowers data-driven decision-making across various business functions. Let us explore how it translates into actionable insights in real-world scenarios:

Marketing Mix Optimisation

Think of a company running social media and email marketing campaigns. Linear regression can analyse the impact of each campaign on customer acquisition costs. By identifying the most effective channel, they can optimise marketing spend and maximise customer acquisition for their budget.

Customer Churn Prediction

Predicting customer churn (customers leaving a service) is critical for subscription-based businesses. Linear regression models can analyse customer behaviour data (purchase history, support interactions) to identify patterns associated with churn. This allows businesses to proactively target at-risk customers with retention campaigns and minimise churn rates.

Inventory Management

Retailers face the constant challenge of balancing stock availability with storage costs. Linear regression models can analyse historical sales data and seasonal trends to forecast future demand. This empowers businesses in optimising the inventory level, making sure that they have the right amount of stock for meeting customer requirements without incurring additional storage costs.

A/B Testing

The power of linear regression lies in its predictive capabilities. However, real-world business decisions often involve complex relationships beyond those captured in the model. Here is where A/B testing comes in.

Beyond the Line: Understanding the Boundaries of Linear Regression

Linear regression, while a powerful tool, has limitations to consider. Here, we explore these boundaries to ensure you leverage the linear regression model effectively for making informed business decisions:

Assumes Linearity

The core assumption is that the relationship between variables can be represented by a straight line. This might not always hold true in real-world scenarios where data exhibits a curved or more complex pattern. In such cases, exploring alternative models like decision trees that can capture non-linear relationships might be necessary.

Data Quality Matters

“Garbage in, garbage out” applies to linear regression. Inaccurate or incomplete data can lead to misleading predictions. Emphasise the importance of data cleaning and quality checks before model building. Outliers and missing values require careful handling to ensure the model reflects the underlying trends in your data.

Categorical Variable Hurdle

Linear regression is designed for continuous variables (numbers). It cannot directly handle categorical variables (e.g., customer type: high-value, medium-value, low-value). Techniques like dummy coding, which converts categorical variables into multiple binary variables, can be employed to incorporate them into the model.

Multicollinearity: The Entangled Variables Conundrum

Assume that two independent variables in your model are highly correlated (e.g., household income and spending on groceries). This is multicollinearity, and it can cause problems in linear regression. When variables are highly correlated, it becomes difficult to isolate the individual effect of each on the dependent variable. Techniques like correlation analysis can help identify multicollinearity. Dropping one of the highly correlated variables or using dimensionality reduction techniques can help address this issue and ensure your model accurately captures the relationships between variables.

Wrapping Up

By mastering these aspects, you can transform linear regression from a theoretical concept into a practical tool for driving strategic decision-making and achieving long-term business success. Remember, this is just the first step in your data analytics journey. Explore further avenues like model selection for non-linear relationships and delve deeper into data visualisation techniques to create compelling data stories for stakeholders.

The world of business analytics awaits. Enrol in a solid postgraduate business analytics course such as the Postgraduate Certificate in Business Analytics by XLRI and Imarticus Learning. This holistic business analytics course will teach you everything you need to become an expert business analyst.

Frequently Asked Questions

What is the difference between correlation and causation with linear regression?

Linear regression shows correlation, a connection between variables. It does not necessarily prove causation (one causing the other). Just because marketing spends and sales are correlated, does not mean spending more always directly causes more sales. Consider other factors that might influence sales as well.

Can linear regression handle very large datasets?

Yes, linear regression can work with large datasets. However, computational power and processing time might increase as the data volume grows. There are efficient algorithms optimised for large datasets, but for extremely large datasets, alternative techniques like sampling might be considered.

Is there a linear regression model readily available in software?

Many data analysis and spreadsheet software packages offer linear regression functionality. These tools can simplify the process of building and analysing linear regression models, making it accessible to users with varying levels of technical expertise.

What are some ethical considerations when using linear regression for business decisions?

Bias in the data can lead to biased predictions from the model. Be mindful of potential biases in data collection and ensure your model is representative of the target population. Use the model’s insights responsibly and avoid making discriminatory decisions based solely on model predictions.

Using Total Addressable Market (TAM) For Identifying the Potential of Products/Services

Let us assume that we are opening a bakery. The entire town (let us say 10,000 people) represents the Total Addressable Market (TAM) for our delicious pastries. That is the total number of people who could potentially buy our croissants.

However, not everyone will be our customers. Some might prefer doughnuts, others might have dietary restrictions and some might just live too far away. This is where the Serviceable Available Market (SAM) comes in. It is the portion of the TAM that you can realistically reach with your offerings.

Finally, within our SAM, there is the Serviceable Obtainable Market (SOM). This is the slice of the pie we can realistically capture. It considers factors like competition, marketing budget, and our ability to convert potential customers into loyal patrons.

Market Sizing with Total Addressable Market

It is extremely crucial to understand the market size as that is the foundation of a business. Knowing the TAM helps a business in these ways:

  • Project revenue potential: A larger Total Addressable Market suggests a bigger potential customer base and higher revenue possibilities.
  • Allocate resources effectively: For example, if the TAM for gluten-free pastries is smaller, you might not invest as heavily in marketing them compared to your classic pastries.
  • Make informed investment decisions: Investors often look at TAM to assess the potential growth of a business.

Limitations of Total Addressable Market

While TAM is valuable, it has limitations. Here is why relying solely on TAM can be misleading:

  • Disruptive Innovations: Let us assume that you have invented a teleportation device. The TAM for traditional transportation (cars, aeroplanes) would not reflect the entirely new market you are creating.
  • Future Focus: TAM is a snapshot of the current market. It might miss out on emerging trends and the potential for future market growth.

Validating the Total Addressable Market

Do not just take the Total Addressable Market number at face value. Here is how to strengthen your TAM analysis:

  • Customer Discovery: Talk to potential customers, understand their needs, and see if your product truly solves a problem for them.
  • Market Research: Analyse existing market trends, competitor strategies, and the overall market landscape to refine your Total Addressable Market estimate.

By combining Total Addressable Market with customer insights and market research, we can paint a more accurate picture of a product’s market potential and set any business up for success.

A Step-by-Step Breakdown of TAM

Here is a breakdown of the Total Addressable Market formula and how to use it effectively:

The core total addressable market calculation is,

TAM = ARPU * Total Potential Customers

In the above total addressable market calculation:

  1. ARPU (Average Revenue Per User): This represents the average amount of revenue generated from a single customer within a specific period (usually monthly or annually).
  2. Total Potential Customers: This signifies the total number of individuals or businesses that could potentially use your product or service.

Example: Let us say you run a fitness app with a monthly subscription fee of $10. If your research suggests there are 1 million people interested in mobile fitness solutions, your TAM would be:

TAM = $10/month * 1,000,000 people = $10,000,000 per month

For niche markets with limited ARPU data, alternative methods exist:

  • Market Penetration Rate: Multiply the total addressable market of a broader category by the estimated percentage your product can capture within that category.
  • Bottom-Up Approach: Identify customer segments within your TAM and estimate ARPU for each segment.

We should always remember that reliable data sources are crucial. Use industry reports, market research, and competitor analysis to support your assumptions when calculating TAM. A well-informed Total Addressable Market estimate is a valuable tool, but not a crystal ball.

TAM: A Multifaceted Tool for Strategic Advantage

TAM’s power extends far beyond simply gauging market size. Here is how it fuels strategic decision-making:

  • Investment Decisions: Venture capitalists use TAM to identify markets with high growth potential. A large TAM with a proven track record of customer spending signals a potentially lucrative space for investment.
  • Product Development: TAM guides product prioritisation. If one feature caters to a larger segment within the TAM compared to another, it might take precedence in development based on its potential revenue stream.
  • Marketing and Sales Strategies: TAM helps define target markets within the overall pool. By segmenting the TAM based on demographics or needs, companies can tailor their marketing messages and allocate resources efficiently to maximise market penetration.

Beyond market sizing, TAM fuels strategies for market dominance within a specific segment. Here is how:

  • TAM Share: This metric represents the percentage of the TAM a company captures. Companies can develop strategies to increase their TAM share, like expanding their product offerings or targeting new customer segments within the existing TAM.
  • Market Opportunity Analysis (MOA): This analysis builds upon TAM by factoring in competition and market dynamics. By understanding competitor strategies and market growth rates, businesses can refine their TAM estimates and identify opportunities for differentiation within the market.

By wielding TAM alongside MOA, companies gain a holistic view of the market landscape and can craft targeted strategies to carve out a dominant position within their chosen TAM segment.

Real-World Examples of Total Addressable Market in Action

Total Addressable Market is not just a theoretical concept. Here is how companies leverage it in the real world:

Success Story, Uber’s TAM Takeover: Initially, Uber focused on the taxi market (limited TAM). Recognising the broader TAM for on-demand transportation, they expanded to ride-sharing, capturing a much larger market share.

Missed Opportunity? Kodak and the Digital Shift: Kodak dominated the film photography market (large TAM). However, they underestimated the TAM for digital photography, leading to their decline.

Disruption and TAM, Airbnb’s Hospitality Revolution: Airbnb disrupted the hotel industry by creating a new market for shared accommodations. Traditional Total Addressable Market calculations would not have captured this entirely new market segment Airbnb unlocked.

TAM and Emerging Tech, The Self-Driving Revolution: The TAM for self-driving cars is difficult to estimate due to the nascent technology. However, understanding the potential impact on transportation, logistics, and urban planning is crucial for companies positioning themselves in this disruptive market.

The above examples showcase the power and limitations of TAM. While it provides valuable insights, staying attuned to disruptive innovations and conducting thorough market research alongside TAM analysis is key to making informed strategic decisions and navigating the ever-evolving market landscape. If you wish to learn financial analysis and other essential concepts such as TAM, you should enrol in a solid financial analyst course.

Beyond TAM

TAM paints a broad picture, but businesses need a sharper focus. Here is how we delve deeper:

Customer Segmentation: A large TAM does not guarantee success. Segmenting the TAM based on demographics (age, income), needs (business vs. personal use), and buying behaviours allows for targeted marketing and product development.

TAM Fragmentation: A large TAM can be deceiving. It might be composed of numerous smaller segments with vastly different needs. For example, the fitness app TAM might include segments interested in weight loss, muscle building, or general health, each requiring tailored features.

Market dynamics are ever-changing. Here is why considering market growth is crucial:

  • Market Growth Rates: A TAM with a high growth rate suggests a more promising market compared to a stagnant one. Understanding growth rates helps businesses prioritise resources and plan for future market expansion.
  • TAM Evolution: The TAM itself can evolve over time. New technologies, regulations, and consumer behaviour can affect the market size. Regularly revisiting TAM estimates ensures businesses adapt their strategies to a changing landscape.

TAM alone does not tell the whole story. Here is why understanding your competitors is key:

  • Competitive Analysis: Knowing your competitors’ market share within the TAM helps assess your own potential for growth. Analysing their strengths and weaknesses can inform your differentiation strategies.
  • Disruption Potential: Emerging technologies or innovative business models can disrupt existing markets, rapidly shrinking or expanding the TAM. Staying informed about potential disruptions helps businesses prepare and adapt.

By considering customer segmentation, market growth, and competitive dynamics alongside TAM, businesses can gain a comprehensive understanding of their market and make informed decisions that lead to long-term success.

Wrapping Up

TAM equips businesses with a powerful tool to assess product/service potential. It provides valuable insights into market size and potential revenue streams. However, the Total Addressable Market is just one piece of the puzzle. Remember, successful market evaluation requires considering customer segmentation, market growth, and the competitive landscape. By wielding TAM alongside these factors, businesses can make strategic decisions that unlock the true potential of their offerings and navigate the ever-evolving market landscape with confidence.

If you want a career in financial analysis, you can enrol in Imarticus Learning’s Financial Analysis Prodegree in Collaboration with KPMG. This is a comprehensive financial analyst course that will teach you everything you need to know about financial analysis.

Frequently Asked Questions

What is total addressable market? What is the difference between TAM, SAM, and SOM?

TAM (Total Addressable Market) is the entire pool of potential customers. SAM (Serviceable Available Market) is the portion of TAM you can realistically reach. SOM (Serviceable Obtainable Market) is the part of SAM you can capture with your resources and strategies.

Is not TAM just a basic market size metric?

Total Addressable Market goes beyond just size. It helps with investment decisions, product development, and marketing strategies by showing the potential revenue a market holds.

Can TAM be misleading?

Yes, for disruptive innovations that create entirely new markets, the Total Addressable Market might underestimate the true potential. It is also a snapshot in time and does not account for future market changes.

How can I improve my TAM analysis?

Segment your TAM based on customer needs. Consider market growth rates and how the TAM itself might evolve. Do not forget to factor in competitor analysis to understand the competitive landscape within your TAM.

AI Examples in Business: Chatbots, Fraud Detection, Solving Business Problems, Product Recommendations and More!

AI is a powerful tool businesses are using to solve problems, automate tasks, and gain valuable insights. Forget complex algorithms and think of artificial intelligence technology as super-smart automation that augments human capabilities. For example, take AI business solutions that can analyse mountains of data, identify patterns we might miss and even make predictions. That is the essence of AI. 

Artificial intelligence can even personalise interactions, offer relevant recommendations, and provide 24/7 support, boosting customer satisfaction. Chatbots are a great example of this. The benefits for businesses are undeniable. AI business solutions offer effortless automation and solve many challenging business problems.

Repetitive tasks can be handled by AI, freeing up employees for more strategic work. AI can analyse vast amounts of data to identify trends and make better-informed (data-driven) decisions. AI is not here to replace humans, it is here to empower us. Let us explore how various businesses are leveraging AI business solutions to achieve real-world success.

How AI Solves Real-World Business Problems

AI is no longer confined to research labs. AI business solutions are actively tackling complex challenges across industries, transforming how businesses operate. Here are some fascinating examples:

Supply Chains

Think of a world where stockouts are a thing of the past. AI algorithms are making this a reality. By analysing vast quantities of sales data, weather patterns, and even social media trends, AI can predict demand fluctuations with incredible accuracy. This allows businesses to optimise logistics routes, minimise inventory holding costs, and ensure shelves are always stocked with the right products. (For instance, Walmart leverages AI to optimise stock levels in stores, ensuring they have the right amount of sunscreen in Florida during summer and winter coats in Alaska.)

Dealing With Fraud

Financial institutions are constantly battling fraudsters. AI steps in as a vigilant guardian, analysing millions of financial transactions in real-time. AI algorithms can identify subtle patterns indicative of fraudulent activity, such as unusual purchase locations or sudden spikes in spending. This empowers banks to flag suspicious transactions and prevent financial losses. (Many banks utilise AI to detect anomalies in credit card transactions, like a purchase from a high-risk location, and block the transaction before it goes through.)

Predictive Maintenance

Downtime is a costly nightmare for businesses that rely on machinery. This is another one of those business problems where AI comes to the rescue. AI can analyse sensor data from equipment, such as vibrations or temperature fluctuations, to predict potential failures before they occur. This enables proactive maintenance, preventing costly breakdowns and ensuring smooth operations. (Airlines are at the forefront of this, leveraging AI to predict potential issues with aircraft engines based on sensor data. This allows them to schedule maintenance before a critical failure occurs, ensuring safe and reliable air travel.)

Decisions With XAI

While AI’s problem-solving abilities are impressive, understanding how it arrives at its decisions is crucial, especially in critical business applications. This is where Explainable AI (XAI) comes in. XAI techniques help us understand the reasoning behind an AI model’s decisions. Imagine an AI system predicting a higher risk of equipment failure. XAI can explain which sensor data points and patterns contributed to that prediction, fostering trust and transparency in the AI decision-making process. By embracing AI and XAI, businesses can harness the power of intelligent automation while ensuring responsible and explainable decision-making across various business functions.

AI Business Solutions for Customer Experience (CX)

AI’s impact on customer experience goes far beyond suggesting similar products after a purchase. Let us explore how AI personalises the entire customer journey, fostering deeper connections and boosting satisfaction.

Chatbots

Imagine a virtual assistant who recalls your past interactions and preferences. AI-powered chatbots can personalise conversations based on customer history. Chatbots can answer specific questions about past orders, recommend relevant products based on previous purchases and even adjust their tone and language to create a more natural and engaging interaction.

Recommendations

 Ever visited a website where the product recommendations seem eerily on point? That is AI at work. AI can analyse user behaviour, browsing history and past purchases to personalise website content and product recommendations in real-time. This ensures customers see products they are genuinely interested in, leading to a more satisfying shopping experience.

Sentiment Analysis

Businesses often struggle to understand the true voice of their customers. AI can analyse customer reviews, social media mentions, and even survey responses to gauge sentiment. By identifying positive and negative feedback, businesses can pinpoint areas for improvement and proactively address customer concerns.

AI-Generated Personalisation

Personalisation does not stop at recommendations. Generative AI, a cutting-edge branch of AI, allows businesses to create personalised marketing content or product descriptions tailored to individual customer preferences. Imagine receiving an email with product descriptions written specifically for you, highlighting features you have shown interest in previously. Generative AI personalises the marketing experience at a whole new level, fostering deeper connections and driving conversions.

AI on the Cutting Edge: A Glimpse into the Intelligent Future

The world of AI is constantly evolving, pushing the boundaries of what is possible. Here is a peek into the future of business, powered by intelligent automation:

Drug Discovery and Research

Drug discovery is a slow and laborious process. AI is changing the game. By analysing massive datasets of molecular structures and biological data, AI can identify promising drug candidates at an unprecedented pace. This can accelerate the development of life-saving medications and treatments for various diseases.

Self-Driving Cars

Self-driving cars are no longer science fiction. AI plays a critical role in enabling autonomous vehicles to navigate the world. AI algorithms process sensory data from cameras, lidar, and radar, allowing self-driving cars to perceive their surroundings, make real-time decisions, and navigate roads safely.

Robotic Process Automation

Repetitive tasks can be a real drag on employee productivity. Robotic Process Automation (RPA) powered by AI is here to help. AI-powered robots can automate mundane tasks in various departments, from data entry to customer service interactions. This frees up human employees to focus on more strategic work that requires creativity and critical thinking.

Ethics and Responsibility

As AI continues to evolve, ethical considerations become paramount. Businesses must ensure responsible development and deployment of AI to avoid bias and ensure fairness in decision-making. Transparency and explainability of AI models are crucial to building trust and ensuring AI serves humanity for the greater good.

Wrapping Up

AI is no longer a futuristic fantasy, it is a powerful business reality. From automating tasks to personalising customer journeys and even accelerating scientific breakthroughs, AI is transforming industries at an unprecedented pace.

The key takeaway? Do not wait for the future to arrive. Embrace AI’s potential today. We should always remember that AI is not here to replace humans, it is here to empower us. By combining human ingenuity with the power of intelligent automation, businesses can unlock a new era of innovation and growth.

Take the first step today and unleash the power of AI by enrolling in the Executive Programme In AI For Business by IIM Lucknow and Imarticus Learning. This executive programme is one of the most comprehensive AI and ML courses out there.

Frequently Asked Questions

Is AI a threat to jobs?

AI automation can replace repetitive tasks, but it is creating new opportunities in areas such as AI development, data analysis, and human-AI collaboration. Businesses will need a mix of human and AI skills for success.

How can small businesses leverage AI?

Many AI-powered services are now cloud-based and affordable. Small businesses can explore AI for tasks like marketing automation, customer service chatbots, or sales forecasting based on customer data. Holistic AI and ML courses can teach you how to use AI business solutions for small firms and projects.

Is AI secure?

AI security is an ongoing concern. Businesses should ensure they have robust data security measures in place and choose reputable AI vendors with strong security practices.

What are the ethical considerations of AI in business?

Bias in training data can lead to biased AI models. Businesses should be mindful of these biases and ensure their AI is fair and ethical in its decision-making processes. Transparency in how AI models arrive at decisions is also crucial.

Interpreting Insights From Analysis for Data-Driven Business Decisions

Data visualisation is a powerful tool, but it is just the beginning of the data analysis journey. Those flashy charts and graphs can showcase trends and patterns, but they often fall short of uncovering the deeper “why” behind the numbers. 

This is where true data analysis comes in. By going deeper, we can identify hidden patterns and relationships that charts might miss. Let us take a graph showing a decline in sales as an example. While visualisation might suggest a straightforward drop, further analysis and interpretation could reveal a correlation with a recent marketing campaign targeting the wrong demographic. 

The key to unlocking these hidden gems lies in critical thinking and asking the right questions. Do not just accept what the data seems to be saying on the surface. Explore correlations, identify outliers, and challenge assumptions. By asking questions like “Why did this metric spike?” or “Are there external factors influencing this trend?“, you can unearth valuable insights that traditional data visualisation might overlook.

It is through this deeper analysis that data transforms from a collection of numbers into real insights. Let us learn more.

Beware of Biases: The Data Deception Trap

Data analysis is a powerful tool, but it is only as strong as the data itself. Unfortunately, data can be riddled with biases, like tiny cracks in a foundation, leading to skewed results and potentially disastrous business decisions. Here is why understanding bias is crucial:

  • Selection Bias: Imagine surveying only customers who actively use your social media platform. This neglects the silent majority and paints an inaccurate picture of overall customer sentiment.
  • Confirmation Bias: We all have a tendency to favour information that confirms our existing beliefs. A marketing team convinced their new product targets millennials might focus solely on data showing high social media engagement among young adults, ignoring valuable insights from a broader demographic analysis.

These are just two examples. Biases can creep in at every stage, from data collection to interpretation. A company analysing website traffic data solely from its own marketing channels might miss valuable insights from organic search or social media referrals due to source bias.

So, how do we avoid the data deception trap? Here are some actionable tips:

  • Data Triangulation: Verify findings by analysing data from multiple sources (e.g., website analytics, customer surveys, social media listening). This cross-checking helps identify inconsistencies and potential biases within individual datasets.
  • Diverse Data Sources: Do not rely solely on readily available data. Look for alternative sources that might challenge your initial assumptions and provide a more holistic view.
  • Blind Analysis: Where possible, conduct blind analysis by withholding certain information (e.g., demographics) from analysts to prevent confirmation bias from influencing their interpretations.

By being aware of potential biases and implementing these techniques, you can ensure your data analysis reflects reality, not a skewed version, and pave the way for sound decision-making.

Frameworks for Action: Turning Insights into Decisions

Data analysis is like a treasure hunt, we unearth valuable insights, but how do we translate that treasure into real-world business decisions? This is where data-driven decision frameworks come in. These frameworks provide a structured approach to bridge the gap between insights and action.

The Data-Driven Decision Making Framework (DDDM)

The DDDM framework emphasises a six-step process:

  1. Define the Business Problem: Clearly articulate the specific challenge you are trying to address.
  2. Collect Relevant Data: Gather data from various sources, ensuring it aligns with your problem definition.
  3. Analyse the Data: Employ data analysis techniques to uncover trends, patterns, and relationships within the data.
  4. Draw Insights: Interpret the results and translate them into actionable recommendations.
  5. Develop Recommendations: Based on the insights, propose specific actions to address the business problem.
  6. Evaluate and Monitor: Implement the chosen solution, track its effectiveness, and adapt based on ongoing data and feedback.

Case Study: A clothing retailer noticed a decline in sales for a specific product line. Using the DDDM framework, they analysed sales data, customer reviews, and social media trends. This revealed a shift in consumer preferences towards a more sustainable fabric type. The retailer used this insight to develop a new product line using eco-friendly materials, leading to a significant increase in sales.

The 5 Whys of Data Analysis

This simple yet powerful framework encourages you to drill down to the root cause of an issue by repeatedly asking “why” to each identified factor.

Case Study: A subscription service noticed a high churn rate among new subscribers. Using the 5 Whys, they discovered:

  1. Why are subscribers churning? – Because they are not finding enough value in the content.
  2. Why is the content not valuable? – Because it does not address their specific needs.
  3. Why does not it address their needs? – Because new subscribers are not properly onboarded and categorised based on their interests.

This analysis revealed a need for a personalised onboarding process, leading to a significant reduction in churn and improved customer retention.

Remember, the chosen framework should fit the specific problem. The DDDM framework provides a comprehensive approach to complex issues, while the 5 Whys is ideal for pinpointing root causes. By selecting the right framework and following its steps, you can transform data insights into actionable decisions that drive positive business outcomes.

Communication is Key: Translating Insights for Stakeholders

Unearthed a goldmine of data insights? The next hurdle is ensuring your stakeholders understand the significance and can translate it into action. Here is why clear communication is crucial:

Decision-Making Power

Stakeholders rely on your data-driven insights to make informed decisions. Jargon-filled presentations can lead to misunderstandings and hinder effective decision-making.

Tailoring Your Message

Technical Audience: For data-savvy audiences, delve deeper into the analysis, showcasing relevant metrics and statistical tests.

Non-Technical Audience: Focus on visual aids like clear charts and infographics. Emphasise the story behind the data and its practical implications.

Focus on the “So What”: Do not Just Present the Data; Explain its Impact

Highlight the “So What” Factor: Clearly articulate the implications of your findings – “This sales decline indicates a need to shift marketing strategies towards…”

Actionable Recommendations: Do not leave stakeholders hanging. Provide clear, actionable recommendations based on your insights, empowering them to take concrete steps.

By prioritising clear communication and focusing on the “so what” factor, you can transform your data insights from cryptic numbers into a compelling story that drives action and fuels business success.

Data Analysis and Interpretation in Finance (Financial Analysis)

Now that we have learnt how to interpret insights from data analysis, let us explore how these come in handy when it is related to financial decisions, one of the crucial categories of business decisions that determine the future of an organisation. Financial analysis and interpretation are fundamental skills in finance. They are used to turn raw financial data into actionable insights that can be used to make informed decisions. This financial data can come from a variety of sources, including:

  • Financial statements: These include the income statement, balance sheet, and cash flow statement. They provide a comprehensive overview of a company’s financial health.
  • Market data: This includes stock prices, interest rates, and economic indicators. It can be used to assess the overall health of the economy and identify investment opportunities.
  • Internal data: This includes sales data, customer data, and operational data. It can be used to identify trends and improve efficiency.

The financial analysis process typically involves the following steps:

  1. Data collection: This involves gathering the data from the relevant sources.
  2. Data cleaning: This involves ensuring that the data is accurate and complete.
  3. Data transformation: This may involve formatting the data or converting it into a different format.
  4. Data analysis: This involves using statistical methods to identify trends and patterns in the data.
  5. Data interpretation: This involves explaining the meaning of the data and its implications for financial decisions.

There are a number of different techniques that can be used to analyse and interpret financial data, such as:

  1. Ratio analysis: This involves calculating ratios from financial statement data to assess a company’s profitability, liquidity, and solvency.
  2. Trend analysis: This involves identifying trends in financial data over time.
  3. Regression analysis: This is a statistical technique that can be used to model the relationship between two or more variables.
  4. Discounted cash flow analysis: This is a technique that is used to value companies based on the present value of their future cash flows.

Data analysis and interpretation are essential skills for a variety of financial professionals, including:

  • Investment analysts: These professionals use data analysis to identify undervalued or overvalued stocks.
  • Credit analysts: These professionals use data analysis to assess the creditworthiness of borrowers.
  • Financial planners: These professionals use data analysis to develop financial plans for their clients.
  • Risk managers: These professionals use data analysis to identify and manage financial risks.

By using data analysis and interpretation, financial professionals can make more informed decisions that can lead to better financial outcomes. If you wish to learn financial analysis and interpretation, you can enrol in a comprehensive financial analysis course such as the Postgraduate Financial Analysis Program by Imarticus.

Building a Culture of Data-Driven Decisions: From Insights to Impact

Data analysis is a powerful tool, but its true potential is unleashed when it becomes ingrained in an organisation’s DNA. Fostering a culture of data-driven decisions empowers everyone, from frontline employees to senior leadership, to leverage data for informed choices.

Here is how to cultivate this data-savvy environment:

  • Data Literacy for All: Invest in training programs that equip employees at all levels with the skills to understand and interpret data. This empowers them to make data-informed decisions within their roles.
  • Democratise Data Access: Break down data silos and provide user-friendly tools that allow employees to access and explore relevant data independently. This fosters a sense of ownership and encourages data exploration.
  • Lead by Example: Senior leadership needs to champion data-driven decision-making. When leaders base their choices on data insights, it sends a powerful message throughout the organisation.

Data Analysis and Interpretation in Research

We are heavily dependent on data analysis and interpretation in research projects, especially when we are digging for insights from the heart of any research project. Here is a breakdown of the process:

Data Analysis

This is where we take the raw data we collected through surveys, experiments, interviews, etc., and organise it in a way that makes sense. We might use statistical software to calculate things like means, medians, and correlations. We might also create charts and graphs to visualise trends and patterns in our data.

Data Interpretation

Once we have our analysed data, it is time to make sense of it all. This is where we connect the dots and explain what our findings mean in the context of our research question.

We might ask ourselves questions like:

  • Do my findings support my research hypothesis?
  • What are the implications of these findings for the real world?
  • Are there any alternative explanations for my results?

Here are some key things to keep in mind during data analysis and interpretation:

  • Be aware of limitations: No research study is perfect. There might be limitations in your data collection methods or sample size. Consider these limitations when interpreting your findings.
  • Do not force the data: The data should tell its own story. Do not try to manipulate it to fit a specific conclusion.
  • Be transparent: Explain your methods clearly and honestly. This allows readers to evaluate the strength of your findings.

Finally, always remember that data analysis and interpretation are iterative processes. You might need to go back and forth between them a few times before you reach a clear understanding of your data. By following the above steps, we can transform our raw data into valuable insights that contribute to our field of research.

Wrapping Up

Do not wait and become a data evangelist within your organisation. Advocate for data literacy initiatives, promote data-driven discussions, and celebrate successes achieved through data-informed decisions. By working together, you can transform your company into a powerhouse of data-driven decision-making, propelling it towards a future of informed growth and success.

If you wish to learn data analysis and interpretation for finance, you can enrol in the Postgraduate Financial Analysis Program by Imarticus Learning. This financial analysis course will teach you everything you know to become an expert in the analysis and interpretation of financial data for strategic financial decisions as well as business decisions.

Frequently Asked Questions

What is the data analysis and interpretation meaning and why are data analysis frameworks important?

The data analysis and interpretation meaning is that this system provides a structured approach to translating insights from data into actionable business decisions. Data analysis frameworks help ensure a logical process and avoid overlooking crucial steps, leading to more effective decision-making.

How can bias skew data analysis results?

Biases, like focusing only on positive customer reviews (confirmation bias) or surveying just a specific demographic (selection bias), can distort data and lead to misleading conclusions.

What are some tips for communicating data insights to stakeholders?

Tailor your message to the audience’s technical background.

Focus on the “so what” factor – explain the implications of the findings and how they translate to actionable recommendations.

Use clear visuals and avoid jargon to ensure everyone understands the data’s story.

How can I promote a data-driven culture within my organisation?

  • Advocate for data literacy training programs for all employees.
  • Encourage data exploration by providing user-friendly data access tools.
  • Lead by example and demonstrate the value of data-driven decision-making in your own actions.

Financial Ratio Analysis: Calculating Financial Ratios for Investments

Financial ratios are one of the key tools of investment analysis.

They act as powerful tools that condense complex financial data from a company’s balance sheet, income statement, and cash flow statement into clear, concise metrics. Financial ratio analysis empowers investors and investment firms to become active participants in the market, making informed decisions based on data-driven insights.

Types of Ratios in Financial Analysis

These financial ratio analysis metrics provide investors with a deeper understanding of a company’s financial health across various aspects:

  • Liquidity: Liquidity ratios reveal a company’s ability to meet its short-term obligations. They indicate if a company has sufficient cash flow to cover upcoming expenses.
  • Profitability: Profitability ratios assess a company’s efficiency in generating profits. They reveal how effectively a company uses its resources to translate sales into earnings.
  • Solvency: Solvency ratios evaluate a company’s ability to manage its long-term debt burden. These ratios are crucial for understanding a company’s financial risk profile.
  • Efficiency: Efficiency ratios provide insights into how well a company manages its assets and generates sales. These metrics can reveal operational strengths and weaknesses.

By analysing these key ratios, investors and firms can move beyond face-value financial data and make informed decisions. Now that we know what is ratio analysis, let us learn about why financial ratio analysis is essential. Comparing a company’s ratios to industry benchmarks and its own historical performance allows for:

  • Identifying Potential Red Flags: Unusual fluctuations or consistently low ratios compared to the industry average might indicate underlying financial issues.
  • Uncovering Undervalued Gems: Strong ratios across categories can signal a company with solid fundamentals that might be undervalued by the market.
  • Building a Winning Portfolio: By incorporating financial ratio analysis into your investment strategy, you can select companies with strong financial health and growth potential.

Financial Statements: Our Data Source

Financial ratio analysis unlocks valuable information, but where do you find the raw data? Look no further than a company’s financial statements, the official reports detailing its financial health. Three key statements provide the foundation for ratio calculations:

Balance Sheet

This snapshot at a specific date shows a company’s assets (what it owns), liabilities (what it owes), and shareholders’ equity (the difference between assets and liabilities). It essentially tells you the company’s net worth. Look for line items like cash, inventory, accounts receivable (money owed by customers), accounts payable (money owed to suppliers), and shareholders’ equity.

Income Statement

This report summarises a company’s financial performance over a specific period (quarter or year). It details revenue (money earned from sales), expenses (costs incurred), and net income (profit earned after expenses). You will find data points like sales revenue, cost of goods sold, operating expenses, and net income.

Cash Flow Statement

This statement tracks the movement of cash within a company over a period. It categorises cash flow from operating activities (generating revenue), investing activities (acquiring or selling assets), and financing activities (issuing debt or equity). Look for lines like net cash flow from operating activities and net cash flow from financing activities.

If you are new to financial statements, the Securities and Exchange Commission (SEC) offers a beginner’s guide. The Ministry of Corporate Affairs (MCA) of the Government of India also offers a learning module on “Presentation of Financial Statements” which provides a basic understanding of these documents. However, if you wish to become an expert in financial analysis and if you are looking for a career in finance, it is recommended that you enrol in a comprehensive course such as the Postgraduate Financial Analysis Program.

Beyond the Numbers: Context

Financial ratio analysis is a powerful tool, but it does not exist in a vacuum. To make sound investment decisions, we need to interpret financial ratios in context. Here is why:

  • Industry Benchmarks: A seemingly low current ratio for a retail company might be perfectly normal compared to the industry average for wholesalers with slower inventory turnover.
  • Company History: Track a company’s ratios over time. A declining gross margin could indicate rising costs or weakening pricing power, requiring further investigation.
  • Future Outlook: Consider a company’s projected growth trajectory. A high debt-to-equity ratio might be justifiable for a rapidly growing company with the potential to generate significant future earnings.

External factors can also influence financial ratio analysis. A recession might lower profitability ratios across industries, while new regulations could impact a company’s efficiency ratios. By considering these contextual factors alongside the raw numbers, you can gain a more in-depth understanding of a company’s financial health and make informed investment decisions based on a holistic analysis.

Building Your Investment Strategy with Financial Ratio Analysis

Here is how financial ratio analysis empowers your investment strategy:

  • Undervalued Gems: Companies with strong ratios across categories, particularly profitability and efficiency, might be trading below their intrinsic value. Ratio analysis can help you uncover potential diamonds in the rough.
  • Growth Potential: A company with consistently rising profitability ratios and improving efficiency ratios might be poised for future growth. Ratios can provide clues about a company’s ability to generate sustainable profits.
  • Investment Comparison: Analysing ratios of different companies within the same industry allows you to compare their financial health, risk profiles, and growth prospects. This data-driven approach can guide you in selecting the most promising investment options.

We should always remember that financial ratio analysis is a valuable tool, but not the only one. We can always consider incorporating other investment analysis techniques like fundamental analysis and technical analysis to build a comprehensive investment strategy.

Pro Tips for Mastering Financial Ratio Analysis

Unleash the full potential of financial ratio analysis with these actionable tips:

Tip 1: Build Your Ratio Arsenal: Create a financial ratio spreadsheet. Include formulas for key ratios from each category (liquidity, profitability, solvency, efficiency) for easy calculation and comparison across companies. Track historical trends for a company’s ratios to identify potential red flags or areas of improvement.

Tip 2: Leverage Online Tools: Numerous online financial ratio analysis tools can streamline the process. These tools often provide pre-calculated ratios for publicly traded companies, saving you valuable time and effort.

Tip 3: Don’t Go Solo: Financial ratios are powerful, but they can’t tell the whole story. Enrol in a solid investment banking program for personalised investment guidance. Learning from professionals in an extensive financial analysis course such as the Postgraduate Financial Analysis Program can help you interpret ratios in context and consider other investment factors such as risk tolerance for investors and companies. This program will teach you many other essential financial analysis concepts as well.

Wrapping Up

Financial ratios are like a financial compass, guiding you towards informed investment decisions. By understanding key ratio categories, interpreting them in context, and incorporating them into your investment strategy, you can navigate the market with greater confidence. Remember, financial ratios are a powerful tool, but use them alongside other analysis techniques and seek professional guidance for a well-rounded investment approach.

If you are looking for a career in finance, you can enrol in the Postgraduate Financial Analysis Program by Imarticus Learning. This program is for finance graduates with 0-3 years of work experience and this holistic program will teach you everything you need to know about financial analysis.

Frequently Asked Questions

What are financial ratios and why are they important?

Financial ratios are calculations that condense complex financial data into easy-to-understand metrics. They help investors assess a company’s financial health, profitability, and risk profile, enabling informed investment decisions.

Where do I find the data to calculate financial ratios?

The data you need comes from a company’s financial statements: balance sheet, income statement, and cash flow statement. These statements detail a company’s assets, liabilities, revenue, expenses, and cash flow.

What are some key types of ratios to focus on?

Focus on ratios that assess liquidity (ability to meet short-term obligations), profitability (efficiency in generating profits), solvency (ability to manage debt), and efficiency (how well a company manages its assets and generates sales).

What is ratio analysis?

Financial ratio analysis is a method used to assess a company’s financial health by comparing different financial data points from its financial statements. By calculating ratios, investors and analysts can gain insights into a company’s financial health.

Essentials of NumPy: Using NumPy for Linear Algebra Operations

Linear algebra, though often associated with advanced mathematics, is a surprisingly versatile branch that underpins numerous applications across diverse fields. From solving complex physics simulations to powering machine learning algorithms, linear algebra plays a crucial role.

Let us first learn about what is NumPy in brief and then we will explore how we can use the numpy.linalg module for various linear algebra operations with NumPy.

What is NumPy?

NumPy stands for Numerical Python and it is the foundation for scientific computing in the Python programming language. It empowers us programmers with powerful tools to manipulate and analyse numerical data. But NumPy’s capabilities extend far beyond simple calculations. One of its most valuable assets is the NumPy Linear Algebra module (numpy.linalg). This module provides an extensive suite of functions specifically designed for linear algebra operations, making NumPy a one-stop shop for various scientific and engineering tasks.

Benefits of Using Python NumPy

Now that we have covered what is NumPy, let us learn why we use this library. NumPy’s linear algebra toolbox empowers you to tackle a wide range of scientific and engineering challenges efficiently and elegantly. By harnessing this powerful module, you can unlock a new level of problem-solving capabilities in Python.

By leveraging NumPy’s linear algebra capabilities, you can:

  • Effortlessly perform common operations: Tasks like matrix multiplication, finding eigenvalues and eigenvectors, and solving systems of equations become streamlined with NumPy’s optimised functions.
  • Boost efficiency: NumPy utilises optimised code written in C or Fortran, significantly accelerating computations compared to pure Python implementations.
  • Enhance code readability: NumPy’s intuitive functions and array-based approach make your code more concise and easier to understand, both for yourself and others.
  • Seamless integration: NumPy integrates seamlessly with other scientific Python libraries like SciPy and scikit-learn, allowing you to build powerful workflows for complex data analysis and modelling tasks.

Getting Started with NumPy’s Linear Algebra Module (numpy.linalg)

Equipping yourself with NumPy’s linear algebra module is a breeze. Let us learn how to import it and explore some fundamental operations:

Importing the Module

The first step is to import the numpy.linalg module. You can achieve this in two ways:

import numpy as np

linalg = np.linalg  # Assigning a shorter alias

This approach imports the entire NumPy library (numpy) and assigns the linalg submodule to a shorter variable for convenience. Alternatively, you can directly import the linalg module:

from numpy import linalg

Creating Vectors and Matrices

A NumPy array is the workhorse of NumPy, and these arrays can be effortlessly transformed into vectors and matrices. Here is how:

  • Vectors: A one-dimensional NumPy array represents a vector. You can create a vector using square brackets []:
vector = np.array([1, 2, 3])

print(vector)  # Output: [1 2 3]

Matrices: A two-dimensional NumPy array represents a matrix. You can create a matrix by nesting lists within square brackets:

matrix = np.array([[1, 2, 3], [4, 5, 6]])

print(matrix) 

# Output: [[1 2 3]

#        [4 5 6]]

Common Linear Algebra Operations

Now that you have vectors and matrices, let us explore some essential operations:

  • Matrix Multiplication: NumPy offers an intuitive operator (@) for matrix multiplication. Here is an example:
A = np.array([[1, 2], [3, 4]])

B = np.array([[5, 6], [7, 8]])

product = A @ B

print(product)  # Output: [[19 22], [43 50]]

Element-wise Operations: NumPy performs operations element-wise between arrays of the same shape. Here is adding two matrices:

C = A + B

print(C)  # Output: [[ 6  8], [11 12]]

  • Transposing Matrices: The .T attribute transposes a matrix, swapping rows and columns. Here is an example:
transposed_A = A.T

print(transposed_A)  # Output: [[1 3], [2 4]]

Linear Regression with NumPy

Linear regression, a cornerstone of machine learning, thrives on the power of linear algebra. NumPy, with its efficient array manipulations, becomes a natural choice for implementing linear regression. Here is how:

Matrix Approach to Linear Regression

At its core, linear regression finds the best-fitting line through a set of data points. This line can be expressed as:

y = mx + b

where:

  • y is the dependent variable (what we’re trying to predict)
  • x is the independent variable (what we’re basing our prediction on)
  • m is the slope of the line
  • b is the y-intercept

We can represent this equation using matrices in NumPy. Let us say we have data points (x, y) stored in separate NumPy arrays. We can create a design matrix (X) that combines these:

X = np.vstack([x, np.ones(len(x))]).T  # vstack for stacking arrays vertically

This creates a matrix where each row represents a data point (x, 1). The 1 in each row accounts for the bias term (b). Now, the coefficients (m and b) can be found using the matrix equation:

theta = np.linalg.inv(X.T @ X) @ (X.T @ y)

where:

theta is a vector containing the coefficients ([m, b])

Example:

import numpy as np

# Sample data

x = np.array([1, 2, 3, 4])

y = np.array([2, 4, 5, 4])

# Design matrix

X = np.vstack([x, np.ones(len(x))]).T

# Calculate coefficients

theta = np.linalg.inv(X.T @ X) @ (X.T @ y)

# Print coefficients

print(“Slope (m):”, theta[0])

print(“Y-intercept (b):”, theta[1])

Compilation:

This code calculates the slope (m) and y-intercept (b) using matrix operations and NumPy functions.

Prediction with the Model

Once you have the coefficients, you can use them to predict new y values for unseen x values. Here is how:

new_x = 5  # Example input for prediction

predicted_y = theta[0] * new_x + theta[1]

print(“Predicted y for x =”, new_x, “:”, predicted_y)

NumPy and Advanced Linear Algebra Libraries

While NumPy’s linalg module provides a solid foundation, for even more advanced linear algebra tasks, you can leverage the power of libraries like SciPy and scikit-learn. These libraries seamlessly integrate with Python NumPy, building upon its capabilities:

  • SciPy: Offers advanced functions for linear algebra tasks like solving complex systems of equations, finding eigenvalues and eigenvectors for larger matrices, and performing matrix decompositions (LU decomposition, Cholesky decomposition). These functionalities extend beyond NumPy’s core offerings.
  • scikit-learn: While scikit-learn doesn’t directly focus on linear algebra, it extensively utilises NumPy arrays and linear algebra operations under the hood. Its linear regression implementation (LinearRegression class) leverages NumPy’s matrix operations for efficient calculations, making scikit-learn a popular choice for machine learning tasks involving linear regression.

If you wish to learn advanced Python applications for data science or data analytics, you can enrol in a holistic data science course such as the Postgraduate Program in Data Science and Analytics by Imarticus.

Applications of NumPy Linear Algebra

NumPy’s linear algebra capabilities transcend theoretical concepts, finding applications in various real-world domains:

  • Physics Simulations: Simulating complex physical systems often involves solving systems of differential equations. NumPy’s linear algebra functions are instrumental in efficiently representing physical relationships as matrices and performing calculations to model dynamic systems, like simulating planetary motion or fluid flow.
  • Machine Learning: Linear algebra forms the bedrock of many machine learning algorithms. From solving linear regression problems (as we saw earlier) to performing dimensionality reduction techniques like Principal Component Analysis (PCA), Python NumPy empowers you to manipulate data matrices and extract meaningful insights for tasks like image recognition, recommendation systems, and natural language processing.
  • Data Analysis: In data analysis, linear algebra plays a crucial role in tasks like data cleaning and transformation. NumPy’s matrix operations enable efficient outlier detection, data imputation (filling missing values), and normalisation (scaling data to a common range). Additionally, techniques like Singular Value Decomposition (SVD) can be used with NumPy’s linear algebra module to uncover hidden patterns and relationships within large datasets.
  • Signal Processing: Filtering and analysing signals, like audio data or financial time series, often rely on linear algebra techniques. NumPy’s matrix operations can be used to implement various filters (e.g., moving average filters) and perform Fast Fourier Transforms (FFTs) to analyse the frequency content of signals, aiding tasks like noise removal and anomaly detection.
  • Computer Graphics: Linear algebra is ubiquitous in computer graphics. From transforming 3D objects in virtual scenes to applying lighting effects, NumPy’s functionalities become essential for manipulating rotation matrices, translation vectors, and performing perspective projections to render realistic images and animations.

These are just a few examples, highlighting the versatility of NumPy’s linear algebra toolbox. As you dive deeper into scientific computing and data analysis, you will encounter even more applications where NumPy’s efficient linear algebra operations become the driving force behind powerful solutions.

Final Tips

NumPy streamlines complex linear algebra tasks like matrix multiplication, solving systems of equations, and finding eigenvalues. It also offers efficiency with optimised code under the hood translating to faster computations compared to pure Python implementations. NumPy’s intuitive functions and array-based approach make your code more concise and easier to understand.

Also, Python NumPy integrates seamlessly with other scientific Python libraries, empowering you to build robust workflows for data analysis and modelling. By leveraging NumPy’s linear algebra capabilities, you can tackle a wide range of scientific and engineering challenges with elegance and efficiency. However, this is just the beginning of your exploration. You can learn more advanced functionalities within numpy.linalg such as matrix decompositions and work with complex matrices.

I would also recommend that you experiment with SciPy and scikit-learn to unlock even more powerful tools for linear algebra and machine learning tasks. You should practice your newfound skills by applying NumPy’s linear algebra to real-world problems in your field of interest.

If you wish to learn various Python libraries such as NumPy for advanced data analytics or other data science applications, you can enrol in Imarticus Learning’s Postgraduate Program in Data Science and Analytics. This extensive data science course also offers new career prospects with a 100% placement guarantee.

Frequently Asked Questions

What advanced linear algebra features does NumPy offer?

NumPy goes beyond multiplication and equations. Explore features like:

  • Matrix Decompositions (LU, Cholesky): Solve complex systems and perform inversions more efficiently.
  • Eigenvalues & Eigenvectors: Analyse dynamical systems and perform dimensionality reduction (PCA).

How do NumPy, SciPy, and scikit-learn work together?

NumPy is the foundation, providing efficient array manipulation and core linear algebra functions. SciPy builds on NumPy, offering advanced functionalities like complex equation solving and specialised decompositions. Finally, scikit-learn leverages NumPy arrays and linear algebra for high-level machine learning algorithms (e.g., linear regression).

I’m working on a Python project with linear algebra tasks. NumPy seems like a clear winner for speed compared to pure Python, but code readability can take a hit. Is there a way to strike a balance between speed and readability when using NumPy’s linear algebra functions? Maybe some best practices or techniques I can employ?

NumPy offers a significant speed boost compared to pure Python for linear algebra tasks, but readability can sometimes suffer due to concise syntax. Here are some strategies to achieve a balance:

  • Meaningful Variable Names: Use descriptive variable names that clearly convey the purpose of your NumPy arrays and matrices. This enhances code readability without sacrificing efficiency.
  • Comments: Add comments to explain complex operations or non-intuitive code sections. This improves understanding for yourself and others who might revisit your code.
  • Break Down Complex Functions: For very intricate calculations using multiple NumPy functions, consider breaking them down into smaller, well-commented steps. This improves readability and makes debugging easier.

Remember, readability can be just as important as speed. Finding the right balance depends on your specific project requirements. If readability is paramount, consider adding comments or explanations even if it adds a few lines of code.

How does NumPy’s linear algebra translate to real-world applications?

Here are some real-world examples:

  • Physics Simulations: When modelling planetary motion, NumPy handles the complex equations behind it.
  • Machine Learning: Recommending movies? NumPy helps analyse user data for personalised suggestions.

Mutable and Immutable in Python: Understanding the Difference Between Mutable and Immutable Data Types and When to Use Them

Let us assume that you and your partner meticulously craft a digital teachers list for a school database. But, a disaster strikes. While you are adding the names, your partner accidentally deletes the maths teacher’s name you painstakingly typed in earlier. Frustration ensues. This everyday scenario underscores the importance of data mutability in Python.

In essence, mutability refers to whether a data type’s content can be changed after creation. In our shopping list example, if the list were “immutable” (changeable), your partner would not be able to remove “Maths” from the “Subjects” list.

Python offers both mutable and immutable (unchangeable) data types. Mastering this distinction is crucial for writing efficient, maintainable, and bug-free Python code. Let us explore the world of mutable and immutable in Python and understand when to use each for optimal results.

Core Concepts of Mutable and Immutable Data Types in Python

Python provides a rich set of data types, categorised into two key groups based on their ability to be modified: mutable and immutable. Understanding what is mutable and immutable in Python is fundamental for writing effective Python code. Let us learn about the various data types that are mutable and immutable in Python.

Mutable Data Types

These data types allow you to change their content after creation. They are ideal when you need to dynamically modify your data:

  1. Lists: Lists are ordered collections of elements enclosed inside square brackets []. You can add, remove, or modify elements at any point using indexing (accessing elements by position) or slicing (extracting a sub-list). Their flexibility makes them perfect for dynamic data like shopping lists, user profiles (with name, age, etc.), or storing website configurations that may change frequently.
  2. Dictionaries: Dictionaries store key-value pairs enclosed within curly braces {}. You can access, add, or modify values using their corresponding keys. This makes them ideal for storing user information (key: username, value: email), product details (key: product ID, value: price), or any scenario where data is associated with unique identifiers.
  3. Sets: A set can be defined as an unordered collection of elements enclosed inside curly braces {}. You can add or remove elements, but duplicates are automatically discarded. Sets are excellent for representing unique items like product IDs in a shopping cart or finding common interests among friends.

Immutable Data Types

These data types cannot be modified after creation. They offer benefits like data integrity and thread safety:

  1. Strings: They represent sequences of characters enclosed in single () or double () quotes. While methods like replace or upper seem to modify a string, they actually create a new string. Strings are fundamental for storing text data, user input, or error messages.
  2. Integers, Floats, and Booleans: These represent whole numbers (int), decimal numbers (float), and True/False values (bool), respectively. Once assigned a value, these cannot be changed. They are commonly used for numerical calculations, logical operations, and storing boolean flags.
  3. Tuples: Tuples are ordered, fixed-length collections of elements enclosed in parentheses (). Once created, you cannot modify their elements. Tuples are useful for representing data that should not change, like coordinates ((x, y)) or product combinations ((size, colour)) in an e-commerce store.

By learning how to make data mutable and immutable in Python, you can develop your Python applications in a controlled manner and prevent programming errors.

When to Choose Between Mutable and Immutable in Python

Now that we are aware of what is mutable and immutable in Python, let us learn about how to choose between the two. The choice between mutable and immutable in Python hinges on several factors:

Clarity and Immutability

Favour immutability (strings, tuples) for data integrity and clarity. Since they cannot be changed, you can reason about their state more confidently. This is especially important for shared data in multithreaded applications, where unexpected modifications can lead to bugs. Immutable objects act like “snapshots” that other threads cannot accidentally alter.

Immutability fosters thread safety. In multithreaded environments, multiple threads might access the same data simultaneously. With mutable data, this can lead to race conditions (where the outcome depends on thread execution order). Immutable data sidesteps this issue as each thread works with a fixed copy.

Performance Considerations

Immutable types can be faster to create and compare. Since no modification happens, creating new immutable objects is often quicker. Additionally, comparing immutable objects for equality is simpler as their content remains constant.

Mutable types offer in-place modifications. When you need to frequently modify data, mutable types can be more efficient. By allowing in-place changes, they let us avoid the need to create new objects entirely. However, this benefit comes at the cost of potential thread safety concerns.

Data Integrity and Safety

Protect shared data with immutability. In multithreaded applications, immutability safeguards data integrity. Since immutable objects cannot be modified, other threads cannot accidentally corrupt the data. This is crucial for ensuring predictable behaviour in concurrent programming scenarios.

Functional Programming Style

Functional programming leans towards immutability. Functional programming emphasises pure functions (functions with no side effects). Using immutable data types aligns with this philosophy, as functions always return a new, modified result without altering the original data. This makes reasoning about functions and their behaviour more straightforward.

If you wish to learn various Python programming, you can enrol in a solid data science course.

Advanced Concepts Related to Mutable and Immutable Data Types in Python

1. Immutability in Custom Classes

While Python offers several immutable data types, you can also design your own immutable classes. Here are two key techniques:

  1. __slots__: This attribute restricts what attributes a class can have, preventing accidental modifications after creation.
  2. Returning new instances: When modifications are needed, create a new instance with the updated data instead of changing the existing object.

2. Copying vs. Referencing

When dealing with mutable objects, understanding copying is crucial. Python passes references by default, meaning you’re working with the object’s memory location. Here’s the distinction between copying methods:

  • copy.copy: Creates a shallow copy, replicating the top-level structure but leaving mutable references within the object unchanged. Ideal for simple modifications where you don’t want to alter the original object entirely.
  • copy.deepcopy: Creates a deep copy, recursively copying all elements within the object, including nested mutable objects. Use this when you need a completely independent copy of the data.

3. Data Persistence and Immutability

Immutability can simplify data persistence (storing data for later retrieval). Version control systems (like Git) become more efficient as changes create new versions instead of modifying existing ones. This allows for easier tracking of historical data and simplifies rollbacks if necessary.

By venturing into these advanced concepts of mutable and immutable data types in Python, you’ll gain a deeper understanding of data manipulation in Python and unlock the full potential of immutability in your projects.

Wrapping Up

In summary, prioritise immutable data types (strings, tuples) for clarity, data integrity, and thread safety. If performance is critical and extensive in-place modifications are required, mutable types (lists, dictionaries, sets) might be a better choice.

However, exercise caution in multithreaded environments to avoid potential race conditions. By carefully considering these factors, you can select the most appropriate data type for your Python projects, enhancing code maintainability, efficiency, and robustness. 

If you wish to learn various Python programming and its applications in data analytics and data science, you can enrol in Imarticus Learning’s Postgraduate Program in Data Science and Analytics. This extensive data science course will teach you everything you need to know about Python.

Frequently Asked Questions

When should I use a mutable data type (list, dictionary, set) over an immutable one (string, tuple)?

Use mutable types when you need to frequently modify the data itself. This is ideal for scenarios like shopping lists (adding/removing items), user profiles (updating information), or website configurations that change often.

Why is immutability important for data integrity and thread safety?

Immutable data types (strings, tuples) cannot be changed after creation. This ensures that the data remains consistent, preventing accidental modifications by other parts of your code or even in multithreaded applications. It acts like a “snapshot” that cannot be corrupted by other threads.

Are immutable data types always faster than mutable ones?

Not necessarily. While immutable types are often quicker to create and compare due to their fixed nature, mutable types can offer performance benefits for frequent in-place modifications. However, in multithreaded environments, the safety benefits of immutability usually outweigh the potential performance gains of mutable types.

How can I create an immutable custom class in Python?

You can design custom classes to be immutable using two key techniques:

  • __slots__: This attribute restricts the class’s allowed attributes, preventing accidental additions after creation.
  • Returning new instances: When modifications are needed, create a new object with the updated data instead of changing the existing one.

What is the Fixed Exchange Rate System? Why is it Important?

Let us assume that we are an Indian company that imports exotic fruits from Thailand. We need to pay Thai Baht for our purchases, but our income is in Indian Rupees or INR. This is where exchange rates come in. They act as the conversion bridges between different currencies, allowing international trade to flow smoothly.

Exchange rates constantly fluctuate based on supply and demand for each currency. However, some countries choose to implement a fixed exchange rate system. This means their currency’s value is pegged to another stable currency, a basket of currencies, or even a commodity such as gold. In contrast, most countries today operate under a floating exchange rate system, where several key market forces determine the currency’s value.

Let us dive in and learn all about the fixed exchange rate system.

Mechanics of the Fixed Exchange Rate System

The fixed exchange rate system functions through the central bank’s active role in managing the exchange rate between the domestic currency and its chosen peg (another currency, basket of currencies, or commodity).

The central bank selects a reference point for the domestic currency. This could be a single strong currency like the US Dollar or a basket of currencies representing important trading partners. The central bank fundamentally acts like a stabiliser, ensuring the exchange rate stays balanced at the predetermined level. They achieve this through two primary tools:

  • Foreign Currency Intervention: When there is high demand for foreign currency (causing the domestic currency to depreciate), the central bank sells foreign currency from its reserves and buys back its own currency. This injects domestic currency into the market, raising its value artificially and pushing it back towards the peg. Conversely, if the domestic currency becomes too strong (appreciates), the central bank can buy foreign currency and sell its own, weakening the domestic currency.
  • Intervention Bands: In some cases, countries might establish a narrow band around the fixed rate. This allows for slight fluctuations within the band due to market forces. However, the central bank intervenes aggressively to prevent the rate from straying too far outside the band.

Pegging a Currency (Balancing Act by the Central Bank)

Now that we have covered “what is fixed exchange rate”, let us find out how the fixed exchange rates truly work. A fixed exchange rate system functions by pegging the value of a domestic currency to another currency (or a basket of currencies) at a predetermined exchange rate. This peg acts as a fixed point representing the desired balance between the two currencies. The central bank plays a critical role in maintaining this balance. Here is how they achieve it:

Buying and Selling Foreign Currency

The central bank acts as the person in the middle, constantly adjusting the weights on the seesaw. When there is high demand for foreign currency (causing the domestic currency to weaken), the central bank sells foreign currency from its reserves and buys back its own currency. This injects domestic currency into the market, artificially raising its value and pushing it back towards the peg (restoring balance on the seesaw). Conversely, if the domestic currency becomes too strong (appreciates), the central bank can buy foreign currency and sell its own, weakening the domestic currency.

Intervention Bands

In some cases, countries might establish a narrow band around the fixed rate. This allows for slight fluctuations within the band due to market forces, but the central bank intervenes more aggressively when the rate strays too far outside the band (we will cover this in more detail in the later sections).

Benefits of a Fixed Exchange Rate System

The fixed exchange rate system offers several advantages, particularly for countries prioritising stability and predictability in their economies. Here’s a breakdown of some key benefits:

Predictability for International Trade

Businesses engaged in international trade thrive on knowing the exact costs involved. A fixed exchange rate eliminates the uncertainty associated with fluctuating currency values. Companies can confidently plan their imports and exports without worrying about sudden shifts in exchange rates that could erode their profits. This predictability fosters a more stable business environment and encourages international trade.

Reduced Currency Fluctuations

Businesses and investors appreciate the reduced volatility associated with fixed exchange rates. Budgeting and long-term planning become more manageable when currency fluctuations are minimised. This fosters a more stable financial environment for both domestic and international actors.

Lower Transaction Costs

When exchange rates constantly fluctuate, businesses often need to hedge their bets by entering into complex financial contracts to mitigate potential losses. A fixed exchange rate system eliminates this need, leading to lower transaction costs for businesses involved in international trade.

Attracting Foreign Investment

Investors generally prefer to put their money in stable and predictable economies. A fixed exchange rate system can signal such stability, potentially attracting foreign direct investment. This influx of capital can boost economic growth and development.

Controlling Inflation

Pegging the domestic currency to a stable currency with a low inflation rate can indirectly help control inflation in the domestic economy. We will explore this concept in more detail in the later sections of this article.

Challenges of a Fixed Exchange Rate System

While offering stability, fixed exchange rate systems also come with significant challenges. Here is a closer look at some of the potential drawbacks:

Loss of Monetary Policy Independence

One of the biggest drawbacks is the limitation on a central bank’s ability to conduct independent monetary policy. In a fixed exchange rate system, the central bank’s primary focus becomes maintaining the peg. This can restrict their ability to use interest rates as a tool to manage domestic economic issues.

Example: Let us take a country with a fixed exchange rate experiencing high unemployment as an example. Traditionally, the central bank could lower interest rates to stimulate borrowing and investment, potentially leading to job creation. However, in a fixed exchange rate system, lowering interest rates could make the domestic currency less attractive compared to the pegged currency. This could lead to investors pulling their money out, weakening the domestic currency and putting pressure on the peg. To maintain the peg, the central bank might be forced to keep interest rates high, even if it hinders efforts to address domestic unemployment.

Defending the Peg Can Be Expensive

Maintaining a fixed exchange rate can be a costly endeavour. When there is strong demand for foreign currency (putting downward pressure on the domestic currency), the central bank needs to sell foreign currency from its reserves and buy its own currency to maintain the peg. This depletes their foreign exchange reserves. Additionally, if the central bank needs to raise interest rates to defend the peg (as in the previous example), it can discourage foreign investment, further straining reserves.

Limited Flexibility in Turbulent Times

Fixed exchange rates can make it difficult for economies to adapt to external shocks. For instance, a sudden surge in global oil prices could put pressure on a country’s current account if it relies heavily on oil imports. In a floating exchange rate system, the currency would likely depreciate, making exports cheaper and imports more expensive, helping to restore balance. However, with a fixed exchange rate, such an adjustment wouldn’t be possible, potentially hindering the economy’s ability to adapt to the external shock.

Vulnerability to Currency Crises

Speculative attacks can pose a serious threat to fixed exchange rate systems. If investors lose confidence in a country’s ability to maintain the peg, they might start selling the domestic currency in large quantities, anticipating a devaluation. This creates a self-fulfilling prophecy as the increased selling pressure weakens the currency further. If the central bank doesn’t have sufficient reserves or the firepower to raise interest rates enough to defend the peg, it might be forced to devalue the currency.

Historical Example: The 1997 Asian Financial Crisis offers a stark example of a currency crisis in a fixed exchange rate system. Several Southeast Asian countries with pegged currencies were hit by speculative attacks as investors lost confidence in their ability to maintain the peg. The central banks’ reserves were depleted, and they were eventually forced to devalue their currencies, leading to significant economic turmoil.

Fixed Exchange Rates Through Time and Variation

Historical Perspective

The Gold Standard was a historical example of a fixed exchange rate system that dominated the late 19th and early 20th centuries. Under this system, the value of a country’s currency was directly linked to a specific amount of gold. This created a sense of stability and predictability in international trade.

Advantages:

  • Stability: The Gold Standard promoted stable exchange rates, facilitating international trade.
  • Discipline: Countries were incentivised to maintain sound fiscal policies to avoid devaluing their currency.

Limitations:

  • Limited Flexibility: Economies couldn’t adjust interest rates or currency values to respond to domestic economic conditions.
  • Vulnerability to Deflation: Gold discoveries could lead to deflationary pressures as the money supply grew slower than the economy.
  • Breakdown in Wartime: The system collapsed during World War I as countries abandoned the gold standard to finance war expenditures.

Modern Variations

The classic fixed exchange rate system has evolved to include variations that offer some flexibility:

  • Currency Boards: These are essentially fixed exchange rate systems with stricter rules. A country with a currency board is legally obligated to maintain a fixed exchange rate with a reserve currency, typically by backing its domestic currency with full reserves in the foreign currency.
  • Managed Floats: This system allows for a certain degree of fluctuation around a central rate. The central bank intervenes in the foreign exchange market to keep the exchange rate within a predefined band, but it has more flexibility compared to a classic fixed rate system.

The Future of Fixed Rates

Economists continue to debate the viability of fixed exchange rates in the globalised world. Some argue that the system has become outdated and inflexible in a world of volatile capital flows. Others believe that fixed exchange rates can still promote stability and growth, particularly for developing economies.

Factors that might influence future adoption include:

  • Rise of Regional Economic Blocs: Increased economic integration within regions could lead to the adoption of fixed exchange rates among member countries.
  • Technological Advancements: Developments in financial markets and central bank intervention tools could potentially make fixed exchange rates more manageable.

The future of fixed exchange rates remains uncertain, but understanding their history, variations, and ongoing debate will be crucial for navigating the complexities of the global financial landscape. If you want to know more, you can enrol in solid banking courses such as an investment banking programme.

Real-World Examples: Fixed Exchange Rate in Action

Fixed exchange rates have not become relics of the past. Here are some successful implementations:

  • Hong Kong: Hong Kong’s Dollar has been pegged to the US Dollar since 1983. This peg has fostered a stable and predictable environment, making Hong Kong a global financial hub. The strong link to the US Dollar also inspires confidence in foreign investors, attracting capital and promoting economic growth.
  • Singapore: Singapore utilises a managed float system, allowing for some flexibility around a fixed rate with the Singapore Dollar. This approach has helped maintain exchange rate stability while providing some room for the central bank to respond to specific economic situations. Singapore’s success story highlights the potential benefits of a well-managed, hybrid approach.

Challenges of Abandoning Fixed Rates

The Asian Financial Crisis of 1997 serves as a stark reminder of the potential pitfalls of abandoning fixed exchange rates prematurely. Several Southeast Asian countries with pegged currencies faced speculative attacks from investors who doubted their ability to maintain the peg. As we discussed already in this article, central banks’ reserves were depleted, and they were ultimately forced to devalue their currencies. This devaluation triggered a domino effect, leading to:

  • Currency Depreciation: The devalued currencies became cheaper, making imports more expensive and exports less competitive. This hampered economic activity.
  • Capital Flight: Investors, fearing further devaluation, pulled their money out of the region, further straining financial systems.
  • Debt Burden: Companies and countries with foreign currency debt saw their debt burden increase significantly due to the devaluation.

The Asian Financial Crisis underscores the importance of careful planning and strong fundamentals before abandoning fixed exchange rates. Countries need to have sufficient reserves and a credible commitment to economic reforms to weather potential storms.

Fixed or Float?

The world of exchange rates can be complex, but understanding the fixed exchange rate system is a crucial step towards navigating this terrain. A fixed exchange rate pegs a domestic currency to another currency, a basket of currencies, or even a commodity like gold. This system offers stability and predictability for international trade and investment. 

However, it comes with limitations like reduced monetary policy independence and vulnerability to external shocks. Modern variations like currency boards and managed floats offer some flexibility within the fixed exchange rate framework.

The choice between a fixed and floating exchange rate system depends on a country’s specific circumstances. Developing economies might prioritise the stability offered by fixed rates, while larger, more developed economies may opt for the flexibility of floating rates.

Wrapping Up

The future of fixed exchange rates remains an open debate, with factors like regional economic integration and technological advancements potentially influencing future adoption. Ultimately, understanding the benefits and drawbacks of fixed exchange rates empowers countries to make informed decisions about their currency regimes, fostering a more stable and prosperous global financial landscape.

If you are looking for solid banking courses that can take your career to the next level, you can opt for the Certified Investment Banking Operations Professional programme by Imarticus Learning. This is one of the most holistic investment banking courses out there that will teach you everything you need to know about investment banking, global finance and other advanced financial concepts.

Frequently Asked Questions

What is a fixed exchange rate system?

A fixed exchange rate system pegs a country’s currency to another currency, a basket of currencies, or even a commodity like gold. This creates a stable exchange rate, making international trade more predictable.

What are the advantages of a fixed exchange rate system?

Fixed exchange rates offer predictability for businesses involved in international trade, lower transaction costs, and can attract foreign investment by signalling stability. Additionally, pegging to a stable currency with low inflation can help control domestic inflation.

What are the disadvantages of a fixed exchange rate system?

A major drawback is the loss of monetary policy independence for the central bank. They may be unable to adjust interest rates to address domestic economic issues if it conflicts with maintaining the peg. Defending the peg can also be expensive, and fixed rates can make it difficult for economies to adapt to external shocks.

Are fixed exchange rates still used today?

Yes, although less common than floating exchange rates. Some countries such as Hong Kong, have successfully implemented fixed exchange rates, while others, like those in the 1997 Asian Financial Crisis, faced challenges after abandoning fixed rates. The choice between fixed and floating depends on a country’s specific economic circumstances.

The Beginner’s Guide to Money and the Banking System: History and Concepts

It is hard to think of a world without coins or bills. Our journey through the history of money begins long before the clinking of metal or the rustle of paper.

The earliest form of exchange was not money at all, but a system of barter. This method of exchange was simple trades such as farmers trading baskets of wheat for a blacksmith’s tools or a skilled weaver exchanging a length of cloth for a basket of fish.

Barter systems, though seemingly basic, laid the foundation for the concept of value exchange. Let us learn more about money and banking, the building blocks of finance and economics.

What is Money and Banking?

Over time, societies transitioned from bulky and inconvenient goods to more standardised forms of currency. Commodity money emerged, where objects with inherent value, like salt bars or cattle, became the medium of exchange. These commodities were not only useful but also relatively scarce and easy to transport, making them a more practical alternative to bartering a basket of apples for a new pair of sandals.

The next step in our evolution was the rise of representative money. Think of a society where instead of lugging around cumbersome sacks of salt, people use tokens or coins representing a specific amount of salt stored in a secure location. These tokens, often made of precious metals like gold or silver, held their value because they were backed by a real commodity. Gold and silver coins became the dominant form of currency for centuries, not only for their inherent value but also for their durability and divisibility (easily broken down into smaller units for transactions).

Fast forward to the modern era and we encounter a new concept, the fiat currency. Unlike commodity or representative money, fiat currency has no inherent value. These government-issued bills and coins derive their value solely from the trust and legal backing of the issuing authority. The rise of fiat currency allowed governments to exert greater control over their economies and facilitated easier trade and financial transactions.

Introduction to Money and Banking Concepts

Money is not just a cold, hard object. Throughout history, different cultures have developed unique and fascinating forms of currency that reflect their values and resources. Pacific island cultures used intricately carved shells (wampum) as a form of payment, while ancient Chinese civilisations employed salt bars shaped like knives. These diverse forms of currency offer a glimpse into the historical ingenuity and cultural significance of money beyond its function as a medium of exchange.

Banks: The Foundations of Modern Economies

Think of a world where your extra cash sits under your mattress, and borrowing money to buy a house or start a business is nearly impossible. This might have been the reality for our ancestors, but today, banks play a vital role in keeping our economies humming. Let us delve into the core functions that make banks the power behind the purse.

At their heart, banks serve three critical functions:

  1. Depositors’ Haven: People entrust their money to banks by opening savings or checking accounts. These deposits act as a safe and accessible way to store your hard-earned cash.
  2. Lending Powerhouse: Banks do not just store money, they put it to work. By granting loans to individuals and businesses, banks act as a bridge between those with surplus funds (depositors) and those who need capital for investment or growth. Loan repayments, along with interest, allow banks to generate profit.
  3. Payment Facilitator: Gone are the days of lugging around sacks of gold. Banks provide a secure and efficient system for transferring funds electronically, allowing you to pay bills, send money to friends, or make online purchases with a few clicks.

But the world of banking is not a one-size-fits-all operation. Different types of banks cater to specific needs:

  • Commercial Banks: These are the institutions you are most familiar with, offering everyday banking services like checking and savings accounts, debit cards, and consumer loans.
  • Investment Banks: These financial powerhouses deal in larger transactions, helping businesses raise capital through stock offerings or mergers and acquisitions. They also manage investment portfolios for wealthy individuals and institutions.
  • Central Banks: Acting as the backbone of a nation’s financial system, central banks set monetary policy, regulate commercial banks, and issue the national currency.

A Historical Look at Banking’s Evolution

The concept of banking has a rich and fascinating history. Early money changers, operating centuries ago, exchanged currencies and offered safekeeping services for valuables. These rudimentary institutions laid the foundation for the modern banking system. Over time, banks played a pivotal role in financing major historical events. From funding wars and exploration voyages to fueling the Industrial Revolution, banks have been instrumental in shaping the economic landscape throughout history.

But how do banks create the money they lend? This is where the concept of fractional reserve banking comes in. Banks do not lend out every single dollar deposited. Instead, they keep a portion (reserve requirement) on hand to meet client withdrawals and lend out the remaining amount. This allows banks to create credit in the economy, essentially multiplying the money supply and stimulating economic activity. However, fractional-reserve banking is a complex concept with its own set of regulations and potential risks. These are essential concepts of money and banking.

Demystifying Money

Financial literacy empowers us to take control of our money and navigate the exciting, yet sometimes complex, world of personal finance. After being able to control your own money, you will be able to manage your client’s money even better as a banker. Let us break down some essential concepts to equip individuals for financial success:

Income: The Foundation

Our income is the money we earn. It can come from various sources, including:

  • Salary: A fixed amount of money you receive for your work, typically paid bi-weekly or monthly.
  • Wages: An hourly rate of pay, often seen in part-time or freelance jobs.
  • Investments: Earnings generated from our investments in stocks, bonds, or real estate.
  • Net Income: Our Take-Home Pay

Understanding our net income is crucial. This is the amount of money we actually have available to spend after taxes and other deductions are withheld from our gross income (total earnings). Knowing our net income is essential for creating a realistic budget.

Expenses: Where Does Our Money Go?

Expenses are the costs we incur to maintain our lifestyle. Categorising our expenses helps us track our spending habits and identify areas for potential savings. Here is a basic breakdown:

  • Fixed Expenses: These expenses remain relatively constant each month, such as rent/mortgage, utilities, car payments, and minimum debt payments.
  • Variable Expenses: These expenses can fluctuate each month, including groceries, transportation (beyond car payments), entertainment, and dining out.

Budgeting: The Roadmap to Financial Freedom

A budget is our financial roadmap. It helps us allocate our net income towards our expenses and savings goals. By creating a budget, we gain control over our money and avoid wasteful spending. There are various budgeting methods, from the traditional 50/30/20 rule (50% needs, 30% wants, 20% savings) to more flexible approaches.

Savings: For the Future

Saving is essential for achieving our financial goals, whether it is a down payment on a house, a dream vacation, or a secure retirement. Here are some popular savings vehicles:

  • Savings Accounts: Offer easy access to our money with a modest interest rate.
  • Certificates of Deposit (CDs): We commit our money for a fixed term in exchange for a higher interest rate.
  • Retirement Accounts: These accounts offer tax advantages for saving specifically for retirement.

Debt: A Double-Edged Sword

Debt is not inherently bad. Used responsibly, it can help us finance major purchases like a house or education. However, it is crucial to differentiate between good debt and bad debt:

  • Good Debt: Debt used for investments that appreciate in value over time, like a mortgage or student loan for a high-demand field.
  • Bad Debt: Debt used for depreciating assets or unnecessary expenses, like credit card debt with high-interest rates.

Demystifying Money Management: Equipping Yourself for Client Success

The world of money and banking thrives on a fundamental principle, understanding your client’s financial needs. As you embark on your career in money and banking, you must grasp these essential concepts of personal finance, equipping you to effectively serve and empower your clients.

Beyond the Basics: Deepening Your Financial Expertise

As you navigate the ever-evolving world of money and banking, here are some additional areas to explore and strengthen your financial knowledge:

  • Investing Basics: Equipping yourself with a solid understanding of investment vehicles (stocks, bonds, mutual funds) is crucial. Learn how these instruments work, their risk-reward profiles, and how to develop sound investment strategies for your clients with varying risk tolerances and long-term goals.
  • The Power of Interest Rates: Interest rates significantly impact both borrowing and saving decisions. Master the concept of simple and compound interest, and how fluctuations in interest rates affect loan payments, savings account yields, and overall investment returns.
  • The Global Financial Ecosystem: The world of finance transcends borders. Gain a basic understanding of international trade, foreign exchange (currency exchange rates), and the role of global financial institutions like the International Monetary Fund (IMF) and the World Bank. This knowledge can be invaluable when advising clients involved in international transactions or managing global investment portfolios.
  • Building Financial Literacy Champions: Empowering your clients requires readily available resources. Curate a list of reputable websites, books, or financial literacy programs you can recommend to clients seeking to deepen their understanding of personal finance management.

By delving into these additional areas of money and banking, you will not only enhance your professional expertise but also position yourself as a trusted financial partner, capable of guiding your clients towards achieving their financial goals with confidence and a well-rounded understanding of the financial landscape.

A Journey Through the Client’s Mind: Income, Expenses, and Budgeting

Understanding Income Sources: Your clients come from diverse backgrounds with varying income streams. Grasp the concept of salary, wages, and investment income to better understand their financial footing.

Categorising Expenses: Clients incur fixed expenses (rent, utilities) and variable expenses (groceries, entertainment). This knowledge allows you to tailor financial products and services to their specific needs.

The Power of Budgeting: A cornerstone of financial literacy, budgeting empowers clients to allocate income towards expenses and savings goals. Being familiar with budgeting methods equips you to guide clients in creating a personalised financial roadmap.

Financial Tools in Your Arsenal: Accounts, Cards, and Debt Management

  • Account Options: Checking and savings accounts serve different purposes. Understanding the pros and cons of each empowers you to advise clients on selecting the right fit for their needs.
  • The Power of Plastic: Debit cards offer immediate access to funds, while credit cards provide a line of credit. Educate clients on responsible credit card use and strategies for managing debt effectively.
  • Savings Vehicles: From traditional savings accounts to certificates of deposit (CDs) and retirement accounts, understanding various savings options allows you to recommend the most suitable vehicles for your client’s goals.

Tailoring Solutions for Different Life Stages

  • Young Adults: Financial independence beckons. Equipping young adults with budgeting tools and knowledge on building emergency funds positions you as a trusted advisor.
  • Mid-Career Professionals: Debt repayment, retirement planning, and potentially saving for children’s education become priorities. Understanding these life-stage challenges allows you to offer targeted financial products and guidance.
  • Pre-Retirees: Retirement planning takes centre stage. Advise clients on diversifying investment portfolios, reviewing retirement income sources, and adjusting spending plans for a secure future.

The Rise of Digital Banking and Fintech

Online banking and mobile banking apps are the new normal. Familiarise yourself with these platforms to guide clients and troubleshoot any challenges they might encounter. Also, fintech companies offer innovative solutions like mobile payments and peer-to-peer lending. Stay informed about these trends to stay ahead of the curve and potentially integrate these services into your client offerings.

The Key to Success: Building Trust and Communication

By demystifying personal finance as well as money and banking for your clients, you build trust and establish yourself as a valuable resource. Effective communication is paramount and you should explain financial concepts in clear, jargon-free language. Actively listen to your clients’ concerns and tailor your advice to their unique financial landscape.

Remember, you are not just selling products and services, you are empowering your clients to achieve their financial goals. By becoming a financial literacy champion, you will foster successful relationships and contribute to the overall well-being of your clients.

Wrapping Up

In this article, we explored the fascinating history of money and banking, the vital role banks play in the economy, and the core financial concepts that underpin personal finance management. By understanding these elements, you can help your clients make informed financial decisions and achieve their financial goals.

Financial literacy is the cornerstone of financial well-being. As a banker, you have the opportunity to be a champion for financial literacy, guiding your clients on their financial journeys. Consider enrolling in a dedicated investment banking course to further hone your expertise and stay ahead of the curve in the ever-evolving world of finance.

Remember, the success of your clients is your success. By fostering a culture of financial literacy and offering tailored financial solutions, you will contribute to a more secure financial future for both your clients and your institution.

If you are looking for solid investment banking courses that can take your career to the next level, you can enrol in Imarticus Learning’s Certified Investment Banking Operations Professional programme by Imarticus Learning. This is one of the most comprehensive investment banking courses out there that will teach you all the essential finance and banking concepts.

Frequently Asked Questions

How can I better understand my clients’ financial needs?

Grasp core personal finance concepts (income, expenses, budgeting) and tailor your advice to their life stage (young adult, mid-career, pre-retiree).

What are the key financial tools I should be familiar with?

Understand checking and savings accounts, debit and credit cards, and various savings vehicles (CDs, IRAs) to recommend the best fit for each client’s needs.

How can I stay relevant in the digital age of banking?

Become well-versed in online and mobile banking platforms and emerging Fintech solutions like mobile payments and peer-to-peer lending.

What is money and banking?

Money is the widely accepted medium of exchange we use to buy goods and services. It makes trade easier than bartering directly. Banks are institutions that deal with money. They accept deposits from people and lend out that money to borrowers, acting as intermediaries between savers and spenders. This system helps keep money flowing through the economy. This is just the introduction to money and banking and there are many more things behind these two essential components of economics and finance.