


Last updated on September 26th, 2026 at 01:37 am
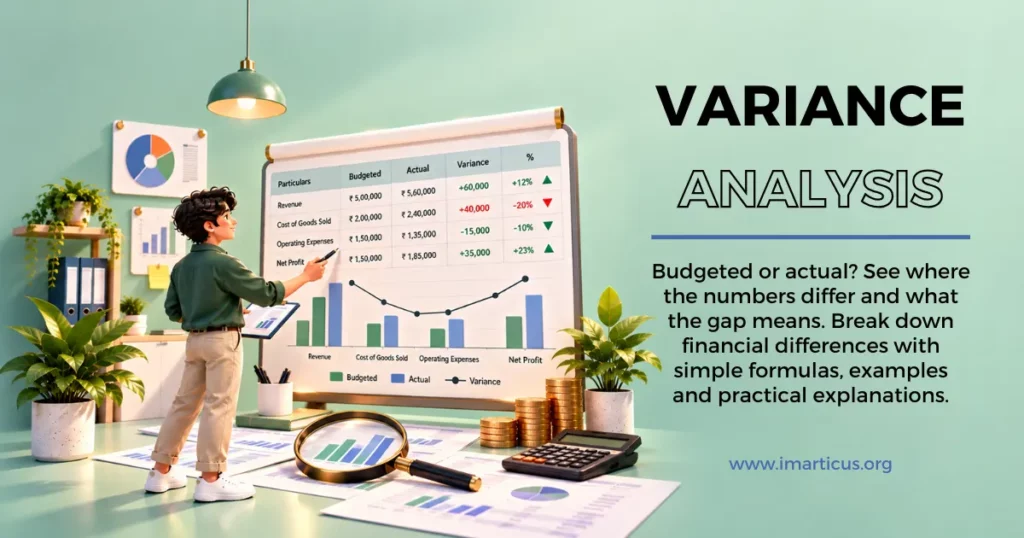
Variance analysis is the process of comparing actual financial or operational results with budgeted, planned, or standard results to identify and explain the difference. It helps businesses determine whether a variance is caused by changes in price, quantity, volume, efficiency, revenue, or other factors. For example, if a company budgets ₹10 lakh for materials but actually spends ₹11.5 lakh, the ₹1.5 lakh difference is a variance; the analysis then investigates whether it resulted from higher material prices, increased usage, production changes, or an inaccurate budget.
In management accounting, variance analysis is used to monitor performance, control costs, evaluate budgets and identify areas that require corrective action. A variance should not be viewed in isolation: management needs to understand what caused the difference, whether it is favourable or unfavourable, and whether the underlying budget or standard remains realistic.
A budget can be perfectly prepared and still tell you very little about what actually happened. The interesting part begins when the actual numbers refuse to match it. That gap is where variance analysis earns its place. A business may budget ₹20 lakh for raw materials and end up spending ₹23 lakh. On paper, that is a ₹3 lakh difference. But what caused it? Did supplier prices rise? Did production use more material than expected? Did output increase? Was the original standard simply unrealistic? One figure can have several stories behind it.
I find that this is where variance analysis in accounting becomes much more useful than memorising a set of formulas. The calculation tells you the size of the difference. The investigation tells you whether the difference matters. The same thinking carries into variance analysis in finance, variance analysis in cost accounting and management accounting. A favourable cost variance may even deserve a closer look if it came from cheaper materials that affected quality. So, is every favourable variance actually favourable? Is every adverse variance a warning sign? Those are the questions worth asking.
I would approach this topic with one simple rule: never stop at the variance itself. Look at the assumption behind the number, the activity that produced it and the reason for the movement. That way, standard costing and variance analysis become practical tools for reading business performance rather than just exam topics. It is also the kind of financial thinking that becomes useful across accounting, FP&A, banking and other areas covered by professional finance courses.
Don’t Let Our Best Advice Get Buried
Add Imarticus as a Preferred Source — see more of what we publish, every time you search.

What Is Variance Analysis?
So, what is variance analysis? I would keep the definition simple. It is a way of comparing an actual result with a planned or expected result. The planned figure could come from a budget, forecast or standard cost. The actual figure is what the business really recorded. The gap between the two is the variance.
Say you plan to spend ₹10,000 on travel for a quarter. You spend ₹11,500 instead. Your variance is ₹1,500.
That number gives you a useful starting point. You still need to ask why the ₹1,500 appeared. Maybe travel costs went up. Maybe more employees travelled. Maybe a new project required extra visits. Each reason points to a different business action. This is the simplest way to understand the meaning of variance analysis. You compare what you expected with what happened, then investigate the gap.
IBM describes the process in a similar way. It places variance analysis within financial planning and analysis and explains that teams can compare actual figures with a forecast or other benchmark.
Variance Analysis Meaning In Simple Terms
I find it easier to understand the idea through a household example.
Suppose you set aside ₹300 for your monthly electricity and gas bills. Your actual bills come to ₹360. You have a ₹60 difference. You now have several possible questions.
- Did energy prices rise?
- Did you use more power?
- Was there an unusually cold week?
- Was one bill carried over from the previous month?
The calculation tells you the size of the gap. The investigation tells you what the gap means. The same logic applies when you look at a company’s sales, costs, wages or operating expenses.
Variance Analysis In Accounting
In variance analysis in accounting, the benchmark often comes from a budget or standard cost. You may compare actual material costs with standard material costs. You may compare actual labour costs with the amount allowed in the budget. You may also compare actual sales with planned sales. The purpose is to make changes easier to spot. A useful review normally asks:
- What figure did I expect to see for the period under review?
- What figure did I actually record for the same period?
- How large is the difference in money and percentage terms?
- What business activity caused the difference to appear?
- Does the difference need action or can I treat it as normal movement?
Why Is Variance Analysis Important?
I would group the value into a few practical areas.
- You can spot unusual changes before they become harder to explain or control.
- You can improve future budgets by using actual results to test earlier assumptions.
- You can improve forecasts when repeated differences show that an estimate needs changing.
- You can study costs in more detail instead of treating every increase as one problem.
- You can give managers clearer information about where attention may be needed.
- You can link financial results with operational activity across different parts of a business.
This makes variance analysis useful for more than monthly reporting. It can improve the quality of the next financial plan.
How Does Variance Analysis Work?
I would break the process into a few clear steps. You first need a fair benchmark. Then you need reliable actual figures. Once you have both, the calculation is easy. The harder part begins after the calculation. You need to understand why the result moved. A finance team may need information from sales, purchasing, operations or payroll before it can explain a large variance.
Setting The Right Benchmark
The benchmark matters more than it may first appear. Suppose a retailer compares December sales with the average sales of January. The calculation will work perfectly. The result may still tell you very little because the two months have very different trading patterns.
You should choose a comparison that fits the question. You could compare:
- Actual sales with the approved sales budget for the same period.
- Actual spending with the approved cost budget for the same period.
- Actual costs with a standard cost for the same product or service.
- Actual results with the latest forecast when planning has changed.
- Current results with the same period from an earlier year when a trend matters.
Finding The Cause Behind The Number
This is where variance analysis becomes useful for real financial decisions.
Imagine a company spends ₹20,000 more on materials than planned. I would not treat that ₹20,000 as one single problem.
I would ask whether suppliers increased prices. I would check whether production increased. I would look for waste. I would also check whether the budget used an outdated price. One number can have several causes.
Did You Know?
A favourable variance can still signal an operational problem. Cheaper materials may reduce purchase costs while increasing usage or creating production issues. (Source)
Variance Analysis Formula
The basic variance analysis formula is simple:
Variance = Actual Result − Budgeted or Standard Result
You can also calculate the percentage difference:
Variance Percentage = (Actual Result − Budgeted or Standard Result) ÷ Budgeted or Standard Result × 100
Suppose your planned cost is ₹50,000 and your actual cost is ₹55,000.
Variance = ₹55,000 − ₹50,000 = ₹5,000
Variance Percentage = ₹5,000 ÷ ₹50,000 × 100 = 10%
The business has spent ₹5,000 more than planned. That is a 10% difference.
Favourable And Unfavourable Variance
You also need to decide what the difference means. For revenue, earning more than planned will usually be favourable. For costs, spending more than planned will usually be unfavourable. The same positive number can therefore have different meanings.
| Area | Planned | Actual | Variance | Usual Reading |
| Sales | ₹100,000 | ₹110,000 | ₹10,000 | Favourable |
| Rent | ₹20,000 | ₹18,000 | ₹2,000 | Favourable |
| Wages | ₹40,000 | ₹45,000 | ₹5,000 | Unfavourable |
| Service income | ₹30,000 | ₹27,000 | ₹3,000 | Unfavourable |
| Materials | ₹60,000 | ₹55,000 | ₹5,000 | Favourable |
I would always read the label alongside the account. A higher revenue figure and a higher expense figure do not carry the same meaning.
Also Read: What is capital expenditure and why does it matter to a business?
Types Of Variance Analysis
The types of variance analysis you use depend on what you want to understand. A sales team may care about revenue and volume. A factory may need material, labour and overhead figures. A finance team may focus on the full income statement. Some common areas include:
- Revenue variance shows how actual income differs from the amount planned for a given period.
- Sales variance helps explain changes in selling price, sales volume and product mix.
- Cost variance analysis shows where actual spending has moved away from a planned or standard cost.
- Material variance helps explain changes in the price and quantity of materials used.
- Labour variance shows how actual labour cost differs from the expected labour cost.
- Overhead variance looks at indirect costs such as utilities, support costs and factory expenses.
- Volume variance shows how a change in activity level affects the expected result.
- Efficiency variance helps show whether resources were used in line with the expected level.
These categories can overlap. A single business may use several of them in the same monthly report.
Cost Variance Analysis
Cost variance analysis becomes useful when the total cost figure hides the reason for the change.
Imagine a restaurant expects to spend ₹30,000 on ingredients. It spends ₹34,000. The first question is simple: why?
Perhaps food prices increased. Perhaps the restaurant served more customers. Perhaps food waste increased. Each answer needs a different response. This is why I would avoid stopping at the total variance.
Material Variance
Material variance is common in manufacturing and production settings. Suppose a company expects to use 2,000 kg of material at ₹4 per kg. Its standard cost is ₹8,000.
- Actual usage comes to 2,100 kg at ₹4.50 per kg.
- The actual cost is ₹9,450.
The total difference is therefore:
₹9,450 − ₹8,000 = ₹1,450
That ₹1,450 contains two separate movements. The business paid a higher price per kilogram and also used more material.
| Cost Factor | Standard | Actual | What I Would Check |
| Material price | ₹4/kg | ₹4.50/kg | Supplier price changes |
| Material quantity | 2,000 kg | 2,100 kg | Usage and waste |
| Labour rate | ₹15/hour | ₹16/hour | Pay rates and staffing |
| Labour hours | 3,000 | 3,200 | Production time |
| Overhead per unit | ₹10 | ₹11.50 | Indirect cost movement |
The table shows why standard costing and variance analysis work well together. The standard gives you a clear reference point. The variance shows where actual activity moved away from it. Once you separate the movement into smaller causes, the figures become much easier to act on.
Interesting Insight → IBM states that variance analysis can be applied at different levels of financial information, including individual line items and the three major financial statements.
Variance Analysis In Cost Accounting
Variance analysis in cost accounting often starts with standard costing. You set an expected cost for an input and compare it with what you actually paid or used. I would think of the standard as a measuring stick.
If the standard says that one product should use 5 kg of material and actual usage is 5.5 kg, you have a usage difference. If the standard price is ₹6 and you pay ₹6.50, you also have a price difference. You can then study each movement on its own.
Standard Costing And Variance Analysis
Standard costing and variance analysis work together because one gives you the expected figure and the other shows the gap. This can help you study:
- Material price changes that affect the amount paid for each unit of input.
- Material usage changes that show whether more or less input was used than expected.
- Labour rate changes that affect the hourly cost of employees or contractors.
- Labour efficiency changes that affect the hours needed to complete a task.
- Overhead changes that affect indirect costs linked to production or operations.
The value comes from knowing what to investigate next. A ₹10,000 cost variance may look serious. If production rose by 25% during the same period, the story changes. You still need to check the numbers, but the reason becomes clearer.
Variance Analysis In Management Accounting
Variance analysis in management accounting gives managers a way to study business performance against a plan. A monthly report may show ten large movements. You do not need to spend the same amount of time on all ten. This is where materiality matters.
A ₹200 difference may have little effect on a company with a large budget. A ₹200 difference can matter a lot to a small business. You can therefore set a threshold. Once a variance crosses that level, you investigate it in more detail.
The Association for Financial Professionals discusses management by exception and the use of material variances to direct attention towards areas that may need action.
Variance Analysis In Finance And FP&A
Variance analysis in finance is used across budgets, forecasts and financial reports. You may compare:
- Actual vs budget
- Actual vs forecast
- Actual vs previous period
- Actual vs standard
Each comparison gives you a different view.
| Comparison | Question I Am Asking | Example | Main Use |
| Actual vs budget | Did we meet the original plan? | ₹540k vs ₹500k | Budget review |
| Actual vs forecast | Was the latest estimate accurate? | ₹540k vs ₹520k | Forecast review |
| Actual vs prior period | How has performance changed? | ₹540k vs ₹500k | Trend review |
| Actual vs standard | Did activity match the expected cost? | ₹9 vs ₹8 per unit | Cost control |
| Actual vs target | Did we reach the agreed goal? | 91% vs 95% | Performance review |
The benchmark changes the question. I would always state the benchmark clearly before discussing the result.
What Is Variance Analysis In Finance?
What is variance analysis in finance when you look beyond a single cost line? It can cover revenue, operating costs, profit, cash flow and financial statement movements. IBM notes that teams can apply the method to the balance sheet, income statement and cash flow statement. That makes the method useful for FP&A teams that need to explain why results moved from the plan.
Also Read: How does accrual basis of accounting record revenue and expenses?
How To Conduct Variance Analysis Step By Step
The calculation takes very little time. The review around it deserves more care.
Step 1: Choose The Benchmark
I would first decide what the actual result should be compared with. Use the approved budget when reviewing budget performance. Use the latest forecast when reviewing forecast accuracy. Use a standard cost when studying production efficiency.
Step 2: Check The Actual Figures
Make sure the data covers the right period. Look for missing entries, unusual transactions and incorrect account codes. A reporting error can create a variance that has nothing to do with business performance.
Step 3: Calculate The Variance
Use the relevant variance analysis formula. For a simple comparison, subtract the planned figure from the actual figure. Add the percentage when it helps you judge the size of the movement.
Step 4: Decide What The Result Means
Classify the movement as favourable or unfavourable based on the account. Do not label every positive number as favourable. The nature of the figure matters.
Step 5: Break The Result Down
Look at price, volume, efficiency, mix and timing where those factors apply. A ₹50,000 revenue gap may come from fewer sales. It may also come from lower prices. Those two causes require very different responses.
Step 6: Check Materiality
Set a sensible level for investigation. This helps you focus attention on differences that can affect decisions.
Step 7: Find The Root Cause
Use supporting records and speak with the relevant business team where needed. The reason may sit in sales, purchasing, payroll, operations or another area.
Step 8: Record The Action
Write down what happened and what needs to happen next. You may need to update the forecast. You may need to review a supplier. You may decide that no action is needed.
Variance Analysis Example
Suppose you run an online store and set a monthly sales budget of ₹100,000.
- Your actual sales reach ₹108,000.
- You also budget ₹60,000 for operating costs but spend ₹66,000.
Your figures look like this:
| Measure | Budget | Actual | Difference |
| Sales | ₹100,000 | ₹108,000 | ₹8,000 |
| Operating costs | ₹60,000 | ₹66,000 | ₹6,000 |
| Planned profit | ₹40,000 | ₹42,000 | ₹2,000 |
| Sales percentage | 100% | 108% | 8% |
| Cost percentage | 100% | 110% | 10% |
The sales result is ₹8,000 above budget. The cost result is ₹6,000 above budget. The profit result is ₹2,000 above budget. You still need to ask why.
- Maybe the company increased advertising spend. That could explain both the higher costs and the higher sales.
- If the extra sales came from a one-off promotion, the next forecast should take that into account.
This is why variance analysis should lead to a business explanation rather than stop at a calculation.
Variance Analysis Example Using Standard Costing
Now take a production example. You expect to make 500 units. Each unit should use 2 kg of material at ₹5 per kg. Your standard material cost is:
500 × 2 kg × ₹5 = ₹5,000
You actually use 1,100 kg at ₹5.40 per kg.
Your actual cost is:
1,100 × ₹5.40 = ₹5,940
Your total material cost difference is:
₹5,940 − ₹5,000 = ₹940
There are two clear movements.
You used 100 kg more material than expected. You also paid 40p more per kilogram.
| Measure | Standard | Actual | Difference |
| Units produced | 500 | 500 | 0 |
| Material per unit | 2 kg | 2.2 kg | 0.2 kg |
| Total material | 1,000 kg | 1,100 kg | 100 kg |
| Price per kg | ₹5 | ₹5.40 | ₹0.40 |
| Total material cost | ₹5,000 | ₹5,940 | ₹940 |
Now you have a better question to answer. Was the extra ₹440 linked to the higher material price? Was the remaining movement caused by higher usage? Did waste increase?
The exact formula used for each variance depends on the costing method and convention. The important part is to define the formula before you use it and apply it consistently.
Try Variance Analysis On Your Numbers
Enter your planned and actual figures to see the variance, its percentage and what the movement could mean.
How To Interpret Variances And Find Root Causes
I would look at the business activity behind the number before deciding what the number means. Suppose wages are ₹15,000 above budget. That could happen because:
- More people worked during the period than expected.
- Employees worked more hours than planned.
- Hourly pay rates increased.
- Overtime was higher than expected.
- The business used more expensive specialist staff.
The total cost figure alone cannot tell you which reason applies. The same point applies to revenue.
A ₹100,000 revenue gap could come from more customers, higher prices, a change in product mix or a timing difference. This is why a useful variance review should separate the main drivers.
Also Read: What are the types of accounting used in a business?
Limitations Of Variance Analysis
Variance analysis has a simple weakness. The result is only as useful as the benchmark behind it. Suppose your budget assumes that a product will cost ₹10 to make. A supplier then raises the price to ₹12 because of a major market change.
The resulting variance is real. The original budget may still have been reasonable when it was created. Timing can also affect the result. A large invoice may arrive in April instead of March. March then looks better, and April looks worse, even though the underlying annual cost has not changed. You should also watch for these issues:
- An unrealistic budget can create large variances that say little about actual performance.
- A one-off event can make one month look very different from normal trading.
- Poor data can create false movements that need correction before review.
- Small differences can consume too much management time when they have little financial effect.
- A favourable cost result can hide lower quality or reduced service levels in some situations.
- External events can change demand, prices or supply in ways that were difficult to predict.
The calculation still matters. You simply need enough context to read it properly.
Variance Analysis Best Practices
I would keep the process practical.
| Practice | What To Do | Why It Matters |
| Set a threshold | Decide which movements need review | Keeps attention focused |
| Use a fair benchmark | Match the benchmark to the question | Improves the quality of the comparison |
| Break down large gaps | Study price, volume and other drivers | Makes causes easier to find |
| Track repeated movements | Review the same line over time | Helps identify patterns |
| Assign responsibility | Give someone ownership of action | Makes follow-up clearer |
| Update the forecast | Carry useful findings into future plans | Improves future estimates |
The aim is simple. Each review should help you understand the business a little better.
Also Read: What is quantitative finance used for?
Variance Analysis Vs Analysis Of Variance (ANOVA)
The phrase analysis of variance can cause confusion because it belongs to statistics, while variance analysis is widely used in accounting and finance. The two subjects should be kept separate.
- Variance analysis looks at the difference between actual and expected financial or operating results.
- Analysis of variance in statistics, usually called ANOVA, is a statistical method used to study differences between group means.
IBM describes one-way ANOVA as a method for comparing the means of two or more groups.
What Is Analysis Of Variance?
What is analysis of variance when you are working with statistics? Imagine you want to compare the average test scores of three groups. Each group used a different study method.
You could calculate the average for each group. You could then use ANOVA to test whether the differences between those group means are statistically meaningful. That is a statistical question. It has a different purpose from finance-based variance analysis.
Analysis Of Variance In Statistics
Analysis of variance in statistics looks at variation within groups and between groups. The idea can sound difficult at first. I would think of it as a way of checking whether the difference between several group averages is large enough to matter statistically. The method is useful in research, business analytics and other areas where you need to compare groups.
ANOVA: Analysis Of Variance
The terms anova, analysis of variance and analysis of variance anova refer to the same statistical method. You may also see the phrase analysis of variance (ANOVA). These terms should not be mixed into the accounting definition of variance analysis. They belong to a different statistical topic.
Also Read: How does general ledger accounting help prepare financial statements?
How Variance Analysis Fits Into Modern Finance
Finance work now reaches well beyond preparing accounts. You may need to read a dashboard, review a forecast, question a cost movement or explain a change to someone who does not work in finance. The basic habit remains useful.
Start with the number. Check the benchmark. Find the difference. Then ask what caused it. That is also why I would learn variance analysis alongside other finance skills rather than treating it as an isolated accounting topic. A broader finance path can include:
- Financial analysis can help you understand company performance and turn financial data into useful business information.
- CFA study can build knowledge around investment analysis, valuation and portfolio management.
- Retail and commercial banking can help you understand lending, customers, bank products and business finance.
- FinTech can connect finance knowledge with payments, lending, digital platforms and financial technology.
- Risk management can help you understand credit, market, liquidity and other financial risks.
These areas serve different career interests. You can explore them based on the type of finance work you want to do.
Also Read: What are the rules for GST reconciliation?
Why Choose Imarticus Learning for Building a Career in Finance?
Variance analysis is one part of finance. The same skill can lead you into financial analysis, investment banking, banking, FinTech or risk management. That is where Imarticus Learning's finance courses become relevant. It has programmes built around different areas of finance, so you can pick a path based on the kind of work you want to move towards. A few details on the finance portfolio are worth noting:
- 15+ finance programmes covering areas such as investment banking, global accounting and finance, financial planning and analysis, retail and commercial banking, FinTech and risk management.
- Programmes built with industry and academic partners, including collaborations with KPMG in India, IIM Lucknow, IIM Calcutta, IIM Indore and ISB across its finance portfolio.
- Global certification programmes covering ACCA, US CMA, CFA, US CPA and FRM, alongside specialised finance programmes.
- 100% job assurance on selected programmes, supported by Imarticus' career services.
- 3,500+ companies hiring from Imarticus learners, giving the placement support a direct connection with employers.
- Faculty with industry backgrounds across areas such as investment banking, finance, consulting and banking. The finance page includes professionals with experience at organisations such as Citi, Credit Suisse and Deutsche Bank.
- 6,000+ placements and 4,000+ career transitions reported in Imarticus' 2024 placement highlights. ₹24 LPA highest salary reported in the same 2024 placement highlights.
- Finance pathways across different roles, including investment banking, capital markets, retail and corporate banking, wealth management, finance and accounting, FinTech and risk management.
The useful part here is the choice. Someone interested in accounting can take one route. Someone drawn to investments can take another. A person interested in technology-led financial services has a FinTech route available too. That makes the finance portfolio relevant at different stages of a finance career.
FAQs About Variance Analysis
From favourable and unfavourable results to the numbers behind them, these answers clear up the frequently asked questions that come up when reading a variance report.
What Are The Three Types Of Variance?
Three common accounting areas are revenue variance, cost variance and profit variance. The exact categories can change by business. Imarticus Learning's finance portfolio covers wider financial analysis and accounting areas that can help place these calculations in a broader finance context.
What Is A 4-Way Analysis Of Variance?
A 4-way ANOVA examines four factors within a statistical model. It can also examine interactions between those factors. This belongs to statistics rather than accounting. Imarticus Learning's broader finance and analytics programmes can help learners build quantitative skills alongside finance knowledge.
What Are The Types Of Analysis Of Variance?
Common forms include one-way ANOVA, two-way ANOVA and multivariate analysis of variance. One-way ANOVA studies one factor, while more complex designs can study several factors. Imarticus Learning also offers finance programmes where analytical skills sit alongside wider finance topics.
Why Use ANOVA Vs T-Test?
A t-test is commonly used when comparing two means. ANOVA can compare several group means within one statistical framework. IBM describes one-way ANOVA as an extension of the two-sample t-test.
What Are The Two Formulas For Variance?
Two common calculations are the absolute difference between actual and expected results and the percentage difference between them. Imarticus Learning's finance programmes include areas such as financial analysis and accounting where these basic calculations can support wider financial decision-making.
What Is A Simple Example Of Variance Analysis?
Suppose your budget is ₹10,000 and your actual cost is ₹11,000. The difference is ₹1,000. You would then check whether the extra cost came from higher prices, extra hours, greater activity or another cause. This gives the number a useful business meaning.
Why Is Variance Analysis Used?
Variance analysis is used to compare actual results with a budget, forecast or standard and understand why the figures differ. Imarticus Learning offers finance programmes across areas such as financial analysis, banking, FinTech and risk management.
Turning Variance Analysis Into Better Financial Decisions
Variance analysis is ultimately about finding out what changed and why. The calculation itself is fairly straightforward. The useful part comes after the calculation, when you look at the gap between the actual and expected figures and work out what caused it. A favourable variance can still need attention, just as an unfavourable variance can sometimes have a reasonable explanation.
This is also why variance analysis remains useful across accounting and finance. Material costs, labour hours, overheads, sales and budgets can all move away from expectations for different reasons. A finance professional needs to be able to spot that movement, trace it back to its source and decide whether it needs action. The same habit of questioning the numbers becomes useful in FP&A, management accounting and financial analysis.
For students looking to build these skills into a wider finance career, the next step is putting them alongside practical knowledge. Imarticus Learning currently offers finance programmes across these areas, including CFA, financial analysis, retail and commercial banking, FinTech and financial risk management. If you want to turn the concepts in this article into a wider finance skill set, explore Imarticus Learning's finance courses. You can use the finance portfolio to explore the area that fits the direction you want to take, whether that is investment, banking, FinTech, financial analysis or risk management.
Liked This? Follow Us Where You Already Search.
Preferred Sources is Google’s built-in follow button — no app, no login, just more Imarticus in your results.