


Last updated on October 22nd, 2026 at 03:01 pm
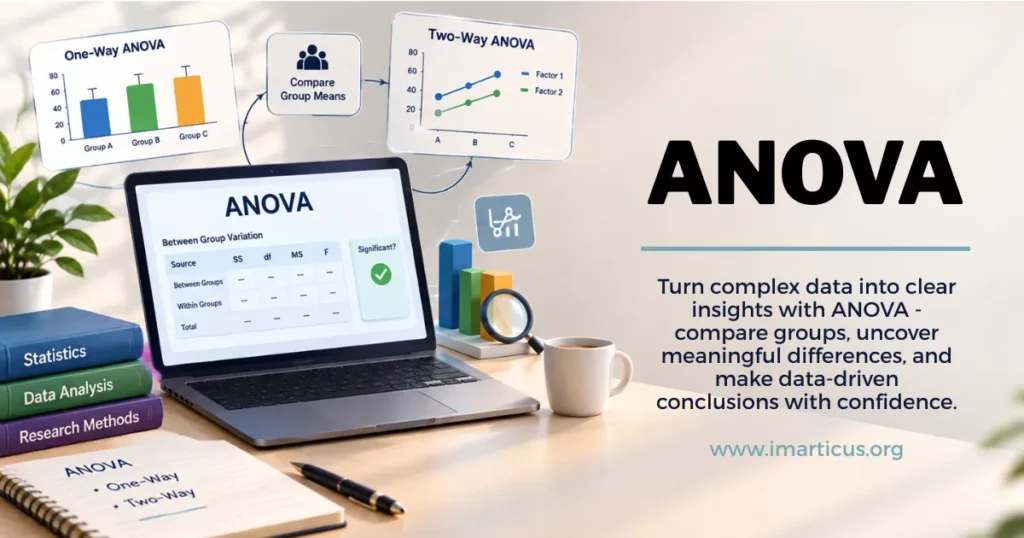
ANOVA, short for Analysis of Variance, is how statisticians figure out if three or more group averages are truly different, not just different by luck of the draw. The math behind it weighs how much groups differ from each other against the natural wobble inside each group, and boils that down to one number, the F-statistic. There are two main flavours in daily use: one-way ANOVA for a single factor and two-way ANOVA when two factors might be playing off each other. Fisher first ran it on crop data almost a hundred years ago. Funny enough, the same logic now powers the A/B tests behind half the apps on your phone.
Picture comparing exam scores across three teaching methods, or three ad campaigns fighting for the same budget. A t-test won’t get you there; it only handles two groups at a time. The moment a third group enters, ANOVA takes over. This piece breaks down what it actually is, how the test runs behind the scenes, and when one-way beats two-way.
Want to actually get good at this rather than skim it once and forget? Imarticus Learning’s data analytics course teaches it on real datasets, not just theory slides.
What Is ANOVA (Analysis of Variance)
A school runs three teaching methods side by side, lecture based, group discussion, self paced learning, and wants to know if one actually gets students better exam scores. Compare every pair by hand, and things get messy fast. Every extra comparison you tack on quietly raises the odds of a false result.
Don’t Let Our Best Advice Get Buried
Add Imarticus as a Preferred Source — see more of what we publish, every time you search.

That’s the gap ANOVA fills. The name spells it out: Analysis of Variance. It looks at how spread out your numbers are to work out whether those group averages are genuinely different or just happen to look that way. It lets you compare three or more group averages in a single pass instead of running a stack of separate tests and hoping the results still add up.
Our guide on hypothesis testing in statistics covers the broader idea behind tests like this, worth a read for context. ANOVA is really just one branch of it.
Why ANOVA Matters in Statistics
ANOVA earns its spot in nearly every stats course because it lets you compare several groups without wrecking your error rate along the way.
Total variation gets split into two piles: what’s different between your groups, and what naturally varies inside each one. Instead of asking “is A different from B” and then “is B different from C” one at a time, it just asks one question straight up: are any of these group means actually different?. Stack up enough separate t-tests and your odds of a false positive creep up purely by accident.
Here’s what that stacking actually looks like as your group count grows:
- 3 groups: 3 separate t-tests needed to cover every pair
- 4 groups: 6 separate t-tests
- 5 groups: 10 separate t-tests
Each of those tests carries its own small chance of a false positive, usually 5%. Run ten of them and your overall odds of at least one false alarm climb well past that, even though nothing real is actually going on in the data. ANOVA sidesteps that entirely by asking one combined question instead of ten separate ones.
You’ll find it in agricultural trials, clinical research, and product experiments. Basically, anywhere someone is comparing three or more groups on one outcome, it tends to be the first tool a statistician reaches for, before anyone starts digging into which specific group is driving the result.
How the ANOVA Test Actually Works
Comparing three, four, ten groups with one test sounds complicated. It’s really not, once the logic clicks. It starts, like most hypothesis tests do, with two competing claims:
- Null hypothesis (H0): every group mean is equal; nothing is going on
- Alternative hypothesis (H1): at least one group mean is different from the rest
From there, it works out the F-statistic. Variation between your groups, divided by variation within them. Genuinely different groups push that number up, since the gap between groups outweighs the everyday noise sitting inside each one. Groups that are basically the same keep that ratio hovering near 1.
Once you’ve got the F-statistic, you check it against a critical value, or just look at the p-value. Land below the usual 0.05 cutoff, and every group being the same stops being a reasonable claim, so you reject the null hypothesis in favour of the alternative. Land above it, and you simply don’t have enough evidence to say the groups differ, which isn’t the same as proving they’re equal; it just means the data didn’t make a strong enough case either way.
Did You Know?
Fisher first tried ANOVA out on crop yield numbers in 1921, at the Rothamsted Experimental Station. (Source: Wikipedia, Analysis of Variance)
The ANOVA Table Explained
Stared at output in Excel, R, or Python and felt completely lost? Fair. An example beats a dry definition every time.
Picture three fertiliser types, 5 plots tested per type, 15 plots total. Here’s roughly what the table spits out.
| Source of Variation | Sum of Squares (SS) | Degrees of Freedom (df) | Mean Square (MS) | F |
| Between Groups | 48 | 2 | 24 | 4.0 |
| Within Groups | 72 | 12 | 6 | |
| Total | 120 | 14 |
Honestly, it reads simpler than it looks. Degrees of freedom between groups is just the group count minus 1; 3 minus 1 gives 2. Mean Square is Sum of Squares over degrees of freedom; 48 over 2 gives 24. That F value at the end, 4.0 here, gets compared against a critical value, or used to work out the p-value. Same layout every time, however complicated the study behind it.
Take that F value of 4.0 further. With 2 and 12 degrees of freedom, the critical value at a 0.05 significance level sits around 3.89. Our F value clears that bar, just, which means we’d reject the null hypothesis and conclude that at least one fertiliser type genuinely affects crop yield differently from the others. What the table doesn’t tell you is which fertiliser stands out, only that one of them does. That’s exactly the kind of gap a post-hoc test fills in afterwards, something we’ll get into shortly.
Also Read: What Role Does Hypothesis Testing Play in Statistics
One-Way ANOVA vs Two-Way ANOVA
A quick side-by-side to keep the difference straight.
| Aspect | One-Way ANOVA | Two-Way ANOVA |
| Number of factors | 1 | 2 |
| Tests for interaction effects | No | Yes |
| Example question | Does teaching method affect exam scores? | Do teaching method and class size together affect exam scores? |
| Complexity | Simpler, easier to interpret | More detailed, needs more data |
| Best used when | Testing one variable at a time | You suspect two variables might interact |
Start with one-way ANOVA for a single factor. Move to two-way ANOVA the moment you suspect two variables are working together on the outcome.
🧠 Test Your Knowledge
Score: 0 / 31. How many independent variables (factors) does a Two-Way ANOVA examine?
2. Which test allows you to check if two variables influence each other (Interaction Effect)?
3. If you only want to analyze how 3 different diets affect weight loss, which test should you use?
One-Way ANOVA
One-way is the simplest version, usually the first one people learn. It compares group means across a single factor.
A few everyday examples:
- Teaching methods: one factor (method), tested across three groups.
- Store performance: average sales compared across three locations.
- Customer service: satisfaction scores compared across four service centres.
One catch worth remembering: a significant result only tells you that some group is different, not which one. Say a retail chain runs this on footfall across five outlets and gets a significant result overall; that alone doesn’t say if Outlet 3 is pulling ahead or Outlet 1 is lagging. That’s where a post-hoc test comes in, something like Tukey’s test, which goes through every pair of outlets and flags exactly which ones differ, without inflating your false positive risk. Skipping that step and just eyeballing the averages is one of the more common mistakes people make here.
Two-Way ANOVA
Two-way does everything one-way does, but for two factors at once, and it can also tell you whether those two factors interact.
Take the fertiliser example and add irrigation level as a second factor. A two-way ANOVA can now show you:
- Whether fertiliser type affects yield on its own.
- Whether irrigation level affects yield on its own.
- Whether the two together create an effect neither one produces alone, called an interaction effect.
That interaction piece is what makes two-way ANOVA genuinely useful, since plenty of real outcomes come from two factors working together, not one acting in isolation. A marketing team testing two ad creatives across two age groups sees this constantly: Creative A might do fine on its own, the older audience might convert fine on its own, but Creative A shown specifically to the older audience can massively outperform every other pairing. A one-way test run separately on each factor would completely miss that. Two-way ANOVA catches it, which is a big part of why it’s such a common tool in marketing analytics today, not just the agricultural research it started out in.
Where ANOVA Actually Gets Used
ANOVA is a statistic used to assess the results of A/B tests. It’s especially useful for marketing and product teams when evaluating the results of tests on many different variants of a product (i.e., test versions of an email, webpage, or ad). In these cases, product teams shouldn’t perform three separate two-variant tests to compare all possible versions (A vs. B, A vs. C, B vs. C). ANOVA would decrease the risk of a false error and yield more information.
- Agriculture is still its original home, comparing crop yields across fertilisers, seed types and growing conditions, the exact kind of work Fisher was doing when he first developed the test.
- Manufacturing teams use it to compare defect rates across machines, shifts or suppliers, which matters a lot when a factory is trying to work out whether a quality problem is genuinely tied to one specific machine or just normal variation.
- Clinical researchers use it to compare patient outcomes across three or more treatment groups, often as a first check before digging into which specific treatment made the difference.
- Market researchers use it to compare satisfaction or purchase intent across customer segments, say, comparing how three different income brackets rate a new product feature.
Because of the nature of data analysis, it’s likely that marketers and product managers need to perform ANOVA tests frequently. Usually, the first step in an analysis is performing an ANOVA test to see if there are any differences among the variants and to decide if further analysis is warranted. It doesn’t, however, provide a definitive answer.
Also Read: Top Statistical Concepts Every Data Scientist Should Master
Assumptions and Common Mistakes in ANOVA
Before you trust an ANOVA result, a few boxes need to be ticked. These aren’t optional checks; they’re the foundation the whole test is built on.
| Assumption | What It Means |
| Independence | Groups must be independent of each other – one person’s or one plot’s result shouldn’t influence another’s, or the variation the test measures gets distorted from the start. |
| Normality | Data within each group should be roughly normally distributed, since the F-statistic calculation assumes that shape. (ANOVA is fairly forgiving of small departures, especially with larger samples) |
| Homogeneity of variance | The spread of data across groups should be fairly similar – if one group is wildly more variable than the others, the test can flag a difference that’s really just one noisy group throwing things off. |
Common Mistakes
Even when the assumptions hold up, there are some classic ways people trip themselves up while running or interpreting ANOVA. Worth knowing so you don’t fall into the same traps.
| Mistake | Why It’s a Problem |
| Running ANOVA on very small samples | Small groups make the test unstable – a single outlier can swing the outcome. |
| Ignoring unequal variance between groups | Quietly distorts the F-statistic, making a real difference look bigger or smaller than it actually is. |
| Skipping post-hoc tests | Leaves you with “yes, something’s different” but no way to know which groups actually differ, or act on it. |
| Confusing statistical significance with practical significance | A tiny, meaningless difference can still come out “significant” in a large dataset – reporting it as a big finding misleads readers. |
Get the assumptions right and dodge the mistakes, and the result holds up. Skip either, and the test can quietly mislead you.
How to Run an ANOVA Test
You don’t need to work out an table by hand once you understand the logic behind it. In practice, this is run through software.
| Tool | How ANOVA Is Run |
| Excel | Data Analysis ToolPak, under Anova: Single Factor or Anova: Two-Factor |
| Python | scipy.stats.f_oneway() for one-way, or the statsmodels library for two-way |
| R | The built-in aov() function, one of the most used stats functions in R |
| SPSS | Analyse menu, Compare Means, then One-Way ANOVA or General Linear Model for two-way |
Excel is fine for a quick check. Python and R are what you’ll reach for with real datasets, several tests running at once, or a bigger analysis pipeline, the kind of skill a proper data science programme is built to teach.
Why Imarticus Learning Is Built for This Exact Gap
Knowing what ANOVA is on paper doesn’t mean much until you’ve applied it to a messy, real dataset. That’s the gap Imarticus Learning actually trains for.
The statistics training here is hands-on. You’re running tests like ANOVA on real datasets in Python and R, not just working through formulas on a slide. The curriculum is built with industry input, covering the statistical foundations analysts and data scientists are expected to know on the job.
There’s access to 1000+ hiring partners, which is what turns “I understand ANOVA” into “I can use ANOVA in a job.” Project-based learning, including case studies and a capstone project, gives you a place to apply tests like this to real business questions. Career support doesn’t stop once the course ends either; it covers resume building and interview prep too.
If statistics is the part of data science you want to get properly confident in, Imarticus Learning’s data analytics course is built to take you from understanding a term like ANOVA to comfortably using it in real analysis.
FAQs About ANOVA
Here are the frequently asked questions about ANOVA (Analysis of Variance), from the basics to real-world use.
What is the full form of ANOVA?
ANOVA is an acronym for Analysis of Variance. It is used to assess if there is a difference in the means of two or more groups.
In what situations is ANOVA employed?
ANOVA is used to make conclusions about the means of three or more groups. For instance, in clinical research, if the goal is to determine the effect of three or more drugs on depression, ANOVA is better suited to evaluate means when compared to multiple t-tests.
When should ANOVA be used instead of a t-test?
When comparing the means of three or more groups, ANOVA is better suited to evaluate means compared to multiple t-tests. A t-test, however, can be run when comparing the means of two groups, and the result of ANOVA would be the same.
How to Read an ANOVA Table Correctly?
An ANOVA table lists the sum of squares, degrees of freedom, mean square, and F value for both the between-groups and within-groups variation. The F value at the end is what you use to judge statistical significance, usually alongside a p-value.
Is ANOVA Difficult to Learn?
It feels intimidating at first because of the formulas, but the underlying logic, comparing variation between groups to variation within groups, is fairly intuitive once it clicks. Most people get comfortable with it quickly once they practice on real datasets instead of just memorising formulas, which is exactly the kind of practice a structured data science course gives you.
Which Careers Use ANOVA Regularly?
Data analysts, data scientists, market researchers, quality control engineers, and clinical researchers all use ANOVA as part of their regular work. It’s a core statistical skill expected in most data-focused roles today.
Your Next Step Starts Here
Go back to that teaching methods example from the start. Once you become comfortable running an analysis of variance (ANOVA), you are able to better frame your statistical hypotheses. It helps you determine if the differences you see in populations are real differences or if they are just random variation.
One-way and two-way Anova share the same fundamental idea. In one-way ANOVA, variation in groups is assessed, and in two-way ANOVA, interaction between groups is assessed, and the F-statistic is used to draw conclusions. Building that kind of statistical confidence properly, with real datasets and real guidance rather than figuring it out alone, is exactly what Imarticus Learning’s data analytics course is built for.
Liked This? Follow Us Where You Already Search.
Preferred Sources is Google’s built-in follow button — no app, no login, just more Imarticus in your results.