What is Edge Computing?
Edge computing is a segregated topology which serves to bring processed information closer to the device that is gathering the data rather than relying on a central unit which would be located much farther away.
What is Cloud Computing?
Cloud computing involves the process of delivering important information and services such as storage without the need for involvement of active management.
Which Out of the Two Is Better For Data Analysis?
In today’s world where AI has become an extremely important part of our lives, developers are looking to merge the devices we use on a day-to-day basis with artificial intelligence to make running businesses easier for organizations.
In such cases, we must look at the various computing methods that can make this possible in an efficient manner. Here, you would think that cloud computing would hold an important position in making the most suitable and ideal decisions. Platforms which are based on cloud allow developers to quickly create, deploy and handle their applications.
These would include playing the role of a platform of data for applications, application development which would help bridge the gap between data and users, and so on. It is popular for its flexibility with data storage and the ability to perform analysis processes.
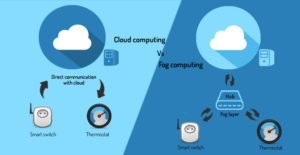
On the other hand, edge computing allows applications and various other analytical and service processes of data to be done away from a central data unit, bringing it nearer to end-users. It allows the processing to take place within the locally available resources, thus bringing it a step back from the intricately planned cloud model where data processing happens in specific data centres.
Let us dive into this further in detail.
Cloud vs Edge Computing: Latency Problems
Cloud computing is used extensively across various organizations and companies for data analysis. However, there may be situations where a business may face problems in collecting, transporting and analysing the data given.
 When data is transferred to a remote cloud server, it allows the user to perform various complex algorithms with machine learning and thus predict the maintenance needs of a particular section. This is then forwarded to a dashboard on a personal system where one can determine what decisions are to be made further. This is all done comfortably from home or the office.
This is great, however, as one begins to increase the intensity of operations, one may begin to run into issues such as physical limitations on the bandwidth of the network and thus also latency issues.
Edge computing does a great job at reducing latency issues by involving a local server, maybe even on the device itself. The only difference here is that the issue with latency is solved at the expense of the processing power offered by cloud computing methods.
Businesses, with edge computing, are now being able to decrease data volumes which would need to be uploaded and stored in the cloud. This thus makes the process of data analysis less time-consuming.
Edge computing may still interact with other website applications and servers. It includes physical sensor thus allowing it to help run smarter algorithms and facilitate real-time processing which is used in smart vehicles, drones and smart appliances. It may not be as strong as a remote server, but it helps reduce the bandwidth strain that one would normally face with cloud computing.
 A big data analytics courses would help equip a person aspiring to work in the field of data analysis with all the information that would be necessary. A big data analytics career is a good option because it is an ever-expanding field with a large number of opportunities!

 Remote learning is now been done through a lot of platforms and mediums such as Video conferences, online tasks and assessments, discussion boards, webinars, etc. These platforms allow free flow of information and are equipped with all kinds of features like screen sharing, system control sharing, whiteboards, annotations etc. Remote learning is a new way of learning.