

Big Data and IoT cannot exist without one another in today’s digital era. The two technologies are pushing the technological revolution across the world in a big way and here’s how.
Today you can simply go for a run or a walk and your wearable gadget will not only tell you how many steps you have taken but also take your calls, turn off the lights in your house in case you have forgotten. This is the power of Internet of Things or IoT.
A lot of devices such as smartphones, smart-homes , DHL’s tracking and monitoring systems, smart security are run on IoT. So what is IoT? Simply put IoT is the ability of a device to communicate with another device over the internet. These devices or networks are enabled by IoT which gives them the option to connect, communicate, send and receive and store data.
By 2020, the IoT industry is set to grow by 330 million dollars according to a Gartner study. When combined with the power of data analytics or big data, IoT will disrupt the way industries function. Big data means the ability to analyze large volumes of data at a great velocity and provide valuable insights.
This can be both unstructured and structured data that is dense and can be stored. The sheer volume of data that is processed at an incredible speed gives big data its name. Big Data courses provides industries with valuable insights and information on their customers, behaviors, spending habits which in turn can help enhance customer experience.
Now that we have a better understanding of Big Data and IoT, here are the ways in which both technologies are complimenting each other and driving digital transformation
Storage of Data
Today there is an abundance of data which is processed on a day to day basis. From videos watched on Youtube to messages sent over the internet, data is created, stored and proceeded at an unprecedented rate. This means that large scale digital centers need to be set up to store data load.
Hence organizations are using IoT based infrastructure to move into a platform as a service model or a cloud solution to store data. These systems provide flexibility and scalability of data storage.
Data Security
The vast of amounts of IoT data processed will also contain a lot of secure information that cannot be stored on public networks or devices. There needs to be well established protocols in place to combat theft of data and other fraudulent crimes. A lot of organisations are using programming languages such as Hadoop or Hive to store data with proper protocols in place.
Gearing for the future
Once a proper data storage system has been set in place, there needs to be enough infrastructure to support growth and performance. This means that there will also be new job opportunities created in the IoT space to maintain and process analytics.
Conclusion
IoT is remarkable in many ways, and when it combines with the forces of data, it is able to manipulate the data and provide valuable solutions to organisations. They both are closely connected have enabled the growth and transformation of many businesses today.
Tag: big data
Popular Tools to Analyze Data
Big Data is now an inevitable part of how many companies operate. While we all leave our footprint on the internet, companies ranging from IT to manufacturing firms are reaping the benefits of data analytics.
Knowing how to extract the information and trends, you require from the vast pool of data is imperative. Data analytics courses lets companies leverage this information for creating new plans, products, trends, offers, and more.
There are many tools that can be used effectively for analyzing data. Each of these tools has their own benefits and strengths. Once you are familiar with the capabilities of these tools, you will be able to employ the right tool for the right analysis. Tools for data analysis can be categorized into three main types.
- Open Source Tools
KNIME
KNIME Analytics Platform is one of the most popular choices available to data scientists. It lets you model and manipulates data with more than 1000 modules, ready-to-run examples, a comprehensive set of integrated tools, and a large collection of advanced algorithms.
RapidMine
This tool is similar to KNIME in that it is a visual program. This tool has a unified environment making it easy to run through the entire gamut of the analytical workflow. You can use this tool for everything from data prep to machine learning to model validation to deployment.
- Tools for Data Visualizations
Datawrapper
This is an effective tool used by news rooms around the world to create easy understand graphics and interactive charts. During elections, for example, newsrooms will plug in data collected by various resources and journalists on the ground to create charts that the layman can use.
The data can be populated according to race, ethnicity, age, gender, qualification, and more in order to understand the trend of the elections. Politicians in turn can use the same data to understand where they have popularity and with whom their ideologies resonate.
Google Fusion Tables
This is an amped up version of Spreadsheets backed by the powerful mapping tools of Google. You can use preexisting tables and combine two or more tables to create a visualization for both sets of data. You can choose to map, graph, chart the data which can then be shared or embedded into any page. This tool is great for collaboration as all the data organisation is saved on Google Drive.
- Sentiment Tools
SAS Sentiment Analysis
Going back to the elections example, sentiment techniques can be used to assess sentiments in real time. The SAS tool extracts and interprets sentiments in real time or over a time period that you can specify. The tool features natural language processing and statistical modelling. The language processing is rule-based, and so you can choose the specific trend or emerging topic. This tool can be used to find the current feeling a population has towards a particular electoral candidate. This can be further developed to reflect the sentiments based on age, employment, gender, and sexual orientation.
Opinion Crawl
This is a great data analytics tool for all data scientists. It allows you to get sentiment analysis based on topic. This could be a person, a real-time event, a company, a product, or more. This tool provides the data in the form of a pie chart representing the real-time sentiment of the topic along with related images, a few headlines, and, most importantly, key semantic concepts related to the topic according to the public.
What makes Hadoop so Powerful and how to Learn it?
Why Hadoop?
With today’s powerful hardware, distribution capabilities, visualization tools, containerization concepts, cloud storage and computing capabilities, huge amounts of raw data can be stored, processed, analyzed, and converted into information, used for decision making, historical analysis and for future trend prediction.
Understanding Big data and converting into knowledge is the most powerful thing any entity can possess today. To achieve this, Hadoop is currently the most used data management platform. The main benefits of Hadoop are:
- Highly scalable
- Cost-effective
- Fault-tolerant
- Easy to process
- Open Source
- What is Hadoop?
Hadoop is a Highly distributed file system (HDFS), maintained by Apache Software Foundation. It is a software to store raw data, process it by leveraging the distributed computing capability and to manipulate and filter it for further analysis.
Several frameworks and machine learning libraries like python and Operate on the processed data to analyze and make predictions out of it. It is a horizontally scalable, largely distributed, clustered, highly available, and reliable framework to store and process unstructured data.
Hadoop consists of the file storage system (HDFS), a parallel batch processing engine Map Reduce and a resource management layer, YARN as standalone components. Open source software like Pig, Flume, Drill, Storm,Spark, Tez, Hive, Kafka, HBase, Mahoot, Zepplin etc. can be integrated on top of the Hadoop ecosystem to achieve the intended purpose.
How to Learn Hadoop?
With interest in Big Data growing day by day, learning it can help propel your career in development. There are several Big data Hadoop training courses and resources available online which can be used to master Hadoop theoretically.
However, mastery requires years of experience, practice, availability of large hardware resources and exposure to differently dimension ed software projects. Below area few ways to speed up learning Big Data.
- Join a course: There are several Big Data and Hadoop training courses available from a developer, architect, and administrator perspective. Hadoop customization like MapR, Horton Works, Cloud era etc. offer their own certifications.
- Learning marketplaces: Virtual classrooms and courses are available in Course Era, Udemy, Audacity etc. They are created by the best minds in the Big Data profession and are available at a nominal price.
- Start your own POC: Start practice with a single node cluster on a downloaded VM. Example: Cloud Era.com quick start.
- Books and Tutorials on the Hadoop ecosystem: Hadoop.apache.org, Data Science for Business, edurekha,digital vidya, are a few examples apart from the gazillion online tutorials and videos.
- Join the community: Joining the big data community, taking part in discussions and contributing back is a surefire way to increase your expertise in big data.
Points to remember why Learning Hadoop:
Below are the things to keep in mind while working on large open source Big Data projects like Hadoop:
- It can be overwhelming and frustrating: There will always be someone wiser and more adept than you are.Compete only with yourself.
- Software changes: The ecosystem keeps shifting to keep up with new technology and market needs. Keeping abreast is a continuous process.
- Always Optimize: Keep finding ways to increase the performance, maturity, reliability, scalability, and usability of your product. Try making it domain agnostic.
- Have Fun: Enjoy what you are doing, and the rest will come automatically!
All the Best on your foray into the digital jungle!
How Data Sciences Principles Play an Important Role in Search Engines
Organisations today have started using data at an unprecedented rate for any and everything. Hence, it is mandatory that any organisation that has adopted data will need to analyse the data. Here is the real job of a search engine which can search and get results back in milliseconds.
The notion where people believe search engine is only used for text search is completely wrong as search engines can find structured content in an enhanced way than relational databases. Users can also check on portions of fields, such as names, addresses at a much quicker pace and enhanced manner. Another advantage of search engines is that they are scalable and can handle tons of data in the most easier and faster manner.
Few of the benefits of using search engine tools for data science tasks which are taught in big data analytics courses include:
Exploring Data in Minutes: Datasets need to be loaded to search engines, and the first cut of analysis are ready within minutes sans codes. This is the blessing of modern search engines that can deal with all content types including XML, PDF, Office Docs to name a few. Although data can be dense or scarce, the ingestion is faster and flexible. Once loaded the search engines through their flexible query language can support querying and the ability to present larger result sets.
Data splits are Easier to Produce: Some firms use search engines as a more flexible way to store data sets to be ingested by deep learning systems. This is because most drivers have built-in support for complex joins across multiple datasets as well as a natural selection of particular rows and columns.
Reduction of Data: Modern search engines come with an array of tools for mapping a plethora of content which includes text, numeric, spatial, categorical, custom into a vector space and consist of a large set of tools for constructing weights, capturing metadata, handling null, imputing values and individually shaping data according to the users will.
However, there is always room to grow there is an instance where modern search engines are not ready for data science and still evolving. These areas include analysing graphs, iterative computation tasks, few deep learning systems and lagging behind search support for images and audio files. There is still room for improvement and data scientists are working towards closing in on this gap.
Build Your Own AI Applications in a Neural Network
Today Big Data, Deep Learning, and Data Analytics are widely applied to build neural networks in almost all data-intensive industries. Machine learning courses in India offers such learning as short-term courses, MOOCs, online classrooms, regular classrooms, and even one-on-one courses. Choices are aplenty with materials, tutorials and options for training being readily available thanks to high-speed data and visualization made possible by the internet.
The study on jobs in Data Sciences says that core skills in Python are preferred by recruiters and is requisite for jobs in data analytics. The challenge lies in formulating a plan to study Python and the need of a specialist to help understand the technical and practical aspects of this cutting edge technology.
Why do a Specialization Course for Beginners?
Not all are blessed with being able to learn, update knowledge and be practically adept with the Python platform. It requires a comprehensive knowledge of machine learning, understanding of data handling, visualization techniques, AI deep learning, statistical modelling and being able to use your expertise on real-time practical examples of data sets from various industries.
Machine learning courses and case studies on Python platform are conducted in flexible learn-at-your-own-pace sessions in modes like instructor-led classroom sessions at select locations, virtual online classes led by certified trainers or even video sessions with mentoring at pre-determined convenient times.
One can do separate modules or certificate Big data Hadoop training courses with Python to understand data science analytics and then opt for modules using AI for deep learning with Python or opt for a dual specialization by doing the beginners course and courses covering AI and Deep Learning with Python. The areas of Deep Learning and AI both require prior knowledge of Deep Learning, Machine Learning, and data analytics with Python.
An example of one such course is the AnalytixLabs starter classes in Gurugram and Bangalore as a speedy boot-camp followed by a package of two courses in AI Deep Learning with Python and the Data Science with Python. The prerequisites are knowledge of at least one OOPs language and familiarity with Python. Their 36 classes, 250-hour course offers dual specialisations, and 110 hours of live training using multiple libraries in Python.
Just ensure you choose the right course to allow your career prospects to advance and allows further learning in Python-associated specialised subjects.
How AIML Can Facilitate a Holistic Digital Transformation of SMEs
Using AI digitised mobility-efficient business management empowers SMEs to expand to any region globally with literally no associated monetary or infrastructural deterrents. Especially in processes like strategy-based planned sales, financial management, supply chain logistics, and marketing management where the focus should rightly be on the operational aspects rather than offline management of these which reduce enterprise efficiency.
Notable benefits of machine learning courses in India are learning better workflow management, enabling operational management to reach out, service and retain the all-important customer base. Increased cost-reduction, increased satisfaction levels of customers, doing away with time-consuming redundant offline process management and the obvious maximising of profit margins and enterprise efficiency result.
Role of Machine Learning-ML and AI
Issues are unique to every enterprise. Solutions should emerge from the workflow and be need-specific to the enterprise and its segment. Automating the logistics of the supply chain processes and sales can be optimised by ML and AI to build solutions meeting the needs and precise requirements of any business or industry with a high level of precision and customisation through the proper use of the huge data repository available with them.
Data and Challenges
Data is the backbone of automation and readily available with SME’s. Greater volumes in the database ensure tweaking for quickening and process efficiency. Big data Hadoop training courses help streamlining data, identifying and eliminating unnecessary recurrent processes and automating the process for fixed quicker and efficient outcomes is what ML, data analytics and AI intuitive combinations does when customizing processes and big data.
This indirectly frees-up the crucial time-component spent on customer interactions. ML and AI bring huge benefits in pattern recognition and predictive analysis. Their use helps deliver effective business solutions with quick outcomes by identifying and automating recurring procedures and patterns. Thus the digitization of marketing and sales drive profit and efficiency in the enterprise.
Customer Service Paradigms
In today’s scenario the pervasive use of the internet, use of digital tools, mobile apps and smart-phones create a huge database of young consumers under-35, who use and prefer digital methods to offline methods. Gainful insights are provided through their feedback, need for value-enhanced solutions, customer interaction and resolutions for customer satisfaction.
The success of SME’s depends on adapting and catering to this sector which forms nearly two-thirds of the total Indian population. Many shy away from building a digital infrastructure citing prohibitive costs involved. But, as per digital customers and a study by Google-KPMG, SMBs and SMEs have the potential to grow twice as fast with the adaptation of ML and AI.
Do we need to say anything more for machine learning courses?
Big Data for Big Banks – You Should Know
The growth of Big Data
Data is not just the new oil, but the new land too. In short, data is perhaps the most important resource to have in this century. With billions of data points and information being collected across the world every second through the internet and other avenues, the data size is increasing manifold. The upcoming technology is focusing on how to organize and sort this huge amount of data to derive insights and read patterns.
This, in effect, is referred to as Big Data Analytics Courses. Every major or minor firm, big or small player, in the consumer retail sector to healthcare and financial series, is using insights generated out of this big data to shape and grow their businesses. The lending business is no exception and can benefit immensely from the use of data. Fin-tech is changing the way the banking industry operates and making banking operations smoother, automated and more cost-effective. From fraud mitigation to payment solutions, Fintech is changing the way we think about banks.
Data in lending business
From the origination of the role to its continuation and life cycle management data can drive decision making in lending business. The patterns that can be read out of consumer data can predict the loans requirement, the capability of repayment of loans, the frequency of late payments or defaults and even the need for the consumers to refinance their loans. The fin-tech start-ups have already begun using the data in such a way, and hence the alternative lending businesses have bloomed over the last few years. Many banks are either merging with such alternative business lenders or taking the help of third party service providers to help boost their capabilities and skills to use big data analytics in business.
The areas of thrust
The major areas where lending business can be aided through the use of big data analytics are the portfolio risk assessment, stress tests, default probabilities and predicting the loan patterns of consumers. Credit card business already uses such technology extensively in assessing and evaluating their consumers.
For example, the credit card issuers tracked the repayments data of the users and based on the profession or the region; they may at times predict if the balances are going to be resolved or if they are going to be paid up front. They then design their marketing strategies keeping the results of analytics in mind in those areas or regions or regarding those specific consumers.
In the bygone years, the only way banks used to evaluate the creditability of a prospective borrower was to assess his or her records of past loans and repayment history. However, with new real-time data points, banks can study behavioural patterns and take appropriate decisions. Refinancing loans is another important area where technology and finance have come together to make life easier for consumers and banks alike.
The algorithms can predict when a borrower may need to refinance his loans and can credit the amount in his account within seconds without all the paperwork and unnecessary delays. Another area that has transformed with the advent of big data and technology is the internal auditing of banks. With a digital record of every transaction or decision-making process, compliance rules and regulations are now easier to adhere to and track.
Lastly, and perhaps most importantly, customer feedbacks have become important in this industry like never before. The algorithms can sift through loads and loads of data in the form of feedbacks and can implement solutions to enhance customer experiences on a real-time basis. Technology has changed almost everything around us and the lending operations to are no exception to the rule. In the years to come, banking may undergo a drastic transformation with elements that at this time, we may even be unable to imagine.
5 Simple Facts About Big Data Analytics Courses – Explained
Data Science, Machine Learning or the Big Data Analytics Courses whatever one might refer it as, the subject matter has witnessed colossal growth over the last two decades due to the increase in collection of data, improvement in data collection techniques and methods, and a substantial enhancement in the power of computing data. Various data analyst jobs are pooling talent from multiple branches of engineering, computer scientist, statisticians and mathematicians and is increasingly demanding an all-around solution for numerous problems faced by the businesses in managing their data.
As a matter of fact, not a single stream of business, engineering, science etc. has remained far from the reach of data analytics and are employing various data analysis tools on an on-going basis within their respective industries. Perhaps it can be one of the best times for students to enroll in the big data analytics courses and be future ready as the future is in data analytics.
But, as data analytic jobs are deemed to be in an upward trend shortly, here are some simple facts one needs to know about data analytics before embarking a big data analytics course or a career in data analytics.
- No Data is Ever Clean
Theoretically, as taught during a data analytics course, analytics in the absence of data is just a group of theories and hypothesis, whereas data aids to test these theories and hypothesis towards finding a suitable context. But, when it comes to the real world, data is never clean and is always in a pile of mess. Organisations with established data science centres to say that their data is not clean. One of the major issues organisations face apart from missing data entries, or incorrect entries is combining multiple datasets into a single logical unit.
The various datasets might face many problems which prevent its integration. Most data storage businesses are designed to be well integrated with the front-end software and the user who generates the data. However, many-a-times, data is created independently, and the data scientist arrives at the scene at a later stage and often ends up being merely a “taker” of data which is not a part of the data design.
- Data Science is not entirely The user will need to clean some data manually
A vast majority of people do not wholly understand what data analytics is? One of the most common misconceptions about data analytics is that the various data analysis tools thoroughly clean the data. Whereas, in reality, as the data is not always clean, it requires a certain degree of manual processing to make it usable, which requires intense amount of data processing, which can be very labour intensive and time-consuming, and the fact remains that no data analysis tools can completely clean the data at the push of a button.
Each type of data poses its own unique problem, and data analyst jobs involve getting their hands dirty and manually processing data to test models, validate it against domain experts and business sense etc.
- Big Data is merely a tool
There is quite a lot of hype around the Big Data, but many people do not realize that it is only a collection of data analysis tools which aids working with a massive volume of data promptly. Even while using Big Data, one requires the utilise best data modelling practices and requires a trained eye of an expert analyst.
- Nobody cares how you did something
Executives and decision making are often the consumers of various models of data science and continuously require a useful and a workable model. While a person performing one of many data analyst jobs might be tempted to provide an explanation to how data was derived, in reality, these executives and decision makers care less how the data was acquired, and are more interested in its authenticity and how can it be used to improve any of their business functions.
- Presentation is Everything
As most of the consumers of analytic solutions are not mathematicians and are experts in their respective fields, presentation plays a vital role in explaining your findings, in a non-technical manner, which is understandable to the end user. A PowerPoint presentation loaded with infographics can aid a data scientist in conveying the end-user their message in a language and mode of communication with is easy of them to understand.
Healthcare’s Top 10 Challenges in Big Data Analytics
Healthcare’s Top 10 Challenges in Big Data Analytics
There are multiple perks to Big Data analytics. Specifically, in the domain of healthcare, Big Data analytics can result in lower care costs, increased transparency to performance, healthier patients, and consumer satisfaction among many other benefits. However, achieving these outcomes with meaningful analytics has already proven to be tough and challenging. What are the major issues slowing down the process and how are they being resolved? We will discuss the top 10 in this article.
Top 10 Challenges of Big Data Analytics in Healthcare
- Capturing Accurate Data
The data being captured for the analysis is ideally expected to be truly clean, well-informed, complete and accurate. But unfortunately, at times, data is often skewed and cannot be used in multiple systems. To solve this critical issue, the health care providers need to redesign their data capture routines, prioritise valuable data and train their clinicians to recognise the value of relevant information.
- Storage Bandwidth
Typically, conventional on-premises data centres fail to deliver as the volume of healthcare data once reaches certain limits. However, the advancement in cloud storage technology is offering a potential solution to this problem through its added capacities of information storage.
- Cleaning Processes
Currently, the industry relies on manual data cleaning processes which takes huge amounts of time to complete. However, recently introduced scrubbing tools for cleaning data have shown promise is resolving this issue. The progress in this sector is expected to result in automated low-cost data cleaning.
- Security Issues
The recurring incidents of hacking, high profile data breach and ransomware etc are posing credibility threats to Big Data solutions for organisations. The recommended solutions for this problem include updated antivirus software, encrypted data and multi-factor authentication to offer minimal risk and protect data.
- Stewardship
Data in healthcare is expected to have a shelf life of at least 6 years. For this, there is a need an accurate and up-to-date metadata of details about when, by whom and for what purposes the data was created. The metadata is required for efficient utilisation of the data. A data steward should be assigned to create and maintain meaningful metadata.
- Querying Accesses
Biggest challenges in querying the data are caused by data silos and interoperability problems. They prevent querying tools from accessing the whole repository of information. Nowadays, SQL is widely being used to explore larger datasets even though such systems require cleaner data to be fully effective.
- Reporting
A report that is clear, concise and accessible to the target audience is required to be made after the querying process. The accuracy and reliability of the report depend on the quality and integrity of data.
- Clear Data Visualization
For regular clinicians to interpret the information, a clean and engaging data visualization is needed. Organisations use data visualization techniques such as heat maps, scatter plots, pie charts, histogram and more to illustrate data, even without in-depth expertise in analytics.
- Staying Up-to-Date
The dynamic nature of healthcare data demands regular updations to keep it relevant. The time interval between each update may vary from seconds to a couple of years for different datasets. It would be challenging to understand the volatility of big data one is handling unless a consistent monitoring process is in place.
- Sharing Data
Since most patients do not receive all their care at the same location, sharing data with external partners is an important feature. The challenges of interoperability are being met with emerging strategies such as FHIR and public APIs.
Therefore, for an efficient and sustainable Big Data ecosystem in healthcare, there are significant challenges are to be solved, for which solutions are being consistently developed in the market. For organisations, it is imperative to stay updated on long-term trends in solving Big Data challenges.
What are the Salary Trends in Data Analytics?

Data is being generated and used constantly in all our devices imperceptibly and has evolved into a huge asset in recent times. The very volumes of data being generated and used have crossed the definition of ‘Big’ data many times over. This has led to the technology handling data also evolving rapidly to keep pace and handle greater data volumes. Obviously, no matter how complex the tasks machines can execute they will need personnel and experts at handling data to keep going. Thus the scope for data analysts does appear very bright.
In tandem with demand for data analysts, the training institutes for supplying trained personnel are also constantly updating the courses and technologies taught to ensure the aspirants emerge job prepared. Certifications that are relatively recent are now almost mandatory to give employers a peek into skills possessed, languages they are proficient in, and actually measure the readiness and suitability of the employee.
It goes without saying that a data analyst is as much of an asset to any organization as the data itself. Little wonder then, the Data analyst Salary for the aces in data analytics seems humongous in comparison to other jobs.
Yes, it takes time, practice, a Data analytics Course, and experience to get there but then demand always spurs handsome payouts.
The sought after roles:
• Developers for BI.
• Architects in Data, Applications, Infrastructure, Enterprises.
• Data experts categorized as Scientist, Analyst, Engineer, Statistician.
• Machine Learning Scientist, Engineer.
Salary Trends In Data Analytics
-
- This field is blessed to receive a fresher Data analyst Salary range of Rs 6 to 7 lakhs pa which is much higher than other job profiles. With 3 to 7 years on the job, they easily grow into the 1 lakh/month category and this doubles as you gain 7 to 10 years experience.
- The payouts are better in the metros and big cities. So are the opportunities.
- The best paying sector is the E-commerce platform companies who have enjoyed much success in the last few years. Starting off with Rs 7 to 8 lakhs packages is not uncommon. The service providers are playing well but not as high as these platforms.
- Skills in programming with R, SAS, Python, open-source free tool suites, etc can fetch salaries in the bracket of Rs 13 lakhs pa depending on your justifying your skillset. So get cracking and equip yourself.
Big data jobs do not score over the Machine-Learning roles in modern times. ML roles start off with packages in the range of Rs 13 lakhs pa. It is ideal to have skills in Big data and analytics so you stand out of the crowd.You will need adeptness in big data tools like Python, Tableau, R, SAS, Spark along with ML suites like NoSQL Databases, Learning-Algorithms, and Data Visualization tool suites.
Re-skill with a Data analytics Course so you can be where the action is if you are already a professional in any of the data-analytics fields. The trend is for generalized data specialists and not just people who handle data well. After all, it makes organizational sense to have a person who can handle the entire gamut of data operations and analytics in comparison to hiring separate personnel for data and analytics job roles.
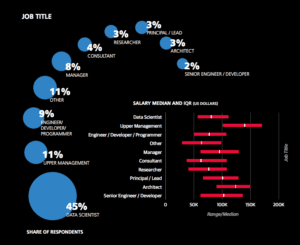
Choose your career
- A career as a Data Scientist:
The data can be big, small or very big. The data scientist examines them all while cleaning, formatting, munging, wrangling and preparing the data before he moves to perform predictive analysis that provides those forecasts, insights and data lakes to draw on.
One of their core strengths is readying the recommendatory systems used for e-commerce platforms like Flipkart, Amazon, eBay, etc. Very large amounts of data are examined and patterns in purchasing,warehousing, supply-chain management, stocking, product preferences, etc are determined. Since data can be structured in various source-dependant formats a large part of cleaning and preparing the data is required. In the US one could get an average Data analyst Salary range of 139,840$ and the trending e-commerce platforms like Twitter, Facebook, etc are ready to snap up the best.
- A career as Developers of BI:
The developer’s role is also an important role and can fetch average salaries in the range of 89,333$. The role involves developing and designing organizational policies and business decisions, building their own tools for analytics if required, improving the IT solutions through effective testing, coding, debugging and tool implementation.
- A career as an Analyst:
The analyst role is to provide those gainful insights. They come with good knowledge across verticals and can handle datasets efficiently. They are very popularly used in smaller businesses, verticals like marketing, HR, finance, etc where their insights help make better decisions. They do not earn as high as the data scientist but the payouts are still handsome.
- A career as an Engineer:
They collaborate with the scientist and analyst to maintain and develop the structure, create processes using datasets for mining, modeling, and verification of data, and thus spur almost all organizational processes. Their role is crucial in making the data readable and understandable. The average salary drawn is 151,307$ pa and they do have sufficient demand in the job market.
- A career in Data Analytics:
This role is popular for analyzing A/B testing, prioritizing data tasks, tracking the web, model making, working on big data set and producing reports for business decisions. The median salary is 83,878$ pa.
- A career in ML:
This role is the best paid with high demands and an excellent median salary range of 139,840$ pa. Their jobs involve the creation of funnels of data, software solutions, applying ML tools and algorithms, making prototypes, designing ML systems, and testing and debugging.
- A career as an architect:
An architect is responsible for the architecture and the role would depend on whether they are in the Enterprise, Data, Applications, or Infrastructure specialists. This is the highest paid job and the onus of being the supervisor, controller, subject expert, monitor, and liaising with both management and clients rests on him. With more challenging jobs the payouts are definitely higher. Median Data analyst Salary ranges of salaries could be from 126,353$ for Infrastructure architects to 161,272$ for Enterprise Architects.
Concluding notes:
The trends show that you should make a career in data analytics because of the demand and supply position is conducive to making a career here. Doing a Data analytics Course at Imarticus is the best-suited method for achieving your goals. Skill accumulation is the golden key. Take note that you get better with experience. So, don’t wait.