

Most people open Power BI for the first time and think it is just another chart tool. Then they load real data. Sales numbers. Website traffic. Customer churn. Suddenly, the screen feels different. Every column hides a question. Every row hints at a decision someone needs to make.
That is where Power BI projects become powerful. They are not practicing for the sake of practice. They are small simulations of real business pressure.
→ Imagine a store owner trying to understand why profits dropped last month
→ Imagine a marketing manager checking which campaign actually brought paying customers.
These are not abstract problems. These are everyday business puzzles. When you build dashboards around them, you start thinking like an analyst and not just a learner.
Power BI projects also build comfort with messy reality. Data is rarely perfect. Dates are in the wrong format. Names are spelled differently. Some values are missing. Cleaning data may feel slow at first, yet this is where professional skill grows. You begin to see patterns in errors. You learn how to fix them quickly. You understand why clean data leads to trustworthy insights.
Think about the apps you use every day. A food delivery app shows live order status. A fitness app tracks weekly progress. A banking app shows spending trends. Behind each of these screens is a dashboard mindset. Someone designed those views to make complex data feel simple. When you work on projects in Power BI for data science and analytics, you practice building that same clarity for business data.
This guide brings together practical projects in Project BI that you can start right away. Each one is designed to help you move from watching tutorials to creating solutions. By the end, dashboards will feel less like assignments and more like tools you can use to understand how the world of business really works.
What Makes Power BI Projects So Important
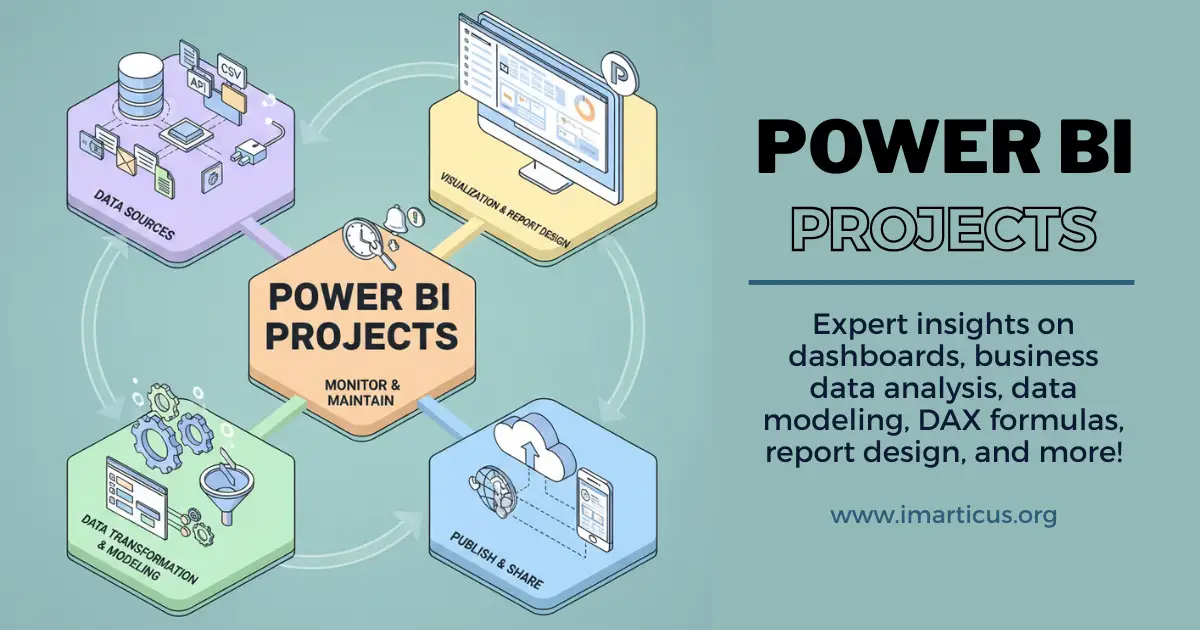
Power BI projects are practical data tasks where you take raw information and turn it into meaningful dashboards. Instead of only learning features like charts or formulas in isolation, you apply them together to solve a real business problem.
To understand what is Power BI, think of it like cooking a full meal instead of just learning how to chop vegetables. Each Power BI project combines data preparation, calculations, and visuals to create something useful for decision-making. These projects help you move from learning the tool to thinking like an analyst.
What Power BI Projects Usually Include
Before looking at examples later in the blog, it helps to know the common building blocks.
| Component | What It Means in a Power BI Project |
| Data Source | Excel files, databases, or cloud apps |
| Data Cleaning | Fixing errors and formatting using Power Query |
| Data Model | Connecting tables with relationships |
| Calculations | Measures like totals, averages, and growth |
| Visuals | Charts, tables, KPI cards |
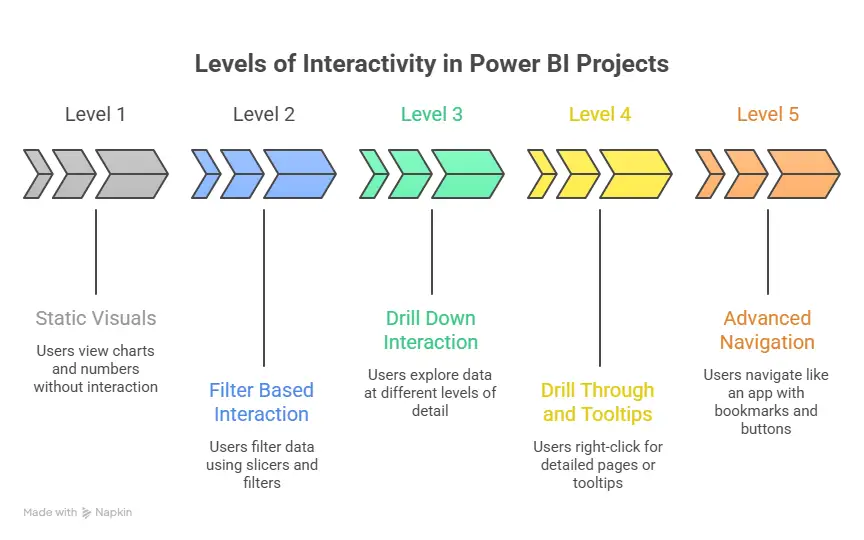
| Interactivity | Filters, slicers, drill down |
| Insights | Key findings from the dashboard |
Each part plays a role in turning raw data into a story.
How Power BI Projects Are Different from Practice Exercises
Many beginners confuse small feature practice with real projects. There is a difference.
| Practice Task | Power BI Project |
| Create one chart | Build a full dashboard |
| Use a sample table | Use multiple related datasets |
| Focus on a feature | Focus on solving a business question |
| No real context | Based on real-world scenarios |
This blog focuses on Power BI projects that feel like real work, not just tool demonstrations.
Why Practice Power BI Projects Are the Key to Mastery
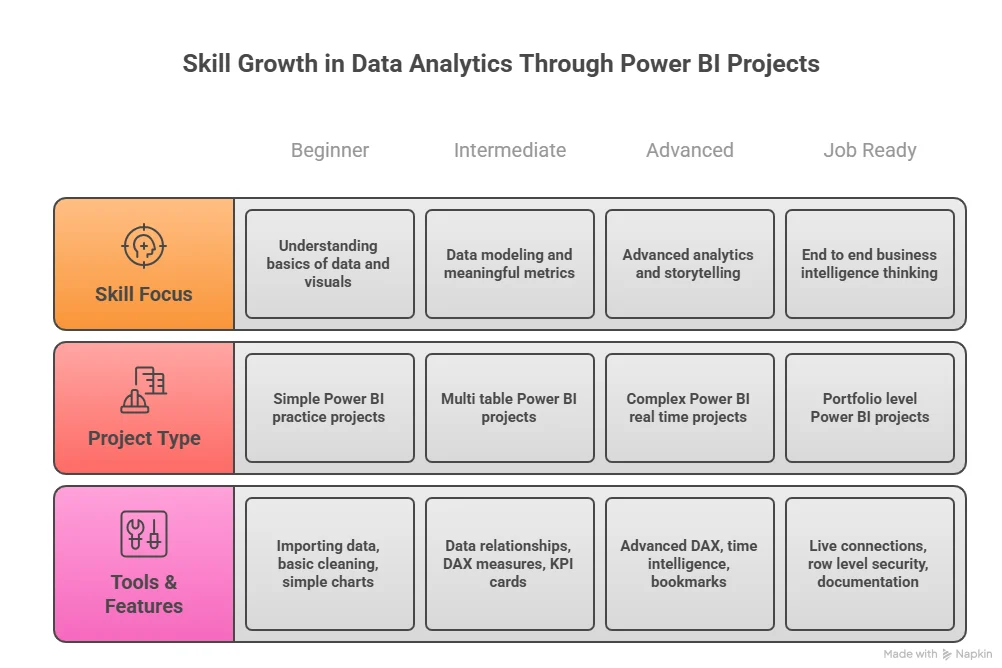
When you work on Power BI sample projects, you grow in three important ways:
1. You learn the tool itself.
Power BI can connect with data from spreadsheets, databases, web sources, and business systems. The experience of bringing data in, cleaning it, modeling it, and then visualising it improves your skills faster than watching tutorials alone.
2. You build mental models for solving problems.
Each practice project is a problem to solve. It shifts you from thinking about ‘what does this tool do?’ to ‘how do I solve this business need?’
3. You create assets for your portfolio.
Few Power BI projects examples with real explanations show employers that you can translate data into insight.
Starting a career in data analytics becomes much easier when the path is broken down into clear, practical steps. From building core skills in data handling and visualization to working on real projects and understanding business problems, a structured roadmap helps remove confusion.
Setting up the Plan for Power BI Projects
Before you open Power BI Desktop, you need a plan. I use a simple template for every project I start. This acts like a blueprint, for example, as seen in house construction before electricians and carpenters step in.
Project plan outline
- Objective of the project: What question are you trying to answer? For instance, “Which product line contributed most to profit last year?”
- Data sources and quality checks: List file names, columns, and note if you need to clean them.
- Measures and calculations needed: Define the executive metrics. For example, total profit, average order value, and year-over-year growth.
- Visuals and layout: A sketch of your dashboard helps avoid clicking around aimlessly.
- Story flow: In what order will you guide viewers from high-level to detail?
Using a Power BI project plan template like this keeps your work tidy and helps you document what you did. You can save it and reuse it on future projects.
Example Project: Monthly Sales Tracker
Let’s do a quick story of a sample project you could build. You have an Excel data file with monthly sales records for a small retailer. Column names include:
- Month
- Product Category
- Units Sold
- Revenue
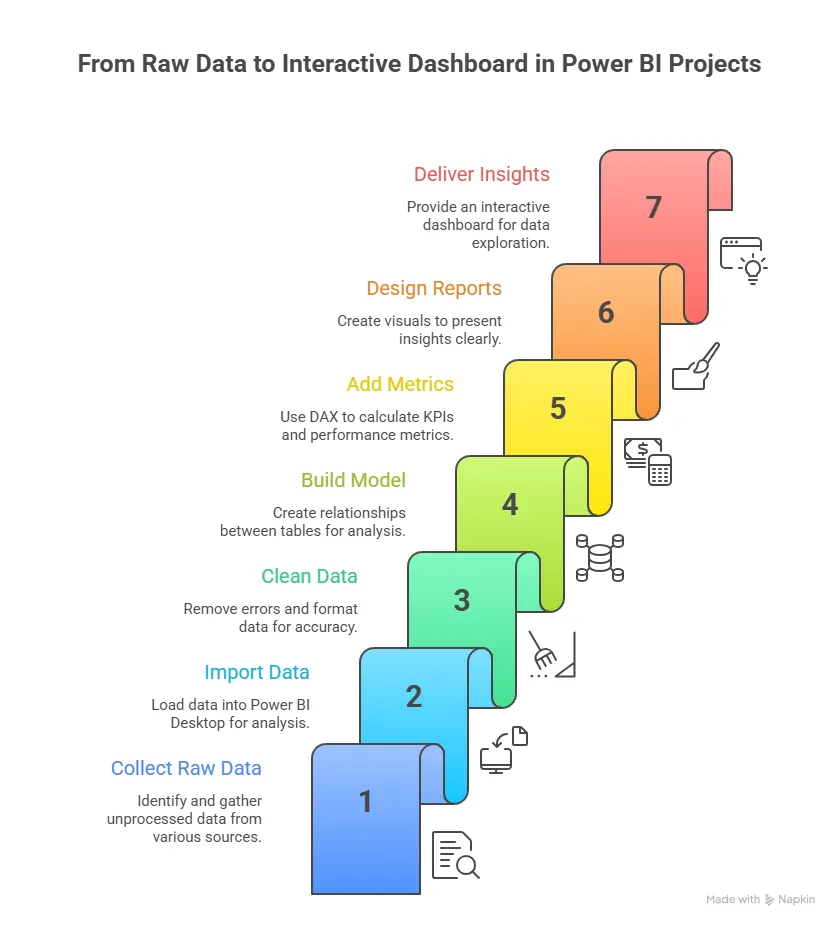
Steps to build this Power BI project:
- Import your data
Use Power BI Desktop and choose the file. Power BI will preview the data before loading, so you can check for missing values or odd entries. - Clean and shape the data
Use Power Query to filter out empty rows, unpivot columns if needed, and standardise date formats. - Build a data model
If you bring in more than one table, check the relationships. Are the months linked correctly between product tables? Does anything need a lookup table? - Define key metrics
Create measures like:- Total Sales = SUM(Revenue)
- Monthly Growth = ([This Month] – [Last Month]) / [Last Month]
- Create visuals for your dashboard
Use a line chart for sales over time, bar charts for categories, and donut charts for product mix. - Add slicers and filters
Let the user explore data by category, by region, or by time period.
This simple project turns rows and columns into tangible insights.
Also Read: 6 Key Features and Benefits of Power BI
What Makes a Great Dashboard
A dashboard should feel intuitive. When a business leader opens it, they should almost know what they will see. Two guiding principles often help:
- Focus on clarity
The dashboard should answer questions easily. If I need to know last quarter’s revenue in two clicks, the dashboard should make that possible. - Think of user motion
A dashboard should tell a story. Start with a headline metric, then let the viewer drill down to details. For instance, first show quarterly totals, then offer visuals that break data by region or product.
Imagine a store manager using your project in Power BI to decide where to allocate marketing dollars next quarter. If your dashboard shows trends, performance gaps, and customer behavior patterns, the manager can make a confident choice.
Real World versus Real Time in Projects
A real-time project in Power BI is one that updates as data comes in. This is valuable for operations like tracking daily sales or monitoring support tickets. To make a project real-time:
- Connect to live data sources such as Azure SQL or streaming services.
- Set refresh schedules so the dashboard reflects today’s data.
- Use alerts to notify stakeholders when critical KPIs exceed thresholds.
Live interactive dashboards help teams spot anomalies and respond without delay. For example, if revenue drops sharply on a Friday morning, a live dashboard can trigger a notification to the sales head before the end of the day.
GitHub as a Power BI Resource Library
If you search GitHub for Power BI projects github you will find many open repositories with project files and datasets. These are excellent for:
- Seeing how others structure their reports
- Understanding how they model relationships
- Downloading PBIX files for hands-on analysis
Projects like beginner dashboards, portfolio collections, and topic-specific analysis are all there. When you download a project from GitHub, treat it like a textbook you can open, inspect, and reverse engineer.
Also Read: Why Power BI is Essential for Data Scientists and Analytics Professionals?
Real World Power BI Projects and Business Use Cases
Once I got comfortable with basic dashboards, I started building Power BI projects that looked like real business systems. These were not just charts. They were tools that helped teams track work, money, and risk. This is where learning becomes powerful. When a dashboard with various data visualization techniques reflects daily operations, you start thinking like an analyst and not just a report builder.
Many people search for Power BI real-time projects because they want to build something that feels alive. A real project connects to business processes. It updates often. It answers questions that matter today, not last year.
Power BI in Project Management
Project management creates a lot of data. Teams track deadlines, budgets, tasks, and risks. All this data fits well inside Power BI in project management use cases. A project management dashboard Power BI solution can show:
- Task completion rate
- Budget used versus planned
- Delayed milestones
- Resource workload
This helps managers see project health in one screen. Instead of reading long reports, they look at a Power BI project status dashboard and act quickly.
Before building such a dashboard, I define the structure clearly. Below is a simple layout I follow when designing a Power BI project management dashboard.
| Dashboard Section | What It Shows | Why It Matters |
| Overview Panel | Total budget, % complete, deadline status | Gives instant project health |
| Timeline View | Gantt-style task timeline | Shows delays and overlaps |
| Resource View | Hours assigned per team member | Prevents burnout |
| Risk Tracker | Open risks by severity | Helps with early action |
This table style approach keeps the dashboard focused. It also supports Power BI project controls because you can monitor cost, time, and scope in one place.
Using Power BI With Project Online
Many companies use Microsoft Project Online to manage tasks. Data from that system can feed directly into Power BI and Project Online reports. When I work on a project online and Power BI solutions, I usually pull:
- Task lists
- Resource assignments
- Cost data
- Schedule variance
This allows the creation of Power BI project management dashboard examples that update when the project plan changes. A live link between systems reduces manual work. It also makes reports more reliable. Microsoft explains how Power BI connects with project tools in their documentation.
Example: Insurance Performance Dashboard
An interesting Power BI insurance project focuses on policy sales, claims, and risk exposure. Insurance companies track:
- Number of active policies
- Claim amounts by region
- Fraud risk indicators
- Agent performance
A Power BI project dashboard for insurance might include a map showing claim hotspots. It may also have a trend chart for monthly claim volume. This helps leaders see where risk is rising.
You can also build a Power BI example project-style insurance dashboard using open datasets. The insights were simple yet useful. For instance, certain regions had higher claim frequency during monsoon months. Weather data can explain patterns like this. Climate-related losses have increased globally over time, according to industry reports. Connecting external factors to business data makes the project richer.
Also Read: Learn Data Visualization with Power BI in 2 Hours
Implementation Planning for Business Projects
When a company adopts dashboards across teams, planning matters. A Power BI implementation project plan helps organise the rollout. Before showing the steps, I explain why this plan matters. Without planning, reports stay unused. Below is a simple implementation flow.
| Phase | Key Activities | Outcome |
| Requirement Gathering | Meet stakeholders and define KPIs | Clear goals |
| Data Preparation | Clean and model data | Reliable dataset |
| Dashboard Design | Build visuals and layout | Usable reports |
| Testing | Validate numbers with users | Trust in data |
| Deployment | Publish to Power BI Service | Team access |
| Training | Teach users how to explore | Better adoption |
This process supports large-scale Power BI project management efforts.
Freelance and Portfolio-Oriented Projects
Many learners want Power BI freelance projects to build income streams. A strong way to prepare is by creating mock client dashboards.
You can build:
- Sales performance dashboards for a retail store
- Expense tracking dashboards for small businesses
- Social media analytics reports
These Power BI projects, freelance-style, show practical ability. When added to a portfolio, they become strong Power BI projects resume assets. Freelancers who show real dashboards often stand out. Visual proof builds trust.
Choosing between data science and data analytics can feel confusing when both paths seem exciting and future-ready. Each role works with data, yet the focus, tools, and day-to-day responsibilities can differ in meaningful ways. Understanding how these career tracks compare in terms of skills, problem-solving approach, and industry demand can help learners decide where they see themselves growing.
Building Projects That Look Professional
A professional project has three layers. First comes data. Second comes logic. Third comes presentation.
Before listing them, I explain why they matter. If data is messy, insights break. If logic is weak, numbers mislead. If the presentation is poor, nobody trusts the result. Here is how I structure Power BI sample projects for a portfolio.
| Layer | What I Focus On | Result |
| Data | Clean columns, correct types, remove blanks | Reliable numbers |
| Logic | Strong DAX measures, clear KPIs | Meaningful insights |
| Presentation | Simple layout, readable visuals | Easy decisions |
This structure works well for Power BI developer projects because it shows technical depth and business sense together.
Adding Downloads and Reusable Assets
People love hands-on learning. Offering a Power BI project download or Power BI projects download link helps others explore your work.
When sharing files, I include:
- The PBIX report file
- The dataset in CSV format
- A short Power BI project documentation PDF
- A Power BI project plan template
This turns a simple report into a full learning package. Many learners search for Power BI projects github resources for this reason. GitHub allows version control and easy sharing.
Templates That Speed Up Work
Templates save time. I keep a folder of Power BI project management templates and layout starters. A template may include:
- Pre-styled KPI cards
- Standard color themes
- Navigation buttons
- Placeholder charts
Using templates keeps branding consistent. It also speeds up delivery when working on multiple Power BI online projects.
Also Read: Creating Reports and Dashboards in Power BI: Best Practices and Tips
Good Practices for Power BI Projects
I encourage everyone to build a habit. A useful routine could be:
- Pick a dataset on Monday.
- Define your project goal by Tuesday.
- Build visuals by Wednesday.
- Refine and document the project by Friday.
At the end of each project, write a short project documentation file that includes:
- What the project did
- What data was used
- What insights did you find
- How the dashboard answers business questions
Strong documentation is often as valuable as the dashboard itself.
Creating a Strong Project Dashboard Layout
A dashboard layout should guide the eye. I follow a top-to-bottom flow. First comes the summary. Then comes the detail. Then comes deep analysis.
Before adding visuals, I sketch the design on paper. This keeps the Power BI project dashboard examples structured. Here are the layout zones I often use.
- Top left for KPI cards
- Top right for trend lines
- Middle for comparison charts
- Bottom for detailed tables
This pattern works well in Power BI developer projects because it balances high-level and low-level views.
Power BI Project Documentation
Documentation sounds boring. It is actually powerful. A clear Power BI project documentation file makes your work easier to share. Before sharing any dashboard, I prepare a short document with:
- Data sources used
- Cleaning steps done in Power Query
- Measures created in DAX
- Filters applied
- Refresh schedule
This becomes the Power BI project explanation for anyone who opens the file later. It also helps during interviews when discussing Power BI resume projects. Good documentation shows that you understand both data and business logic.
Finding Datasets and Project Assets
Without data, you can’t build meaningful work. Here are reliable ways to find real data for your Power BI practice project:
Sources for quality datasets
- Search GitHub for Power BI projects github repositories with PBIX and CSV files. Many include datasets you can start from.
- Use the official Power BI sample datasets available directly from Microsoft. These are designed to be loaded into Power BI as starting points.
- Look for niche collections on GitHub like dashboards for movies, HR metrics, financial analysis, and more.
- Explore open data portals like Kaggle or data.world and save the CSVs for your projects.
A strong practice habit is to have a folder on your system titled “Practice Data.” Every time you find a dataset that interests you, download it and file it there. When you want a Power BI practice project, you will never be empty-handed.
Also Read: Microsoft Power BI: The Ultimate Tool for Business Analytics and Intelligence
Career Growth Through Power BI Projects
Different industries need different dashboards. Building variety in Power BI projects for practice makes you flexible.
You can build:
- Retail sales dashboards
- HR attrition dashboards
- Marketing funnel dashboards
- Finance cost analysis dashboards
Each one becomes a Power BI project sample that shows a different skill. Employers value adaptability. Data jobs are growing fast across industries. The US Bureau of Labor Statistics projects strong demand for data roles in the coming years.
Freelance Readiness Through Live Style Projects
Clients like to see working systems. That is why Power BI live projects and real time project in Power BI builds are powerful in freelance portfolios. A small business owner may want:
- Daily sales tracking
- Expense monitoring
- Customer trend analysis
When I design Power BI freelance projects, I include filters and drill-through pages. This makes the dashboard interactive and useful for daily use. These types of Power BI projects freelance builds can be shown during client calls. Seeing a live dashboard builds confidence.
Organising Your Online Project Presence
Today, many professionals share work online. A strong Power BI project online presence increases visibility. You can publish:
- Dashboards on Power BI Service
- Code and files on GitHub
- Project summaries on LinkedIn
This creates a portfolio trail. When someone searches for Power BI online projects, your work can appear. Adding a short write-up for each project in Power BI helps viewers understand the goal quickly.
Power BI Project Controls and Status Tracking
Large projects need monitoring. A Power BI project status report helps teams stay aligned. A simple Power BI project status dashboard might show:
- Tasks completed
- Budget spent
- Issues open
- Timeline variance
This connects well with project management Power BI use cases. Managers can see progress without long meetings.
Exploring career opportunities in data science often starts with understanding the variety of roles available, how the field is evolving, and what compensation trends look like. A clearer view of job titles, required skills, and growth areas helps learners see where they might fit within the broader data ecosystem.
Advance Your Data Skills with Imarticus Learning
Working on Power BI projects is a strong way to build practical confidence, but many learners eventually want deeper structure, broader tools, and exposure to real industry workflows. That is where guided programs can make a difference.
The Postgraduate Program in Data Science and Analytics offered by Imarticus Learning connects hands-on project work with broader skills in analytics, machine learning, and business problem-solving. For learners who want to turn project-based practice into long-term career readiness, exploring such programs can be a natural next step.
- 100% Job Assurance with Guaranteed Interviews: The program provides 10 guaranteed interview opportunities with top companies, helping learners move confidently into data roles.
- Hands-On Projects and Real Internships: Learners work on real business use cases and advanced data challenges through internships, which strengthen their project portfolio.
- Built-In GenAI Skills: The curriculum includes in-demand Generative AI training to equip learners with future-ready analytics and automation capabilities.
- Industry-Aligned Hands-On Curriculum: Learners master Python, SQL, data analytics, machine learning, and visualization through structured modules that mimic real work scenarios.
- NSDC Certified Credential: On completion, learners earn an NSDC-backed certification that boosts credibility in the job market.
- Project Portfolio Focus: The course ensures that learners build a portfolio of impactful, real-world projects, which is key to showcasing practical Power BI and analytics skills.
FAQs About Power BI Projects
When people begin working on Power BI projects, a lot of practical questions come up around learning time, career value, project ideas, etc. This section answers the most frequently asked questions so you can move forward with more confidence in your Power BI learning journey.
What is the Power BI project?
A Power BI project is a structured effort where data is collected, cleaned, analysed, and presented through dashboards and reports. In real Power BI projects, the goal is to answer business questions using visuals and metrics. These projects often include a data model, DAX calculations, and interactive reports that help users make decisions based on insights.
What are some good Power BI project ideas?
Good Power BI projects include sales performance dashboards, HR analytics, financial tracking, and marketing campaign analysis. Many learners start with projects in Power BI for practice, such as retail sales or website traffic. Imarticus Learning often suggests industry-style dashboards so learners can work on business-focused scenarios.
Can I learn Power BI in 1 day?
You can learn the basics in a day, but real confidence comes from building Power BI projects over time. Practice helps you understand data modeling and DAX. Small Power BI practice project builds done regularly, improving skills faster than only watching tutorials.
Is Power BI still in demand in 2025?
Yes, Power BI remains in strong demand as companies rely more on data-driven decisions. Many organizations adopt dashboards as part of their digital strategy, which increases the need for professionals who can build Power BI projects that deliver insights. Business intelligence tools continue to grow in enterprise environments.
Is Power BI a good career?
Working on Power BI projects can lead to roles in business intelligence, data analysis, and reporting. Companies need people who can turn raw data into useful dashboards. Structured programs such as those from Imarticus Learning help learners prepare for real business reporting tasks.
How to start Power BI projects?
Start Power BI projects by choosing a dataset and defining a clear question. Then clean the data, build measures, and design a simple dashboard. Begin with Power BI sample projects before moving to complex real-time systems.
Is Power BI better than Excel?
Excel is great for spreadsheets, while Power BI projects handle larger data and interactive dashboards. Power BI also supports better sharing and automation. Many professionals use both tools together for reporting workflows.
What are the 5 components of Power BI?
The five main parts often discussed in Power BI projects are Power BI Desktop, Power BI Service, Power BI Mobile, Power BI Gateway, and Power BI Report Server. These components work together to create, publish, and share dashboards across teams.
From Learning to Doing with Power BI Projects
Working on Power BI projects changes how you see data. Numbers stop feeling random. They start telling stories. Each dashboard you build sharpens your thinking. You begin to spot patterns faster. You learn to ask better questions. You gain confidence in turning raw data into something useful.
Consistency matters more than complexity. Small projects done regularly build stronger skills than one big project done once. Try new industries. Work with messy data. Improve your layouts. Add better calculations. Each step makes you more comfortable with business problems and data tools.
If you want more structure while building these skills, learning within a guided environment can help. The Postgraduate Program in Data Science and Analytics offered by Imarticus Learning combines analytics concepts with practical Power BI projects, making the journey smoother.
Keep building. Keep exploring. Every new dashboard brings you one step closer to becoming someone who can turn data into decisions.