

These days, businesses don’t struggle with a lack of data; what they struggle with is understanding it. Spreadsheets are still useful, but they’re no longer enough on their own. Managers want quick answers, teams want clear reports, and companies want decisions based on facts, not guesswork. That’s where the Power BI tool comes in.
If you’ve ever looked at raw data and wondered what it actually means, spent hours making reports that no one really used, or found it hard to explain numbers to non-technical people, you’re not alone. This is something almost every professional runs into at some point.
Power BI was built to make this easier. Tools like Power BI help you turn messy data into clear, interactive dashboards, without needing to be a data scientist or learn coding. Instead of just showing numbers, Power BI helps you tell a story with data.
For many learners, Power BI is also the first step into the wider world of analytics. That’s why programs like the Postgraduate Program in Data Science and Analytics treat Power BI as part of a bigger picture, alongside skills like SQL, Python, and data analysis, so learners don’t just learn a tool, but learn how to use data in real work situations.
In this guide, I’ll break down what the Power BI tool is, how it works, where it’s used, and why it has become such a valuable skill across industries.
Lesser-known fact:
Power BI isn’t just used by analysts. In many organisations, senior leaders only ever see data through Power BI dashboards. For them, Power BI is the business view of reality.
What is the Power BI Tool and Why Businesses Use It Today
I often hear a lot of assumptions around Power BI Tools. So, before we start understanding the tools, I will clarify: what is Power BI in simple terms? Power BI is a business intelligence and data visualisation platform developed by Microsoft that helps organisations collect data from multiple sources, clean it, analyse it, and turn it into interactive reports and dashboards.
Businesses use the Power BI tool because it gets them answers to critical questions about their data. The Power BI Tool is widely adopted as:
- It works with Excel, SQL, cloud platforms, and hundreds of data sources.
- It does not require deep coding knowledge to get started.
- Reports are interactive, visual, and easy to share.
- It scales from small teams to large enterprises.
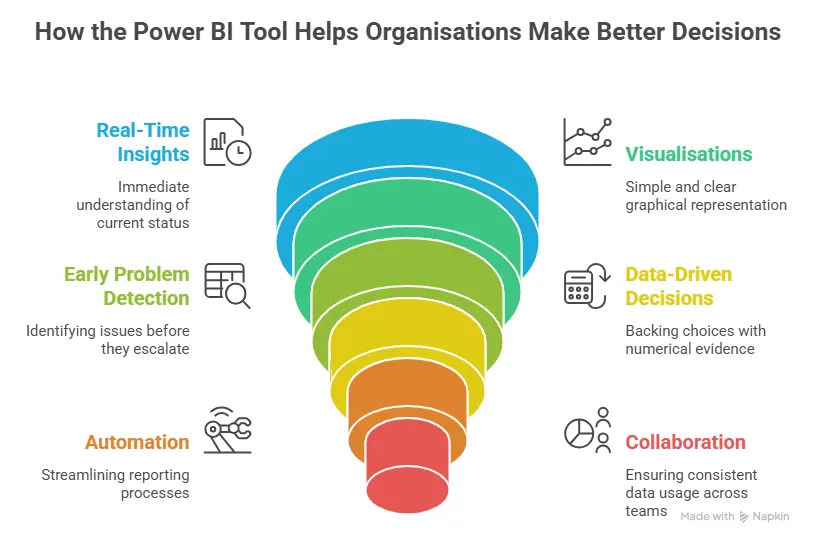
In short, power BI tool goes far beyond reporting; it supports smarter decision-making across the organisation.
If you’re curious about what data analysts actually do on the job, not just the tools they use. Check out this short video that gives a clear, real-world look at the role.
Overview of Power BI Tools
Many beginners assume Power BI is just one tool. In reality, it’s a suite of tools, each serving a specific purpose.
| Power BI Tool | Purpose | Common Job Roles That Use It |
| Power BI Desktop | Report creation and data modelling | Data Analyst, Business Analyst, Finance Analyst, MIS Executive |
| Power BI Online Tool (Service) | Cloud-based sharing and collaboration | Managers, Team Leads, Business Heads, Analysts |
| Power BI Mobile | Viewing reports on mobile devices | Senior Management, Sales Managers, Operations Heads |
| Power BI Gateway | Secure connection to on-premise data | Data Engineer, BI Engineer, IT Administrator |
| Power Query | ETL (Extract, Transform, Load) | Data Analyst, Business Analyst, Data Engineer |
| DAX | Calculations and business logic | Power BI Developer, Data Analyst (Intermediate-Advanced) |
| Power BI Developer Tools | Custom visuals and automation | Power BI Developer, BI Engineer, Data Engineer |
Understanding this power BI tools list helps learners and professionals focus on what matters most for their role.
Did you know?
Most Power BI users only actively use 2-3 tools from the full Power BI tools list. You don’t need to master everything at once; your role decides what actually matters.
Power BI Desktop vs Power BI Online Tools
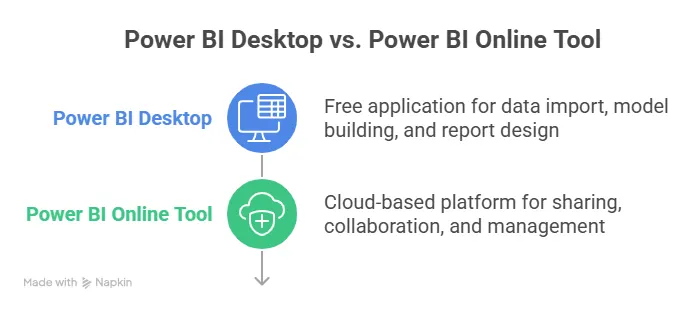
Many assume that Power BI Desktop and the Power BI Online tool are two completely different products. In reality, they’re designed to work together.
The easiest way to think about it is this: Power BI Desktop is where you do the work, bring in the data, clean it up, build your models, and create reports. Once that’s done, the Online tool, also called the Power BI Service, is where those reports live. That’s where you share them, view them, and discuss them with your team.
So, in simple terms, you build your reports in Desktop and share them online.
Most professionals use both without even thinking about it. Analysts spend their time in the desktop, while managers and stakeholders usually see everything through the Online version.
| Feature | Power BI Desktop | Online Power BI Tool |
| Installation | Required | Browser-based |
| Report creation | Yes | Limited |
| Sharing | No | Yes |
| Collaboration | No | Yes |
| Cost | Free | Subscription-based |
If you’re wondering how to actually become a data analyst, this video breaks it down step by step. It gives a clear picture of what to learn, where to start, and how the role looks in today’s job market – especially useful if you’re planning your next move.
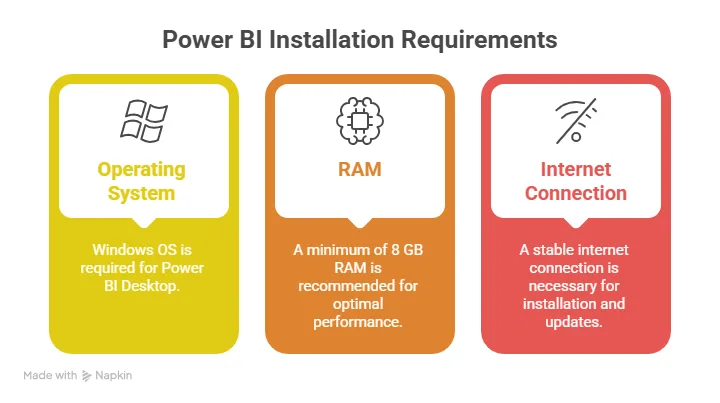
How to Get Started With Power BI Tool Setup
Getting started with installation is easier than most people expect.
Here’s a step-by-step guide to download the Power BI Tool:
- Visit the official Microsoft store or website.
- Click the download Power BI tool.
- Install Power BI Desktop on your system.
- Sign in using a work or school email (It is recommended to use an official email address.)
This Power BI tool download is completely free and sufficient for beginners.
Once installed, you’re ready to explore real data visualisation with Power BI.
Quick insight:
In real workplaces, analysts spend 80-90% of their time in Power BI Desktop, while managers may never open it at all. They interact only with the online version and dashboards.
Core Power BI Tools
This is where Power BI really starts to show its value. Once you understand the basics, these core Power BI tools are what turn Power BI from a basic reporting tool into something teams actually rely on.
Power BI Reporting Tool
The Power BI reporting tool allows users to create:
- Interactive charts
- Tables and matrices
- KPI cards
- Filters and slicers
Reports are designed to answer business questions, not just display numbers.
Power BI ETL Tool (Power Query)
The Power BI ETL tool is used for:
- Cleaning messy data
- Removing duplicates
- Merging datasets
- Standardising formats
The best part? It works with clicks, not code.
Power BI Documentation Tool
As reports grow, documentation becomes critical. The Power BI documentation tool helps teams:
- Track datasets and measures
- Maintain governance
- Reduce dependency on individuals.
This is especially valuable in enterprise environments.
Quick insight:
Power BI isn’t about becoming “technical”. It’s about becoming clearer. Many people learn it simply because they’re tired of explaining numbers verbally.
Power BI Developer Tools
For those who want to go beyond standard reports, Power BI developer tools open new possibilities.
These tools are for when you want more control, maybe cleaner logic, smarter calculations, or visuals that behave exactly the way you imagine. This is also where Power BI stops feeling like just a reporting tool and starts feeling like something you can really build with.
The good news is, you don’t have to start here. Most people don’t. You usually grow into the developer side naturally, as your confidence and curiosity increase.
Power BI Developer Tools Download
Most developer tools are extensions or SDKs provided by Microsoft. A Power BI developer tool download is typically done through:
- Power BI Developer Portal
- Visual Studio integrations
Developers often combine Power BI Certification with cloud services for advanced analytics. The Power BI Developer Tools enable custom visuals using JavaScript, advanced DAX calculations, automation via APIs, and embedding reports into applications.
Quick insight:
Row-level security is one of the biggest reasons large organisations trust Power BI. The same report can safely show different data to different users without creating multiple versions.
Advanced Power BI Tools
As data grows, simple dashboards aren’t always enough; advanced features and interactive dashboards become essential. What worked when you had a few files and small datasets starts to break down when the numbers get bigger, the questions get tougher, and more people depend on your reports. That’s where advanced Power BI tools come into play.
Power BI Migration Tool
The Power BI migration tool is used when:
- Moving reports between environments (dev to prod)
- Upgrading legacy BI systems
- Scaling Power BI across departments
Enterprise-Grade Capabilities offered by Power BI Tools:
- Row-level security
- Incremental refresh
- Large dataset handling
- Centralised governance
These features make Power BI suitable for large organisations, not just small teams.
Did you know?
Many Power BI developers start as business or finance analysts. They don’t begin as developers – the technical depth comes naturally once the business understanding is strong.
Power BI vs Other Reporting Tools
This is a question that comes up all the time – Power BI tools vs other reporting tools. With so many options available, it’s natural to wonder which one actually makes sense in real work situations.
The truth is, no tool is “perfect” for everyone. But most teams aren’t looking for perfection; what they want is easy to use, reasonably priced, and powerful enough to handle real business data. That’s where the Power BI tool stands out. It strikes a practical balance between usability, visual quality, and cost, which is why so many organisations choose it.
Here’s a simple comparison to make things clearer.
| Tool | Easy to Use | Affordable | Strong Visuals | Strong Ecosystem |
| Power BI | ✅ | ✅ | ✅ | ✅ |
| Tableau | ❌ | ❌ | ✅ | ❌ |
| Qlik | ❌ | ❌ | ✅ | ❌ |
| Excel | ✅ | ✅ | ❌ | ✅ |
Power BI often comes out on top because it doesn’t force trade-offs. You don’t have to choose between cost and capability or between ease of use and power. For many teams, it simply gets the job done – without unnecessary complexity.
Lesser-known fact:
In many companies, Power BI replaces not just other BI tools, but also dozens of Excel files, email reports, and manual trackers, all at once. Power BI drives business success.
Real-World Power BI Tool Uses Across Industries
One of the biggest reasons Power BI has become so popular is its flexibility. It isn’t built for just one department or one type of role. Wherever there’s data and a need to make better decisions – Power BI fits in naturally.
Different teams use the Power BI tool in different ways, but the goal is always the same: understand what’s happening and act on it faster.
| Team / Function | How Power BI Is Used | Business Value |
| Finance | Budgeting, variance analysis, forecasting | Track actuals vs budgets in real time and identify issues early |
| Marketing | Campaign performance tracking, ROI analysis | Understand which channels work and optimise marketing spend |
| Sales | Pipeline analysis, target tracking, conversion monitoring | Spot stalled deals and identify top-performing reps or regions |
| Operations | Process efficiency tracking, cost control | Identify bottlenecks, delays, and operational waste quickly |
| HR | Attrition analysis, workforce planning, hiring trends | Detect patterns early and plan staffing more effectively |
These real-world Power BI tool uses show why it’s such a versatile platform. It adapts to how teams actually work, making data useful not just for analysts, but for everyone involved in decision-making.
Did you know?
Power BI is often used first in finance teams. Once leadership sees the value, other departments quickly follow: marketing, sales, operations, and HR.
Who Should Learn the Power BI Tool?
One of the best things about Power BI is that it’s not built only for “data people.” It’s designed for anyone who works with numbers, reports, or decisions – which is why so many different professionals end up using it.
If you’ve ever thought, “I wish I could understand data better” or “I want my reports to actually make sense to others,” Power BI is worth learning. All you need to know is the best practices for Power BI.
| Why Power BI Is Beginner-Friendly | How it helps you |
| No coding required at the start | You focus on understanding data, not writing code |
| Familiar with Excel users | Concepts feel natural if you’ve used spreadsheets |
| Learn step by step | Start with simple reports and grow into advanced features |
| Low learning pressure | Less intimidating than many other analytics tools |
Who Benefits the Most from Learning Power BI?
Power BI fits naturally into a wide range of roles. Here are a few people who benefit from Power BI:
- Students and fresh graduates who want job-ready, practical data skills.
- Finance and accounting professionals looking to automate reporting and gain deeper insights.
- Business analysts who want to build clearer, more impactful dashboards.
- Managers and consultants who need quick insights to support decisions.
- Career switchers aiming to move into data, analytics, or business intelligence roles.
In short, if your work involves data, as most roles do today, learning Power BI can make you faster, more confident, and more valuable at work.
If you’re thinking about a bigger leap into data and AI, this video walks you through how you can go from having no technical background to becoming an AI expert.
How Imarticus Prepares You for Real-World Power BI Roles
Learning tools like Power BI, Python, or SQL is one thing. Knowing how to use them when you’re staring at a real business problem is another. That’s where many people feel stuck.
Most learners don’t struggle because they aren’t smart enough. They struggle because they’ve only seen clean examples and step-by-step demos. Real data doesn’t work like that. It’s messy. The questions aren’t clear. And someone always asks, “So what does this mean for the business?”
At Imarticus Learning, the focus is on closing that gap through the postgraduate program in data science and analytics.
What learners actually do:
- Hands-on projects: Spend time working with real datasets, not textbook examples.
- Industry-relevant datasets: Practice solving problems end-to-end, from understanding the question to presenting insights.
- End-to-end reporting workflows: Learn how different tools fit together, the way they do in real jobs.
- Business-first thinking: Build confidence by applying skills repeatedly, not just watching videos.
Instead of just teaching you one tool after another, the learning is structured around real situations – working with imperfect data, figuring out what matters, and explaining insights in a way others understand. Tools like Power BI, Python, SQL, and Tableau are used as part of that process, not taught in isolation.
Over time, learners stop worrying about “Am I using the right feature?” and start thinking, “Does this answer the problem?”
If you’re serious about moving into data analytics or data science and not just collecting tools on your resume, this kind of learning helps things finally click.
FAQs About the Power BI Tool
If you’re new to Power BI, this section answers some of the most common questions people ask when they’re trying to understand what the Power BI tool is, how it’s used, and whether it’s right for them.
What is the Power BI tool?
Power BI is a tool that helps you understand your data without digging through spreadsheets and trying to figure out what the numbers mean. It shows you the answers visually. You can see what’s going well, what’s not, and what needs attention quickly. You don’t need to be technical or “good at data” to use it. It just helps you make sense of what’s already there.
What is Power BI most used for?
Power BI helps to track performance, notice trends, and spot problems early. You’ll often see it used for sales dashboards, finance reports, marketing analysis, and management reporting. In everyday terms, Power BI helps turn data into something you can actually understand and act on, instead of just numbers on a screen.
How do I download the Power BI tool?
Downloading it is simple. You just go to Microsoft’s website or the Microsoft Store and start the Power BI tool download. The download Power BI tool option is free, and once it’s installed, you can start practising immediately. This is why so many beginners choose Power BI as their first BI platform.
Is Excel a Power BI tool?
No, Excel isn’t a Power BI tool. It’s part of Microsoft Office. That said, the two work really well together. Excel is what you use when you’re trying to make sense of the numbers yourself, doing calculations, fixing data, or just exploring things. Power BI is better for creating interactive dashboards and large-scale reporting. In real life, people usually use both together. Excel helps you think. Power BI helps you explain.
Can I learn Power BI in one day?
You can get a feel for it in one day. You’ll probably learn how to load some data, make a few charts, and see what Power BI can do. That’s enough to get curious, but not enough to be confident. Power BI starts to make sense only when you actually use it on real data. That’s why a structured course helps. With courses from reputed institutes like Imarticus Learning, you’re guided step by step. You’re not just watching videos, you’re learning how Power BI is used in real work situations.
What are the top 5 BI tools, and how does Power BI compare?
The BI tools you’ll hear about most often are:
- Power BI
- Tableau
- Qlik
- Looker
- SAP BI
Power BI also fits naturally into organisations that already use Microsoft products like Excel, Teams, or Azure. For many businesses, that makes it the more practical choice – not because it’s the most complex tool, but because it gets the job done without unnecessary friction.
Which tool is used in Power BI?
Power BI tool is a small ecosystem. You have Power BI Desktop for building reports, the Power BI online tool for sharing and collaboration, Power Query for cleaning data, and DAX for calculations. When people talk about the Power BI tools list, they’re usually referring to this full setup working together.
Is Power BI a tool or a skill?
It’s actually both. Power BI is a tool you install or use online, but knowing how to use it well becomes a skill. Employers don’t just want someone who has theoretical knowledge of Power BI – they want someone who can use it to explain data clearly and support business decisions. That’s where the real value lies.
Your Next Step with the Power BI Tool
If you’ve read this far, you already know the Power BI tool isn’t just “nice to have”. It’s one of those skills that quietly changes how you work. Suddenly, numbers make more sense. Meetings feel easier. And instead of guessing, you can actually show why something is happening.
The good part is that you don’t need a technical background to begin. You can start with the free version of Power BI Desktop, work with real datasets, and learn as you go. Progress doesn’t come from rushing through features – it comes from understanding why you’re building a report and what question it’s meant to answer.
If you want things to click faster, learning in a structured way – using business examples and hands-on projects can save you a lot of trial and error. The aim isn’t to memorise features. It’s to reach a point where someone can ask you a question, and you know how to answer it using Power BI.
So take the next step in a way that feels right for you. You can start by enrolling in the Postgraduate Program in Data Science and Analytics and get prepared for real-world situations.