How A Big Data Can Be Used In Retail Banking?

Reading Time: 3 minutes


Like in all successful business ventures, the field of banking is no exception. Big Data drives decisions. The successful use of such large-volume data-based applications already exists and is hugely popular too. Retail banks are big data-driven with nearly all its processes being already supported by such data to deliver business value to their customers.

Their advantages and competitive value is data fueled and depends on the insights provided by the most effective use of such data. It is surprising that in spite of having had access to such large databases for over a decade now, Retail Banking is yet to exploit the numerous benefits uses of big data in retail-banking can bring in.

A data analyst Retail Bankingintern or freshman makes a handsome payout package and the range of the salary depends on the skill-set, certification, and experience. The skills required can vary depending on the employer and industry. As they climb the ladder the promotions depend on continuous skill up-gradation, managerial and leadership skills. Hence, soft-skills and personality development are also important attributes.

Big Data transformation benefits:

With the move by customers to digital transactions many banks did invest substantial efforts in dedicated teams, advanced analytics, appointing data officers, and upgrading their infrastructure. The early adapters are the survivors and have evolved more competitive as new-age banks offering customer-need based services based on Big Data insights. There are many areas where banks are yet to ramp up their use of big data to reap benefits according to the Boston Consulting Group’s reports.

The three main abilities that are leading transformations are: 

  • Data: Multi-source multi-system huge volumes of data petabytes being available which include high definitions of detail and features.
  • Models and ML: The models are now more insightful thanks to the evolution of better ML software which enables decisions and predictions that are data-driven.
  • Software technology: The hardware-software clustering technique in software like Hadoop has proven to be big-data centric and allowing use of complex databases non-structured and structured in a cost-effective manner.

There are at least six areas in Retail Banking which focused and coordinated big-data programs can lead to substantial value for banks in the form of increased revenues and bigger profits.

IMPROVING CURRENT PRACTICES WITH POINT ANALYTICS: Applications of big data analytics for individual needs can be simple and yet powerful with the point analytics method.

TRANSFORMING CORE PROCESSES WITH PLATFORM ANALYTICS: Big data and point analytics can be used to improve customer risk assessment and for effectively tapping the marketing potential measures analyzed.

TRANSFORMING CORE PROCESSES WITH PLATFORM ANALYTICS: Big data applications can transform the collection process with step-by-step optimization to bring in a 40 percent savings in terms of writing off bad debts, with effective use of mining outdated customer information, their predispositions, and newer behavioral models.

BOOSTING IT PERFORMANCE: Big-data IT technologies should have need-based linear scaling to reduce costs. Data-intensive models, mining omnichannel customer experience, balancing data warehouse workloads and effective leveraging of data can help.

CREATING NEW REVENUE STREAMS: 

A European bank used new architecture, hybrid data-warehousing combining banking tech and big-data by clustering the Hadoop commodity servers. Budget savings were 30 percent with all functionalities!

GETTING THE MOST FROM BIG DATA: 

This involves these basic steps of infra and people management detailed below: 

Assess the present situation: Banks needs to bring in newer innovative applications as a differentiator from the competition where all organizational levels collaborate to contribute to the use and needs-based model.

Be Agile: The agile requirements of communication, collaboration, and contribution across all processes will help big data transform them.

Critical capability cultivation: If not implemented the cultivation of critical capabilities can hinder the big data transformation of processes. Limiting the capability to the vision essentials is recommended in all domains of big data capabilities.

The three domains of Big data capabilities that Retail Banking should question itself about are: 

  • The usage of data
  • The engine driving the data
  • The ecosystem of the data

Retail banks should necessarily explore and act on these domains effectively by using smaller discrete programs to take their strategy to execution.

Conclusion:

BIG business for all banks comes from effectively exploring Big Data. Such large institutions who cash in early will stay ahead of the other banks by adapting technology into the very fabric of their banks for its many benefits.

The future holds great promise for development in the field of Retail Banking and to make a high-paid scope-filled career even without experience. Start your Big Data Analytics Course at Imarticus Learning and take advantage of their assured placements and certification. All the best with your career in big data and retail banking!

For more details, you can also contact us through the Live Chat Support system or can even visit one of our training centers based in – Mumbai, Thane, Pune, Chennai, Banglore, Hyderabad, Delhi, Gurgaon, and Ahmedabad.

Top 7 Reasons to Convince You To Take on that Data Analytics Job

Reading Time: 3 minutes


It’s more than just a buzzword, it’s a revolution– data analytics is here and here to stay. For four years in a row, data analytics was ranked the best job in the U.S. alone by Glassdoor in 2019. The data fever is catching on in other parts of the world too, as global economies become more interdependent and related.

More and more companies and industries are embracing data analytics, not least because it’s a science that delivers valuable insights applicable across all plans including business and marketing.

If you’re still hesitating about whether to go for a career in data analytics, allow these top 7 reasons to convince you:

#1: It’s in demand

Data analytics is one of the most in-demand jobs in the world today. This is because all industries need data-driven insights to make even changes, be it to pick a marketing option during A/B testing or rolling out new products. Data analytics is a high-skills, high-stakes job, which is why companies are ready to hire those willing to think creatively and derive data-based solutions to business problems.

#2: It’s easy to start

Educational institutions and course providers have sat up and taken notice of the demand for data analysts, leading them to introduce related training courses. Regardless of whether you’re a fresher or a professional in the tech field, data analytics training can help you start from scratch and build a portfolio of projects to showcase your skills These courses also provide tutorials in essential data analytics software such as Hadoop, Sisense and IBM Watson.

#3: There are plenty of job roles

Within the data analytics field, there are job roles that span academic divisions and aren’t restricted to engineering or software alone. Data scientists, systems analysts and data engineers will benefit from a background in the aforementioned academic fields. However, statisticians and digital marketing executives can look into roles such as quantitative analysts, data analytics consultants and digital marketing managers to put their skills to good use.

#4: The pay is good

The average salary in the data analytics field is US$122,000– a testament to how in-demand the profession is and how in dire need companies are of skilled employees. The figures vary depending on the role and job description but suffice to say that the pay is often much better than other technical jobs that people still seem to hover to by default. It’s also dependent on what industry you will work for, in what capacity and towards which goals.

#5: Growth opportunities abound

Technology is a dynamic field and with new changes come the chance to upskill, pick up new software and contribute to futuristic projects. Data analytics professionals can find themselves growing through roles and projects, oftentimes being tasked to lead a team or be the sole owner of a large-scale project.

#6: Industries are interwoven

With other tech fields, you might be restricted in your tasks or limited to a company. In data analytics, however, you get to pick and choose the fields you want, whether pure tech or even retail. Data analytics is in use across most industries so, once you find your niche, you’re ready to start dabbling in the industry of your choice.

#7: Influences decision-making

If you’ve ever wanted to be part of the larger organizational or business structure and contribute positively, chances are data analytics might be the niche for you. The insights that emerge from analyses of data can power strategies and create new business plans. This way, your contribution leads to progress on an organizational scale and your work can make or break a business.

Data analytics gives you the opportunity to become a more active stakeholder and contributor to any business regardless of the industry, so take the leap today.

Solve Real-world Text Analytics Problems With NLP!

Reading Time: 3 minutes

Solve Real-world Text Analytics Problems With NLP!

Natural language processing (NLP) helps machines analyze text or other forms of input such as speech by emulating how the human brain processes languages like English, French, or Japanese. NLP consists of ‘natural language understanding’ and ‘natural language generation’ which help machines create a summary of the information or assist in taking part in conversations.

With the advent of natural language processing, services like Cortana, Siri, Alexa, and Google Assistant are finding it easier to analyze and respond to requests from users. This is opening up many new possibilities in human-machine interactions and helping improve existing systems and services.

In this article, we will cover how NLP is helping provide solutions for various requirements of text analytics in different sectors.

Significance of NLP in modern times

data analytics courses

NLP can analyze massive amounts of text-based data with consistency and accuracy. NLP courses help summarize key concepts from large unstructured complex texts. It also helps in deciphering or analyzing ambiguous statements or sentences. It can draw connections and also investigate deeper meanings behind seemingly normal data in the form of text.

With the massive amounts of randomized forms of textual data that is generated on a daily basis, automation is highly necessary for this field to analyze the large amounts of data from text efficiently and effectively. Ranging from text posted on social media to customer service, natural language processing is powering text analytics which is making life easier for both consumers and corporations. 

How text analytics along with NLP is helping businesses? 

Text analytics can be described as a process of analyzing a massive or specifically targeted volume of unstructured textual data and translating it into quantitative information to gain valuable insights through patterns and trends.

With the help of additional visualization of this data, text analytics allows corporations to understand the sentiments, deeper meaning, or compact information behind this data and helps them take data-backed or data-centric decisions for improved results through better performance or profit.

These companies collect massive amounts of unstructured textual data from sources like social media, e-mails platforms, chat services, and historic data from previous interactions or third parties. This could prove to be a challenge without the help of natural language processing which powers text analytics, helping analyze the massive amounts of data without the need to stop or for human interference. 

The same amount of data, being manually processed seems like an impossible, never-ending task. Manually processing even a tiny bit of the colossal amount of data that is generated daily would definitely take a lot of manpower. Hence, it is not cost-effective and would also lead to inaccuracy and duplication. This is where text analytics comes to the rescue.

With the help of text analytics, companies can excavate meaning and sentiments from unstructured textual data sourced from social media posts, content inside e-mails, chat services, and surveys or feedback. 

This helps businesses identify patterns and trends which lead to providing customers with improved experiences by analyzing service or product issues and customer expectations through market research and monitoring with text analytics.

Natural Language ProcessingHere are some real-world applications of text analytics and natural language processing:

Customer care service

Data generated from surveys, chats, and service tickets can help companies improve the quality of customer service by increasing efficiency and decreasing the time taken in resolving problems.

Illegal activity and fraud detection 

Text analytics helps in analyzing unstructured data from various internal or external sources to prevent fraud and warn governments or companies of illegal and fraudulent activities. 

Natural Language Processing
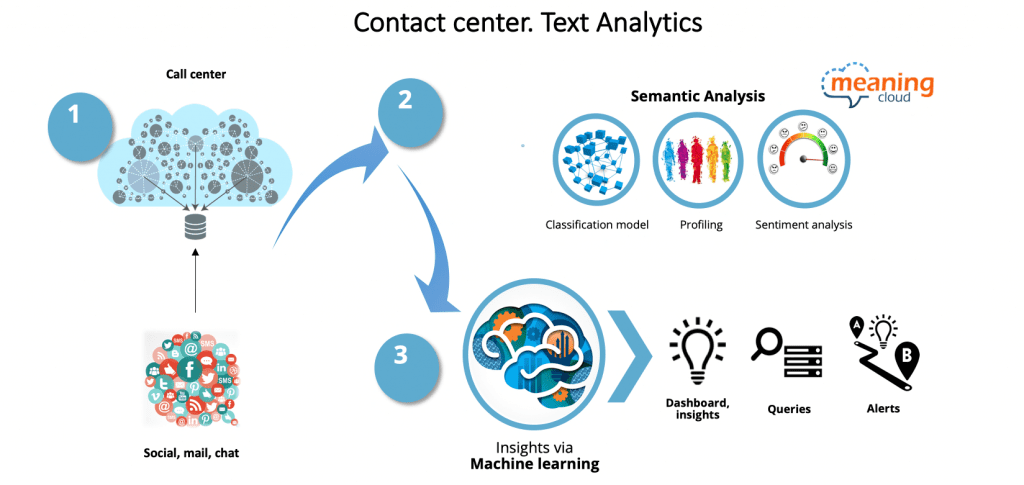
Social media analytics

Text analytics is being used by brands to analyze customer preferences and expectations through the extraction of sentiments and summarized opinions from textual data sourced from social media platforms like Facebook and Instagram. 

Text analytics and NLP are increasingly becoming more effective for companies to depend on and encouraging them to take more data-backed decisions. This need is making way for better, more accurate, and faster analytical tools and technologies in the future.

How ISPs Are Using Analytics To Help Customers?

Reading Time: 3 minutes

The world is driven by big data

Big data is everywhere. Businesses of all tastes and flavours are getting their hands on this mega resource to make their businesses competitive and also to gain useful insights that can shoot their operations to the zenith of success. Big data is loaded with multiple benefits. It churns up the data to bring out conclusions hence, giving a huge helping hand in making vital business decisions.

What are ISPs?

ISPs are nothing but people you need for the smooth functioning of your daily necessity: The Internet. Internet service providers are companies that provide internet services across various geographical locations so that people can access and use the web. This market is dominated by both large and small local players. The big players have the internet lines managed independently by them. The big players of this market are companies like AT&T, Netcom, MCI, etc.  These days a new group known as the online service providers has also come into the picture. They manage all of their operations through online mode.

ISPs and data analytics:

Internet service providers like any other sector are utilizing the applications of big data and making the most of it. Big data has become a profit-driving point for these companies. With the help of big data, the geographical boundaries are analyzed and then the reach of the internet and strength of signals and network concerns are also brought into the picture.

Analysis of data is done based on these parameters and then the expansion of business is carried on after several tests on feasibility, accessibility, etc. These providers use online advertisements to advertise their services, hence collect information based on clicks on the ads, their page staying time and their page abandonment time.

ISPs are using big data to have access to a gold mine full of data. Using analytics, possible customers are tracked down and then presented with an ad based on their individual preferences and search histories. These ads are curated automatically with the application of analytics. This data also helps in providing better customer experiences.

These service providers with the help of big data overcome the bottlenecks of Internet services such as network speeds, connectivity concerns, etc. Also, big data helps inefficient capacity planning and brings out operational excellence. Such mechanisms help these providers to foresee any upcoming issues and glitches which can make the users compromise on their user experience hence, solving it beforehand and providing a buttery smooth surfing experience.

ISPs are providing a next-level user experience with the application of big data and analytics. ISPs are using big data to mitigate a lot of problems and extracting the best out of what is available. The area which is compromised on a little is data security. Though the services providers are extracting out all the goodness of big data and giving an upgraded the internet experience to its users the data entered by its users are on huge servers floating, ready to be pounded on.

Data security is one of the biggest concerns which is bothering individual users. Users regularly feed information of personal importance and relevance to their smartphones and laptops. The data thus entered has no specific, safe place to go. It wanders in an unrestricted environment which can be extracted by anyone.

This problem is being tackled by big data to a certain extent but is being worked on so that the improvements can be made at a really quick pace in the area of data security and privacy of the users. Only data can protect data. Thus, these gaps are being filled up gradually by exploring more and more avenues of big data in this dynamic sector.

Conclusion

Internet service providers and big data are moving hand in hand. Both of them together are capturing consumer behaviour and extracting information out of it at an all-new level. Though there are certain limitations the ISPs and data analytics courses are jointly brought into force to eliminate such hindrances and emerge out with more upgrades. ISPs are sailing quickly and analytics is the captain of the boat driving it towards the island of growth dancing along the waves.

How To Encourage Your Children To Learn About Big Data And Modern Technologies?

Reading Time: 3 minutes

How To Encourage Your Children To Learn About Big Data And Modern Technologies?

Phrases like Deep Learning, Neural networks, Machine Learning or Artificial Intelligence can be a big put-off for those parents who get easily overwhelmed by the changes in digital technology which seems to change minute-by-minute. The exponential growth of data is powering it and big data analytics courses are fast becoming essential.

This is what your children inherit and grow up in. It is crucial to have them trained early on if they need to be technologically equipped to handle their daily lives and become contributors to the growth of both the economy and society at large. There is no dearth of the ignorant in places of power who have no clue regarding the present technology let alone the future technologies that are already happening!

Every country has its share of shame and court cases on the misuse of technology which stems for a complete lack of understanding of the underlying science and principles of technology. You can change that and we shall look at certain pointers that can help you along to make the future of your kids in big data analytics courses an educated and well-equipped one.

Understanding the basics:

Kids understand concepts very easily if the examples are right. Just as they learn to walk, talk in any language, and interact with others based on their experiences of watching and doing, so also complicated concepts are simpler to explain than you may think. After all, technology has existed over generations and it is those who learned to question early that became the next generation’s Einstien or Newton.

Your involvement is vital:

One of the easiest ways to update your knowledge would be to get involved in your child’s learning. Parents are the role model on which the child bases his/her behavior. Taking an interest in the learning data analysis and how modern technology will not only help you explain the simple concepts of Deep Learning, Neural networks, Machine Learning or Artificial Intelligence but will also help you understand better and make better choices as technologies advance. Ex: Buying a smartphone today involves understanding what they can do for you with Google Assistant or Amazon’s Alexa. Go ahead and discover your gadgets.

Rewards are motivators:

The simple science of getting kids to thrive in their learning is to create a task list and reward the completion of tasks with simple child-friendly rewards like a party, movie, or treat of their choice. Starting such a system helps them inculcate discipline, cleanliness, and innovation in thinking through their tasks. Rather than play for hours on end, kids find it more interesting to learn to handle gadgets like the computer, smartphones or home theatre. They not only feel grown-up but also start skilling themselves early.

Use authentic training resources:

Teaching children to Google their questions opens up Pandora’s box when un-monitored. However, the internet has some very interesting videos on YouTube, simple beginner’s courses depending on the age of your child, websites for learning kids, games that explain concepts behind what appears complicated technology and child-friendly apps that are invaluable for both you and your kids. Why not consider a few big data analytics courses online?

Learn from mistakes:

Part of the learning lies in its being used and that’s where mistakes are bound to happen. Just like kids fall and learn to walk better, complicated subjects will come with mistakes and errors that should be treated as part of the process. The parent’s role in encouraging and handling rejection due to mistakes is just the same as in subjects like mathematics, science or any other. Just as long as the child enjoys the process and no stress is created they will learn if you are sensible about their failures.

Get Assistance:

Rather than venture into the unknown territory alone, there are ample resources that you can exploit to teach your children such as teachers, tutors, and short-term beginner courses at colleges that can help. Scour your neighbourhood for students who have done big data analytics courses and would be willing to orient your kid for a very reasonable hourly fee while keeping them well-attended to and busy learning something new.

Parting notes:

So, how can proactive parents encourage children to acquire knowledge and skills in big data and modern technologies? Well, the answer is simple. It is all about the training of the mind to form a basic skill set that is curious and learns by itself. At Imarticus Learning you can learn and also enrol your children in professional courses like big data analytics courses that help build appropriate skills in the field of emerging technology. You will be getting them a quick start in their careers that could prove invaluable in time.

What Are An Interesting Careers To Explore In Big Data?

Reading Time: 3 minutes

What Are An Interesting Careers To Explore In Big Data?

Big Data is no longer a future capability but is already in use in a variety of sectors and industries. Some of the uses are as diverse as taxis in Sweden using data to cut back on traffic and emissions to Barcelona building a smart city based on data and farmers worldwide using data to reinvent farms. The benefits of Big Data applications and data-driven strategies have thrown open the doors to a variety of careers which are satisfying, always in demand and pay very well.

Doing a big data course is one of the best options to hone your skills on the current demands of the emerging technologies in Big Data and allied fields like machine learning, artificial intelligence, deep learning, and neural networks among others.

Let us explore the top careers and the requirements to make a career in this lucrative area. Salaries are as reported in Payscale.

  • DATA SCIENTIST: These are the experts who produce meaningful insights and work with Big Data volumes using their technical and analytical skills to clean, parse and prepare data sets from which an analyst can apply algorithms to get business insights. Their salary is in the range of 65,000 to110,000 USD.
  • BIG DATA ENGINEER: These engineers evaluate, build, maintain, develop, and test big data solutions created by solutions architects. Their salaries lie between 100,000 to 165,000 USD.
  • DATA ENGINEER: The engineer is responsible for data architecture and the continuous data flow between applications and servers. Their salary range is 60,0945 to124,635USD.
  • ML- SCIENTIST: They work with adaptive systems and algorithm development and research. They explore Big Data and train the big data course to automatically extract trends and patterns used in demand forecasting and product suggestions. The average ML scientist’s salary is 78,857 to124,597 USD.
  • DEVELOPER-DATA VISUALIZATION: These people are responsible for the development, design, and production of interactive data-visualizations. They are the artists who bring to life reusable graphic/data visualizations. Their technical expertise is valued and the salary range is 108,000 to130,000 USD.
  • SPECIALIST- BUSINESS ANALYTICS: This specialist assists in testing, supports various activities, performs research in business issues, develops cost-effective solutions and develops test scripts. Their salary range is 50,861to 94,209 USD.
  • BI- ENGINEER: These engineers have business intelligence data analysis expertise and set up queries, reporting tools etc while maintaining the data warehouses. Their expertise earns salaries in the range of 96,710 to138,591 USD.
  • SOLUTION ARCHITECT- BI: These architects deal with solutions that aid sensitive timely decisions for businesses. The salary range for this role is 107,000 to162,000 USD.
  • SPECIALIST- BI: These people also are from the BI area and support the framework across the enterprise. The salary range for these is in the range of 77,969 to128,337 USD.
  • ML ENGINEER: This important aspect of ML develops solutions aiding machines to self-learn and autonomously run without human supervision. ML engineer’s draw a salary of 96,710 to138,591 USD.
  • ANALYTICS MANAGER: This manager deals with the design, configuration, support and implementation of analysis tools and solutions from huge transaction volumes. Their salary range is 83,910 to134,943 USD.
  • STATISTICIAN: These people are tasked with gathering, displaying and organizing numerical data used to make predictions and spot trends. The salary range for this role is 57,000 to 80,110 USD.

The skills required:

The basic attributes required for these jobs is:

  • Knowledge of Apache Hadoop, NoSQL, SQL, Spark, and other general-purpose programming languages.
  • Skills honed in a regular big data analytics course.
  • Adept in ML, data mining, quantitative analysis, data visualization and statistical inferences.
  • Personality attributes like being a team player who is adroit in creative and analytical thinking, innovative approaches and creative problem-solving.

The importance of certifications: 

Certifications endorse your skills and validate that you have the knowledge to practically apply your skills. Certifications in the below subjects will stand you in good stead when at interviews and improve your career prospects. Do go in for certifications in

  • Hadoop, SAS
  • Microsoft Excel
  • Python, R, and the Java suite
  • Pandas, MongoDB
  • Apache Spark, Scala, Storm, Cassandra, etc
  • MapReduce, Cloudera, and HBase
  • Pig, Flume, Hive, and Zookeeper.

Parting notes:

It is best to do the big data course at Imarticus Learning as they train you to be career-ready with skills on the latest technologies like the ones mentioned above. Their certification is well-accepted in the industry. So, why wait? Start on your career journey today!

From Computer Science to Big Data Analytics: How Imarticus Learning Helped In Specialization?

Reading Time: 3 minutes


Chirag shares his journey with Imarticus learning that led him to become a successful Data Analyst!!

Even though Data Analytics is one of the most sought-after fields today, it is not at all an easy specialization to pursue. Chirag a Bachelor in Computer Science shares his journey with Imarticus learning and how Imarticus helped him get a prestigious job as a Data Analyst.

Tell us a bit about yourself and your background

I am Chirag Soni, I am a Computer Science graduate from Pune University and I joined Imarticus Learning for a Big Data Analytics Course. I am really happy to tell you that today I am placed in M Technologies through help and guidance from Imarticus. After my graduation in Computer Science, I was looking for a  career as a data analyst and was considering a Big Data Analytics course or a Financial Modelling Course. After reaching the website of Imarticus Learning, I reached out to the counselors and applied for the course.

Tell us about your experience with Imarticus Learning

After referring to Imarticus Learning reviews on the Internet, I was really confident about the place I was going to, but the people here surpassed all my expectations. The standout for this course for me was the co-operative and warm faculty who helped me learn and master various programming languages like SAS, R, and Python due to their excellent in-depth lectures which provided all this knowledge in a structured and organized way.

What Changes did you notice since joining Imarticus Learning for your Data Analytics Course?

There has been a lot of change that I can notice within me especially in terms of confidence and professionalism. The well-structured courses and thoroughly professional faculty members provided me with the perfect environment to transform myself into a professional coder with attributes like high order thinking skills, conversational skills, and stress management skills that companies really look forward to having in their employees.

Imarticus Learning changed me from an immature to a thorough professional within days thanks to all the faculty and staff plus the supremely designed course that focuses on skills that are beyond the range of textbook teaching.

Do you recommend others to join the Analytics course at Imarticus? If yes, Why?

I would definitely recommend anyone looking for a course in analytics to join Imarticus primarily due to the exceptional faculty that this institution has. These professionals really have the in-depth practical knowledge of their respective domains which enables them to teach the curriculum in the best way that is beyond textbooks and according to the students’ needs.

These inclusive courses and teachers together don’t make you feel left behind even if you don’t have the prior knowledge of the domain and the extensive doubt clearing sessions always ensure that you are up to date with your syllabus without any doubts and difficulties.

What do you think about Imarticus Learnings’ Placement Services?

The people involved with placements at Imarticus are some of the hardest working individuals who work hard to ensure that the students get their dream jobs with the best companies possible. Not only do these people attract good companies, but also they assist the students in getting their dream jobs. Whether it’s working on our resume or preparing us for the most important interview in our lives, these people ensure that you are trained and equipped for everything that is to come.

It is only through the dedication of the faculty and the Placement services combined that Imarticus has been able to deliver such excellent placement results time after time and I definitely recommend anyone wanting a successful career opportunity to join Imarticus.

Interested in an analytics course? You can directly visit – Imarticus Learning and can drop your query by filling up a simple form on the site or can contact us through the Live Chat Support system or can even visit one of our training centers based in – Mumbai, Thane, Pune, Chennai, Banglore, Hyderabad, Delhi, Gurgaon, and Ahmedabad.


How Is Big Data Analytics Used For Stock Market Trading?

Reading Time: 3 minutes

Data drives decisions. The successful use of data-based applications already exists and is hugely popular too. Big Data Analytics is the decisive factor when you compete against the master traders on the stock market. A career in Data Analytics is highly satisfying and lucrative too! Most markets, verticals, and industries have inducted the applications of big data analytics to improve their marketing decisions, product selection, and competitive strategies.

The online stock market trading is no exception and is the one area where data analytics allows an on-par competitive platform of the finance domain which uses analytical strengths and strategies to its monetary advantage. There have been a large number of training institutes offering Big data analytics courses which can help you understand the nitty-gritty of data analytics as applied to the stock market trading.

How big data analytics is used for trading:

All, Big data Analytics Courses start with the importance of data, how it evolved into big data and the interconnection of big data analytics with AI, ML, programming techniques, and such topics. Across the board, companies, startups, and organizations use data analytics for forecasting, getting market insights, gauging market trends, business modeling and effective decision making.

Fields like healthcare, fintech startups, financial services, blockchain-based technologies, insurance, banking, and marketing make effective use of large volumes of big data readily available and growing fast today as the capstone of their key projects. The financial industry too has kept pace with such developments and offers many career aspirants a winning ticket to a career in the stock market.

The stock market rates, numbers of investors, key indices and prices are constantly changing. Each change generates data and considering such changes the total volumes of data is huger than huge volumes of petabytes of data. The ecosystem, landscape and trading process has gone completely online and real-time thanks to technology. Where once had to compute and take calculated risks based on very small windows into the data, today’s stock market has evolved over the last decade into the best example of the use of data analytics.

Let us explore the influence of big data analytics over the three major impacted areas.

Stabilizes and offers a level playing field for online trading:

Big data analytics depends on machine learning and algorithmic trading. The computers are trained to ingest, clean and use these large volumes of data much like the human brain processes information to do any task.

The ML enables the computers to use the real-time data which it rapidly processes to detect trends on the stock markets. Such representations and candlestick bar graphs are the basis of investor-decisions as they provide real-time information and can provide instant comparisons, present prices, other markets information and more to help compare and choose investment opportunities. This also provides a level uniform platform to all players, large or small.

Returns and outcomes estimation:

Big data analytics makes it possible to use powerful algorithms and AI to reduce possible risks in trading of stocks that takes place online and in real-time. The traders and financial analysts use the ability of data analytics to make forecasts and predictions regarding the prices and its behavior, trends and market behavior with accuracy and nearly instant speeds.

Improves ML to deliver forecasts and predictions.

ML in combination with big data makes a huge difference when taking strategic decisions based on a large data set that is far more logical than making inaccurate guesses and estimates. The data can then be reviewed and used in other applications if required to forecast market conditions, price trends, favorable conditions, and such factors on a real-time basis.

Conclusion:

Data analytics has immense potential for all from the professional to small-time hobby investors. You can learn from the Big data analytics courses and acquire a good grasp of trading practices, financial practices and knowledge of data analytics which are attributes that can be used even in making careers in a variety of fields where stocks are traded in. The payouts in any job will depend on the knowledge and skill proficiency in the trade and your ability to handle clients. Jobs in banks, as consultants and even as traders are available and obviously come with jaw-dropping commissions, salaries, and payouts.

Do your Big data analytics courses at Imarticus Learning and use the opportunity to make headway in your career.

What is Linear regression: What is it? How does it help? When is it used?

Reading Time: 3 minutes


Linear regression is a technique for the analysis of data that is statistical in nature. It is used to determine the nature and extent of the linear dependence between independent variables and a dependent variable.

The two kinds of linear regression are

·         Simple linear regression

·         Multiple linear regression

Both use a single dependent variable. When the dependent variable is predicted from a single independent variable it is called simple linear regression. When the dependent variable is predicted using multiple independent variables it is called multiple linear regression.

Data Considerations in Linear Regression:

There are many requirements of the data to qualify for use in linear regression. Almost always the dependent variable uses a scale of continuous measurement ( Ex: test scores from 1 to 50). The independent variable scale could be continuous or category wise. (Ex: Girls Vs Boys).

Linear Regression and Correlation:

Regression analysis is normally used to make predictions. Correlation and simple linear regression are alike since both establish the extent of the linear relationship between the dependent and independent variables. While linear regression defines the variables as dependent and independent, the correlation makes no such differentiation. Further linear regression always predicts the dependent variable as against the independent variables be it one or many.

Here are some of the uses of linear regression.

1. Defines relationships:

Regression analysis can be used for the following tasks where relationships are very tangled and complex. Like

  • Multiple independent variables modeling.
  • Use for analysis categorical or common variables.
  • Model curvature from polynomials.
  • Analyze the effects of interaction and find the extent of the dependence of the independent variables on other variables.

2. Control the variables:

Regression can control statistically every model variable. To make a regression analysis the variable’s role need to be isolated from the other variables and their roles. This means one must reduce the confounding variables effects on the variable. This is achieved by keeping the values of all other independent variables constant and then evaluating the linear simple regression analysis of the dependent variable against one independent variable only.

Thus the model will only evaluate the relationship between these two variables while effectively isolating the other variables. To control the other confounding variables in the regression analysis one needs to only include them in the model and hold the other variables at a constant value.

Let us look at an example to understand the practicality of linear regression analysis. A regression analysis study on mortality from coffee drinking was recently conducted. The analysis showed that higher the coffee intake higher was the risk of dying for the excessive coffee drinker. The initial model had however not included the fact that a large number of coffee drinkers also smoked.

Once included the regression analysis actually determined that normal coffee drinking did not raise the risk of death but actually decreases the mortality rate. Smoking, on the other hand, did increase mortality rates and the risk of death was higher with increased smoking. This is a good example of the technique of role isolation of the variables holding the other variable in the model constant.

Through this one example, we are able to study the effects of coffee drinking on the mortality rate while holding the variable of smoking constant and also studying the effects of smoking on the mortality rate when holding coffee drinking or the other variable constant.

In addition to the above findings, the regression study demonstrates how the exclusion of just one variable that is relevant to the model can lead to misleading and contradictory results. It is hence crucial that the model includes all relevant variables, isolates the roles of each variable and also controls the role of the variables effectively for linear regression results to be true and accurate.

Omitting variables and uncontrolled variables can cause the model to be biased and unbalanced. To reduce such bias a process of randomization is applied to true-life analysis experiments where the effects of the variables are equally distributed to ensure the biasing by the omitted variables.

Conclusion:

Regression analysis can be very effective in predictive models. If you would like to learn more about this subject you can do a data science course at Imarticus Learning where you will ace this subject and also learn to use the technique to real-life situations.

Statistics For Data science

Reading Time: 3 minutes

Data Science is the effective extraction of insights and data information. It is the science of going beyond numbers to find real-world applications and meanings in the data. To extract the information embedded in complex datasets, Data Scientists use myriad techniques and tools in modelling, data exploration, and visualization.

The most important mathematical tool of statistics brings in a variety of validated tools for such data exploration. Statistics is an application of mathematics that provides for mathematical concrete data summarization. Rather than use one or all data points, it renders a data point that can be effectively used to describe the properties of the point regarding its make-up, structure and so on.

Here are the most basic techniques of statistics most popularly used and very effective in Data Science and its practical applications.

(1) Central Tendency

This feature is the typical variable value of the dataset. When a normal distribution is x-y centered at (110, 110) it means the distribution contains the typical central tendency (110, 110) and that this value is chosen as the typical summarizing value of the data set. This also provides us with the biasing information of the set.

There are 2 methods commonly used to select central tendency.

Mean:

The average value is the mid-point around which data is distributed. Given 5 numbers here is how you calculate the Mean. Ex: There are five numbers

Mean= (188 2 63 13 52) / 5 = 65.6 aka mathematical average value used in Numpy and other Python libraries.

Median:

Median is the true middle value of the dataset when it is sorted and may not be equal to the mean value. The Median for the sample set requires sorting and is:

[2, 13, 52, 63, 188] → 52

The median and mean can be calculated using simple numpy Python one-liners:

numpy.median(array)

numpy.mean(array)

(2) Spread

The spread of data shows whether the data is around a single value or spread out across a range. If we treat the distributions as a Gaussian probability figure of a real-world dataset, the blue curve has a small spread with data points close to a narrow range. The red line curve has the largest spread. The figure also shows the curves SD-standard deviation values.

Standard Deviation:

This quantifies the spread of data and involves these 5 steps:

1. Calculate mean.

2. For each value calculate the square of its distance from the mean value.

3. Add all the values from Step 2.

4. Divide by the number of data points.

5. Calculate the square root.

Made with https://www.mathcha.io/editor

Bigger values indicate greater spread. Smaller values mean the data is concentrated around mean value.

In Numpy SD is calculated as

numpy.std(array)

(3) Percentiles

The percentile shows the exact data point position in the range of values and if it is low or high.

By saying the pth percentile one means there is p% of data in the lower part and the remaining in the upper part of the range.

Take the set of 11 numbers below and arrange them in ascending values.

3, 1, 5, 9, 7, 11, 15,13, 19, 17, 21. Here 15 is at the 70th percentile dividing the set at this number. 70% lies below 15 and the rest above it.

The 50th percentile in Numpy is calculated as

numpy.percentile(array, 50)

(4) Skewness

The Skewness or data asymmetry with a positive value means the values are to the left and concentrated while negative means a right concentration of the data points.

Skewness is calculated as

Skewness informs us about data distribution is Gaussian. The higher the skewness, the further away from being a Gaussian distribution the dataset is.

Here’s how we can compute the Skewness in Scipy code:

scipy.stats.skew(array)

(5) Covariance and Correlation

Covariance

The covariance indicates if the two variables are “related” or not. The positive covariance means if one value increases so do the other and a negative covariance means when one increases the other decreases.

Correlation

Correlation values lie between -1 and 1 and are calculated as the covariance divided by the product of SD of the two variables. When 1 it has perfect values and one increase leads to the other moving in the same direction. When less than one and negative the increase in one leads to a decline in the other.

Conclusion: 

When doing PCA-Principal Component Analysis knowing the above 5 concepts is useful and can explain data effectively and helps summarize the dataset in terms like correlation in techniques like Dimensionality Reduction. Thus when more data can be defined by a median or mean values the remaining data can be ignored. If you want to learn data science, try the Imarticus Learning Academy where careers in data science are made.