


Last updated on May 15th, 2026 at 03:07 pm
Most people who start with Power BI spend their first few weeks entirely inside Desktop. They connect to data, build visuals, write a few DAX measures, and feel genuinely good about what they have made. Then they try to share it with a colleague and hit a wall. The file is too big to email. The colleague does not have Desktop installed. The data is already a week old. And suddenly, the report that looked great on a personal laptop is completely useless to the person who actually needed it. That wall has a name. It is the gap between building and delivering. And the Power BI service is what closes it.
‘Desktop’ is where analysis happens. The Microsoft Power BI service is where that analysis becomes actionable for an organisation. It runs at app.powerbi.com, entirely in a browser, with nothing to install and no IT ticket required to get started. For anyone building toward a data analytics certification, getting comfortable with the service layer early is one of the most practical steps you can take before entering the job market.
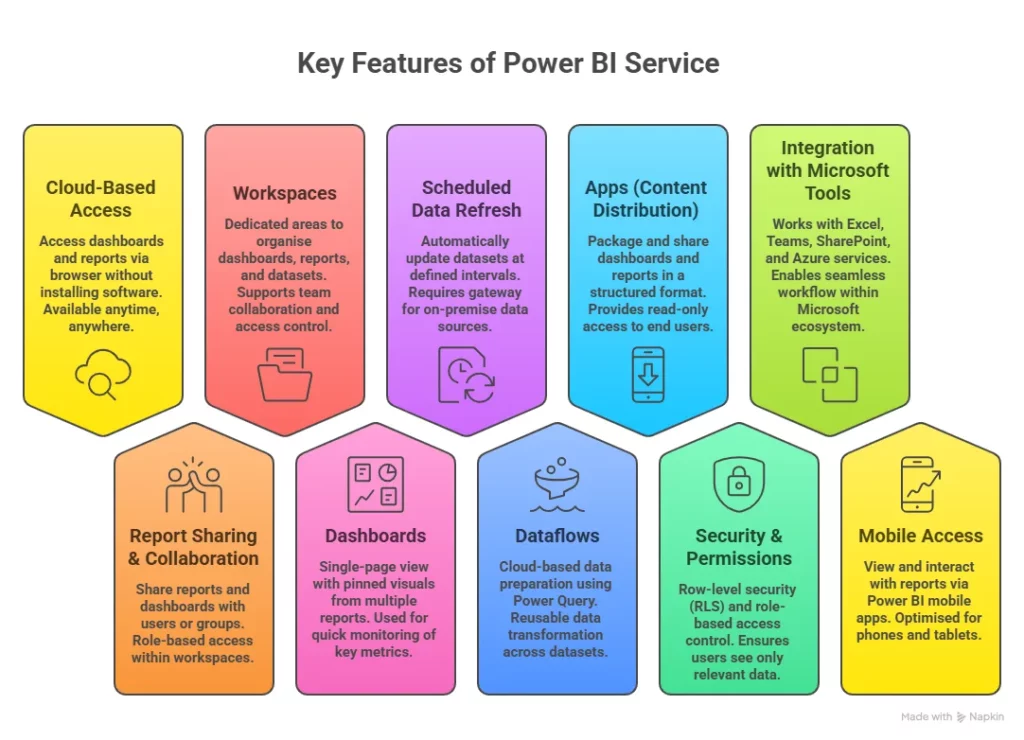
What makes this worth paying attention to is how much the service actually does beyond just hosting reports. Scheduled data refresh, workspace governance, row-level security, deployment pipelines, dataflows, embedded analytics; none of that exists in Desktop. All of it lives in the Power BI online service. For anyone managing data at an organisational level rather than just analysing it personally, the service is where the real work happens.
The rest of this guide covers everything from signing up and pricing to features, architecture, and the questions that come up in technical interviews. Whether you are just getting started or trying to fill gaps in what you already know, there is something here worth your time.
Did you know?
More than 97% of Fortune 500 companies use Microsoft Power BI in some capacity. That number did not happen because of great marketing alone. (Source: Power BI)
Power BI Desktop vs Power BI Service
People ask about the difference between Power BI Desktop and Power BI service constantly, and honestly, the confusion is understandable. Microsoft ships both under the same brand name, which does not help. Understanding: what is Power BI as a full platform rather than a single tool changes how you approach it.
Desktop is the authoring tool. It runs on Windows. You connect to your data, clean it up, write your measures, build your visuals, and save everything as a .pbix file. That file sits on your hard drive. Only you can see it.
The Power BI service is what happens after you click publish. The report moves into the cloud and becomes accessible to anyone you share it with, from anywhere, without them needing a ‘Desktop’ installed at all. Some things only exist in one place and not the other. This table lays it out plainly:
| Capability | Power BI Desktop | Power BI Service |
| Connect and shape data | Yes | Limited |
| Write DAX measures | Yes | Basic edits only |
| Design report visuals | Yes | Minor edits |
| Publish reports | Yes | Receives them |
| Build dashboards | No | Yes |
| Schedule data refresh | No | Yes |
| Create and manage apps | No | Yes |
| Dataflows (cloud ETL) | No | Yes |
| Deployment pipelines | No | Yes |
| Row-level security | Define roles | Assign users |
| Works on Mac or browser | No | Yes |
| Share with colleagues | No | Yes |
The Power BI service vs desktop question usually comes up when someone realises their report is not reaching their team. That table is your answer.
One more distinction worth making: some organisations use Power BI Report Server, which is the on-premise version that sits inside a company’s own data centre. Power BI report server vs Power BI service is really a debate about control versus convenience. Report Server gives your IT team full custody of the data. The cloud service gives your analysts speed and flexibility. Most modern organisations lean towards the cloud, but highly regulated industries sometimes have no choice.
Choosing between data science and data analytics often comes down to the kind of problems you want to solve and the skills you enjoy using. A clear comparison of both paths can help you understand where your strengths fit and which direction offers better alignment with your career goals.
Steps to Sign Up for the Power BI Service Without Mistakes
The number one mistake people make when signing up for the Power BI service is trying to register with a personal email address. A Gmail. A personal Outlook. It will not work. Microsoft requires a work or school email tied to an organisation’s domain.
Once you have that, the Power BI service sign-up process genuinely takes under five minutes. Here is what the flow looks like:
- Head to app.powerbi.com
- Click Sign Up Free
- Enter your work email address
- Microsoft Power BI checks the domain and sends a verification email
- Complete verification, and you land in your personal workspace
After you create your Power BI service account, you are on the free tier by default. Personal workspace, personal exploration, no sharing. To collaborate on Power BI projects with teammates, you need a Pro or Premium license.
The Power BI service login itself uses your standard Microsoft credentials. If your company uses Microsoft 365, it is the same login you use for Teams or Outlook. One set of credentials, the whole ecosystem.
Note→ Before buying any license, ask your IT department if Power BI Pro is already bundled into your Microsoft 365 plan!
Also Read: By 2030, 93% of Companies Will Use Data Analytics. Are You Ready with the Right Skills?
Power BI Service Pricing
Here is what the Power BI service pricing landscape actually looks like right now. This is after Microsoft launched Fabric and retired the old P-SKU capacity licenses in July 2024.
This table covers the main tiers of Power BI pricing that most individuals and organisations encounter. Enterprise Fabric SKUs go deeper, but these four cover the vast majority of use cases.
| Plan | Monthly Cost | What You Actually Get |
| Free | $0/user | Personal workspace, no external sharing |
| Power BI Pro | $14/user | Full sharing, team workspaces, collaboration |
| Premium Per User (PPU) | $24/user | AI visuals, paginated reports, Dataflows Gen2 |
| Microsoft Fabric F64+ | Capacity-based | Enterprise scale, full Fabric platform access |
Is the Power BI service free? For personal use, yes. For anything involving other people – sharing reports, building shared workspaces, distributing apps – you need at least a Pro license. At $14 per user per month, it is not expensive relative to what it replaces. Think about how many organisations were paying for Crystal Reports or full Tableau Server licenses before Power BI arrived.
Here is a question worth sitting with. If your report does not update automatically, cannot be accessed by your team without a specific file, and disappears the moment you close your laptop, is it really a business intelligence tool? Or is it just a very well-designed spreadsheet? The Power BI web service answers that question by design.
Also Read: Edge vs Cloud: Which Is Better for Modern Data Analytics?
Must-know Power BI Service Features
There is a pattern that happens with Power BI service adoption inside organisations. A team starts using it to share a few reports. Slowly, someone discovers dashboards. Then someone else finds apps. Then someone in IT starts asking about deployment pipelines, and suddenly the conversation shifts from “we use Power BI” to “we have a real BI practice.” Such features were always there, which you learn in Power BI training.
Apps in Power BI Service
An app in the Power BI service is how you package a finished, curated set of reports and dashboards for a specific audience.
Think of the difference between handing a colleague a USB drive with every file you have ever worked on versus sending them a well-organised folder with only the relevant documents.
The app is the organised folder. The workspace is the USB drive. Here is how publishing an app works in practice:
- Build and finalise your reports inside a workspace.
- Configure the app by selecting which content to include and how to organise it.
- Set audience permissions, choosing specific users, groups, or the whole organisation.
- Publish the app and distribute the link.
- Update the app whenever the underlying reports change, without recipients needing to do anything.
For finance teams or sales leadership receiving reports, apps remove the noise. They see what they need. Nothing else shows up. The app Power BI service functionality is one of the most underused features in smaller organisations and one of the most relied upon in larger ones.
Bookmarks in Power BI Service
Bookmarks in the Power BI service save the exact state of a report page. Every filter, slicer, and visual selection is captured as a snapshot. One click brings the report back to that exact view instantly.
- Save filters, slicers, and visual states in one click.
- Switch between views without manual changes.
- Improve report navigation inside the Power BI online service.
This becomes very useful during presentations. Imagine showing regional performance across multiple views. Without bookmarks, you adjust filters live. With bookmarks, each view is pre-set and ready. In the Power BI web service, this feature helps teams interact with data without needing technical skills. It turns reports into something easy, visual, and quick to use.
Data Flow in Power BI Service
Data flow in the Power BI service often goes unnoticed, but it solves a major problem. Inconsistent data across reports can create confusion and slow decisions. Without dataflows, every analyst builds their own logic in data visualization with Power BI.
- One filters cancelled orders differently.
- Another applies a different rule.
- Someone else skips it completely.
This leads to multiple reports showing different numbers for the same metric. A data flow in the Power BI service fixes this by centralising the logic.
- Build transformation steps once in the Power BI cloud service.
- Store cleaned data in one shared place.
- Let all reports connect to the same source.
This ensures consistency across dashboards in the Power BI online service. Think of it like a shared recipe. Everyone follows the same steps, so the final output stays consistent across the app Power BI service environment.
Service Principal in Power BI
A service principal Power BI setup is not a user account. It is an application identity that connects to the Power BI service without human login. This is useful when tasks run automatically.
- Scripts refresh datasets at fixed times.
- Reports are updated and shared without manual steps.
- Systems connect through the Power BI web service.
Instead of using personal credentials, the process uses a service principal.
- Works as a registered app in Azure Active Directory.
- Has its own permissions and access control.
- Keeps workflows stable even if users change.
This approach is widely used in:
- Data engineering workflows.
- Embedded analytics solutions.
- Automation using Power BI APIs.
It keeps systems running smoothly inside the Power BI online service without relying on manual actions.
Analysis Services in Power BI
Analysis services in Power BI allow the Power BI service to connect directly to external data models. These models usually sit in Azure Analysis Services or SQL Server Analysis Services. Instead of importing data, the Power BI service queries the model live.
- No data duplication inside the Power BI cloud service.
- Always reflects the latest data.
- Keeps a single source of truth.
This is useful when the data is large or complex.
- Avoids heavy data imports.
- Improves performance for large datasets.
- Keeps reports lightweight in the Power BI online service.
Power BI analysis services live connectivity combines both strengths.
- Power BI service handles visuals and sharing.
- Analysis services handle data processing and logic.
This setup keeps data reliable while making reports easy to access through the Power BI web service.
Deployment Pipelines in Power BI Service
Deployment of data pipelines in the Power BI service helps manage reports across stages. This brings structure to how content moves from creation to final use. The process follows three environments.
- Development where reports are built.
- Test where they are validated.
- Production where users access final reports and dashboards.
This setup is similar to software workflows. It keeps things organised and controlled.
- Build and update reports in development.
- Test with sample or safe data in the Power BI cloud service.
- Push approved content to production in the Power BI online service.
Each stage can connect to different data sources.
- Testing never touches live data.
- Production stays stable and reliable.
- Errors are caught before users see them.
This matters when reports guide business decisions. It adds a layer of control that helps teams work with confidence and clarity.
Interesting Insight→ According to Gartner, organisations with formal BI governance practices, including environment separation and change management, see measurably better data trust scores among business users than those without.
Steps of Getting a Report Live on Power BI Service
There is something satisfying about the moment a report you spent hours building shows up in a colleague’s browser without them having to install anything. That moment happens through a workflow most people learn by accident. Here it is, laid out deliberately.
Step 1: Build your report locally:
Open Power BI Desktop, connect to your data, build your visuals, and save as a .pbix file. If you do not have Desktop yet, the Power BI service free download for the desktop application is available from the Microsoft download centre or the Microsoft Store. It is free.
Step 2: Publish from Desktop to the service:
Inside Desktop, go to Home and click Publish. Sign in with your work account if prompted. Select the workspace where you want the report to live. It uploads in seconds for most file sizes.
Step 3: Open it in the Power BI service:
Go to app.powerbi.com, navigate to the workspace you published to, and your report is there. Open it. The visuals work exactly as they did in Desktop.
Step 4: Build a dashboard:
Pin key visuals from the report to a dashboard. A dashboard in the Power BI service is not a report. It is a single-page view of your most important metrics, assembled from one or more reports.
Step 5: Set up scheduled refresh:
Go to the dataset associated with your report in the workspace. Open Settings. Under Scheduled Refresh, choose your frequency and enter credentials for the data source. The Power BI service handles the rest.
Step 6: Share or package as an app:
For individuals, use the Share button. For teams or departments, build an app. The app approach scales cleanly because recipients do not need workspace access to view published content.
One Practical Thing: Use a dedicated Power BI service account for all refresh credentials. Personal account passwords get reset, people leave organisations, and when that happens, every refresh job tied to that personal account fails.
For anyone planning a career shift or starting fresh, understanding the exact steps to become a data analyst can bring a lot of clarity. From building core skills to choosing the right tools and career path, having a structured roadmap makes the journey far more focused and achievable.
Power BI Service Interview Questions
Most interview preparation for Power BI roles focuses on DAX syntax and visual types. The questions that actually trip people up in technical interviews tend to be about the service layer, specifically governance, architecture, and how the pieces connect.
Here is a set of Power BI service interview questions drawn from real hiring patterns, along with what each question is genuinely probing:
| Interview Question | What the Interviewer Is Actually Evaluating |
| What is the difference between a report and a dashboard in the service? | Whether you understand the platform architecture |
| How does row-level security get implemented end-to-end? | Governance and security awareness |
| What is a service principal, and when would you use it? | Automation and API familiarity |
| Walk me through how deployment pipelines work | DevOps thinking applied to analytics |
| What is a dataflow, and how does it differ from Power Query in Desktop? | Data architecture depth |
| How do you connect to on-premise data from the cloud service? | Gateway and connectivity knowledge |
| What happens when a user with a free licence tries to access a Pro workspace? | Licencing literacy |
| How would you structure workspaces for a large organisation? | Scalability and administration thinking |
Anyone preparing for a data analyst or BI developer role should spend time inside the service itself, not just reading about it.
Power BI Consulting Services
Deploying Power BI at scale inside an organisation is not difficult in the way that advanced mathematics is difficult. It is difficult in the way that moving house is difficult. The individual tasks are manageable. The coordination, sequencing, and avoiding preventable mistakes are where things go wrong.
Power BI consulting services address exactly that. A good consultant brings pattern recognition from having seen the same problems across multiple organisations. They know which workspace structures break down at 50 users. They know how gateway configurations fail under certain network setups. They know which governance decisions made in month one become painful to undo in month twelve.
Understanding the range of roles within data science, along with salary expectations and growth opportunities in India, helps bring direction to career decisions. A clear view of the scope makes it easier to choose the right path and align your skills with industry demand.
Why Imarticus Learning Stands Out For Data Analytics
Choosing the right learning path matters more than people realise. A good program does more than just teach tools. It prepares you for real work, real problems, and real expectations. When you look closely at how structured learning meets industry needs, some programs naturally stand apart.
Here are some of the key strengths that make the Data Analytics Course offered by Imarticus Learning a strong choice:
- 100% Job Assurance With Guaranteed Interviews: The program offers structured placement support with guaranteed interview opportunities, helping learners move from training to job roles with clarity.
- Hands-On Learning With 35+ Tools And Real Projects: You work on real datasets using tools like Python, SQL, Power BI vs Tableau. This builds practical skills instead of just theory.
- Industry-Aligned Curriculum With GenAI Integration: The course includes modern tools and concepts like Generative AI, ensuring skills stay relevant to current market demand.
- Strong Placement Network With 2000+ Hiring Partners: Access to a wide hiring ecosystem increases the chances of landing roles across industries.
- NSDC Certified Credential: The certification adds credibility and is recognised across industries, which helps during job applications.
- Portfolio Development For Job Readiness: You graduate with a set of projects that show your ability to solve business problems, which is often what recruiters look for.
This combination of structured learning, practical exposure, and placement focus creates a path that feels aligned with how the industry actually works today.
FAQs About Power BI Service
When doubts come up during setup or daily use, having clear answers makes working with the Power BI service much smoother. The points below cover the most frequently asked questions users search for.
What Is a Power BI Service?
The Power BI service is Microsoft’s cloud platform where published reports are stored, shared, and refreshed. It runs in a browser at app.powerbi.com and requires no installation. Imarticus Learning covers the full service workflow as part of its data analytics training, giving learners hands-on experience with workspaces, apps, and dashboards.
What Is the Difference Between Power BI Desktop and Power BI Service?
Power BI Desktop is a Windows application used to build and design reports locally. The Power BI service is where those reports get published and shared online. Desktop handles creation. The service handles distribution, collaboration, and scheduled data refresh. Imarticus Learning trains learners on both tools as part of one connected workflow.
How Do I Access the Power BI Service?
Visit app.powerbi.com and sign in using a work or school Microsoft account. Personal email addresses are not supported for organisational features. The Power BI service login uses the same Microsoft credentials as Teams, Outlook, and SharePoint.
Is Power BI Service a Cloud Service?
Yes. The Power BI service is a fully cloud-based platform hosted on Microsoft Azure. Reports, datasets, and dashboards all live in the cloud and are accessible from any browser. This is the key difference from Power BI Report Server, which is hosted on-premise within an organisation’s own infrastructure. Imarticus Learning’s curriculum includes cloud deployment concepts and service administration as core modules.
Is the Power BI Service Free?
The Power BI service has a free tier limited to personal workspace use. Sharing reports with others or working inside team workspaces requires a paid licence. Power BI Pro is priced at $14 per user per month as of 2026. Imarticus Learning helps learners understand licensing options so they can advise organisations on the right setup.
How to Run the Power BI Service?
Open any browser, go to app.powerbi.com, and sign in with a work account. The Power BI service loads your workspace automatically. From there, you can access existing reports, create dashboards, configure refresh settings, and manage apps without any local software installation.
When Would You Use the Power BI Service?
The Power BI service becomes essential when a report needs to reach more than one person, when data needs to refresh on a schedule, or when an organisation wants centralised control over who sees what. It is also where embedded analytics, mobile access, and large-scale app distribution are managed.
What Are the Two Types of Power BI?
The two primary tools in the Power BI ecosystem are Power BI Desktop for local report authoring and the Power BI service for cloud-based sharing and management. Microsoft also offers Power BI Mobile for on-the-go report access and Power BI Report Server for organisations that require on-premise deployment rather than cloud hosting.
Your Next Move With Power BI Service Starts Here
Knowing the Power BI service is one thing. Being able to walk into a room, open a workspace, and deliver something that actually helps a business make a decision is another thing entirely.
The analysts who move fast in their careers are not necessarily the most technically gifted. They are the ones who got hands-on early, worked through real data problems, and built the kind of confidence that only comes from doing the work repeatedly.
Data is not slowing down. Organisations are hiring people who can turn raw numbers into clear decisions. Power BI is one of the most in-demand tools in that space right now, and the service layer is where the real organisational value sits.
If you are serious about building a career in data analytics, structured learning with real projects makes all the difference between knowing a tool and knowing how to use it under pressure.
Imarticus Learning offers a Data Analytics Course that covers Power BI end-to-end, with live instruction, hands-on projects, and dedicated placement support to help you land the role you are working toward. The skill is learnable. The opportunities are real. The only question is how soon you want to get started.
