

Data is everywhere today. It sits in sales sheets, marketing dashboards, finance reports and even in the apps you use every day. The real challenge is not collecting data. It is making sense of it in a way that leads to better decisions. This is where the discussion of Power BI vs Tableau starts to matter.
Think about a simple case. A store owner wants to know which product sells more on weekends. A marketing team wants to see which campaign brings better leads. A hospital wants to track patient inflow trends across months. In each case, raw numbers do not help much on their own. The value comes when those numbers turn into clear visuals and patterns. That is the role tools like Power BI and Tableau play.
For anyone who wishes to do a Data Analytics Certification and wants to learn about these tools, Power BI fits well in environments where data comes from Excel, CRM systems and Microsoft tools. It is often used for routine reporting where teams need quick updates and easy sharing. Tableau is widely used in situations where the data is large, the analysis is deep, and the final output needs to be highly visual and interactive. Both tools sit at the centre of modern business intelligence, but they serve different styles of work.
The aim of this guide is to give you a clear, practical view of Power BI vs Tableau without jargon or confusion. By the end, you should be able to see how each tool fits into real business problems, what skills you need to get started and how the choice connects to your long-term career path in data and analytics.
Did you know?
Microsoft Power BI has over 115 million monthly users, while Tableau is used by more than 86,000 companies worldwide. These numbers show the strong market share of Tableau vs Power BI in the analytics space.
(Source: Power BI, Tableau)
Understanding the Basics of Power BI vs Tableau
To make sense of features, pricing and career scope later in the Power BI vs Tableau discussion, it helps to first understand what each tool actually does and where it fits in real data workflows. At a simple level, both tools help you take scattered data and present it in a clear visual format so that decisions can be made faster. They sit at the centre of business intelligence workflows used by companies across industries.
What is Power BI?
Power BI is a business analytics platform developed by Microsoft. It is designed to help users connect to different data sources, clean the data and build interactive reports. Here is how Power BI works in a simple flow:
- Connect data from Excel, databases or cloud apps
- Clean and transform data using Power Query
- Create visuals like charts, graphs and KPI cards
- Share dashboards across teams through a cloud service
Power BI is widely used in organisations that already rely on Microsoft tools like Excel, Azure or SharePoint. This is one of the main reasons why Microsoft Power BI vs Tableau often shows strong adoption in corporate environments.
What is Tableau?
Tableau is a data visualisation and analytics platform known for its strong visual storytelling ability. It allows users to explore data in depth and present it through highly interactive dashboards. Here is how Tableau works in simple steps:
- Connect to multiple data sources, including cloud and big data systems
- Prepare and blend data from different sources
- Build interactive charts and maps
- Design dashboards that allow deep exploration
Tableau is often used in data-heavy environments where visual clarity and storytelling are important. This is why it stands out in discussions around Tableau vs Power BI data visualization.
To make the comparison more practical, it helps to understand what data analysts actually do in their day-to-day roles, how they work with datasets, build dashboards and translate numbers into clear business decisions across teams and industries.
Power BI vs Tableau At a Glance
The table below gives a quick overview so you can easily compare Tableau vs Power BI before moving deeper into the blog.
| Aspect | Power BI | Tableau |
| Developer | Microsoft | Salesforce |
| Core strength | Reporting and business dashboards | Data visualisation and storytelling |
| Learning curve | Beginner friendly | Moderate to advanced |
| Pricing | Lower cost options available | Higher entry cost |
| Integration | Strong with Microsoft tools | Wide data source support |
| Use case | Internal reporting and operations | Advanced analytics and client presentations |
This snapshot sets the base for the detailed Power BI vs Tableau comparison that follows in the blog.
Where each tool fits in real life
To make this easier to relate to, think of common situations where data is used.
→ A sales manager checks daily revenue trends. Power BI dashboards help track this quickly and share updates with the team.
→ A marketing analyst studies customer behaviour across regions. Tableau dashboards help explore patterns and visualise insights in detail.
→ A finance team prepares monthly reports. Power BI makes it easy to connect spreadsheets and generate consistent reports.
→ A consulting firm presents insights to a client. Tableau helps build interactive visuals that tell a clear story.
These simple situations show how the Power BI vs Tableau difference appears in everyday work environments.
Also Read: What Are The Key Features and Benefits of Power BI?
Power BI vs Tableau Comparison Matrix
Before going deeper, I want to show a simple view of the Power BI vs Tableau comparison so the differences are clear at a glance. This helps if you are quickly trying to compare Tableau vs Power BI for study or work. Below is a Power BI vs Tableau comparison matrix that shows how they differ on core features.
| Feature Area | Power BI | Tableau |
| Ease of use | ✅ Easy for beginners | ❌ Needs practice |
| Data visualisation depth | ❌ Moderate | ✅ Very strong |
| Pricing flexibility | ✅ Lower cost tiers | ❌ Higher entry cost |
| Integration with Microsoft tools | ✅ Excellent | ❌ Limited |
| Large data performance | ❌ Slower with huge datasets | ✅ Strong performance |
| Custom dashboards | ✅ Good | ✅ Excellent |
| Learning curve | ✅ Short | ❌ Steeper |
| Deployment options | ✅ Cloud and on-premise | ✅ Cloud and on-premise |
This matrix helps answer one common search query: which is better, Power BI vs Tableau. The answer depends on the type of work and the size of the data. These points shape the real Power BI vs Tableau features experience.
Power BI vs Tableau: Features That Matter in Real Work
When I work with data tools, I focus on features that affect daily tasks. Fancy features are less useful if they slow down work. Here are the key Power BI vs Tableau features that impact real business use.
Data connectors
- Power BI has strong connectors for Excel, SQL Server, SharePoint and Azure.
- Tableau supports many data sources, including Hadoop, Google BigQuery and cloud apps.
Data transformation
- Power BI uses Power Query, which is easy for data cleaning.
- Tableau Online uses data prep tools that give more flexibility.
Dashboard interactivity
- Both tools support filters, drill downs and dynamic visuals.
- Tableau dashboards often feel more fluid and visually rich.
AI and advanced analytics
- Power BI has built-in AI visuals and integrates with Azure Machine Learning.
- Tableau also supports advanced analytics with Python and R integration.
This makes Tableau vs Power BI for machine learning an important choice for data science users.
If you’re planning a shift into analytics or AI, it helps to see how a structured learning path can take you from foundational concepts to advanced skills like machine learning, data storytelling and real-world business applications.
Power BI Pricing vs Tableau Cost Comparison
Cost matters when a student or company chooses a tool. The Power BI cost vs Tableau question is one of the most searched topics. Below is a clear breakdown of Power BI vs Tableau pricing.
Power BI Pricing
- Power BI Desktop is free
- Power BI Pro starts at about $10 per user per month
Tableau Pricing
- Tableau Creator plan starts around $70 per user per month
Cost Comparison Table
| Cost Factor | Power BI | Tableau |
| Free version | ✅ Available | ❌ Not a full version |
| Entry-level price | Low | High |
| Enterprise cost | Moderate | High |
| Licensing flexibility | High | Moderate |
This shows why many startups prefer Power BI when comparing Tableau vs Power BI cost or Power BI vs Tableau pricing.
Also Read: The Ultimate Cheat Sheet On Data Analysis With Tableau
Tableau Dashboard vs Power BI Dashboard
Dashboards are the heart of any BI tool. A good dashboard should feel like reading a simple story.
Power BI Dashboards
- Clean and structured
- Works well for internal business reports
- Easy to build for finance and sales data
Tableau Dashboards
- Highly interactive
- Better for storytelling and presentations
- Ideal for public dashboards and client reports
When I compare a Tableau dashboard vs a Power BI dashboard, I see Tableau as more artistic and the Power BI tool as more functional.
Power BI vs Tableau Pros and Cons
To make the decision easy, I like to list the pros and cons of each tool.
| Tool | Pros | Cons |
| Power BI | Lower pricingEasy learning curveStrong Microsoft integrationFast setup and deployment | Limited visual customisationSlower with large datasets |
| Tableau | Best visualisation capabilitiesStrong performance with big dataFlexible and interactive dashboard design | Higher costLonger learning curve |
These points summarise the Power BI vs Tableau pros and cons clearly.
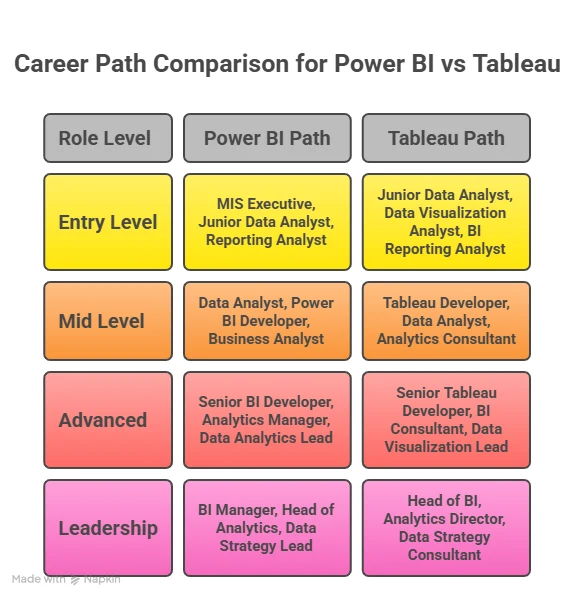
Power BI vs Tableau Job Market
The Power BI vs Tableau job market is growing fast. Companies are building data teams across every industry. According to Statista, the global BI market is expected to cross $54 billion by 2026. This growth drives demand for both tools.
Job Roles Where Power BI is Used
- Business Analyst
- MIS Executive
- Data Analyst
- Operations Analyst
Power BI appears more in job listings for companies that use Microsoft systems.
Job Roles Where Tableau is Used
- Data Analyst
- Data Visualisation Specialist
- BI Developer
- Analytics Consultant
Tableau appears more in roles that need deep data storytelling. When I check job boards like LinkedIn or Naukri, I see thousands of listings for both tools. This shows strong demand in the Tableau vs Power BI job opportunities space.
Also Read: Learn Data Visualization with Power BI in 2 Hours
Tableau vs Power BI Salary Comparison
Salary is one of the biggest deciding factors in the Tableau vs Power BI salary discussion. Here is a simple comparison based on current industry averages.
Salary comparison table
| Role | Power BI Salary | Tableau Salary |
| Entry-level analyst | ₹4 to 6 LPA | ₹5 to 7 LPA |
| Mid-level analyst | ₹7 to 12 LPA | ₹8 to 14 LPA |
| Senior BI developer | ₹12 to 20 LPA | ₹14 to 22 LPA |
This shows that Tableau roles often pay slightly higher due to advanced visualisation skills. However, Power BI roles are more numerous. This is why the question of Power BI vs Tableau, which is better, depends on career goals.
To understand where analytics skills can take you, it helps to look at the range of roles in data science, the growth of the field in India and the kind of salaries professionals can expect as they progress.
Learning Curve and Skill Requirements
When I think about learning any tool, I relate it to learning a new language. Power BI is like learning basic English conversation. You can start speaking quickly. Whereas Tableau certification feels like learning professional writing. It takes more time but gives more expression.
Power BI learning path
- Basic Excel knowledge
- Power Query for data cleaning
- DAX formulas
- Dashboard creation
Tableau learning path
- Data connection setup
- Data blending
- Calculated fields
- Advanced charts
This explains why beginners often ask which is hard Power BI or Tableau. Power BI is easier at the start. Tableau gives more power at advanced levels.
Also Read: Is Data Science a Good Career Path for Freshers?
Power BI vs Tableau for Machine Learning and Advanced Analytics
Many learners ask about Tableau vs Power BI for machine learning.
Power BI Capabilities
- Built-in AI visuals
- Integration with Azure ML
- Python and R scripting
Tableau Capabilities
- Advanced analytics extensions
- Python and R integration
- Statistical modelling tools
Both tools support machine learning workflows. Tableau gives more visual flexibility for complex models.
Also Read: What are the Features of Tableau from a Beginner’s Lens?
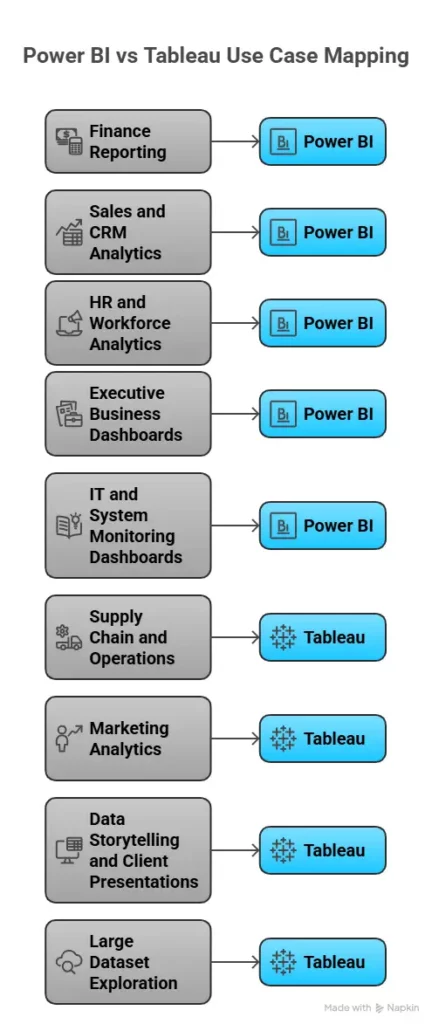
Industry Use Cases of Power BI vs Tableau
I like to understand tools through daily life examples.
When I look at Power BI vs Tableau in real work settings, the difference becomes clear through everyday business needs. Teams use these tools to answer simple but important questions. Which product sells more? Which campaign brings better results? Which region needs attention? The tool you choose often depends on how complex your data is and how you want to present it.
In many industries, both tools are used side by side. Power BI fits well for regular reporting and internal dashboards. Tableau is often chosen when the goal is deep analysis or visual storytelling for presentations. The table below shows how common industries use each tool in practical scenarios.
| Industry | Common Use Case | Power BI Usage | Tableau Usage |
| Finance | Revenue tracking, P&L dashboards, budget vs actual | Widely used for internal reporting | Used for visual analysis of trends |
| Sales | Pipeline tracking, regional sales performance | Strong for CRM and sales dashboards | Used for deeper trend analysis |
| Marketing | Campaign performance, customer segmentation | Used for regular campaign reports | Preferred for visual storytelling |
| Retail | Store performance, inventory tracking | Used for daily operations dashboards | Used for large data and pattern analysis |
| Healthcare | Patient data tracking, hospital performance | Used for reporting and monitoring | Used for research and analytics |
| Supply Chain | Logistics, vendor performance, and inventory flow | Used for operational dashboards | Preferred for large dataset analysis |
| HR | Employee performance, attrition analysis | Widely used for HR reporting | Used for advanced workforce insights |
| Consulting | Client reporting and insights | Used for structured reports | Preferred for client presentations |
| IT & SaaS | Product usage, system performance | Used for monitoring dashboards | Used for usage pattern analysis |
| Startups | Business metrics, growth tracking | Popular due to low cost and ease | Used when scaling analytics depth |
These examples show how the Power BI vs Tableau difference appears in real work.
Power BI vs Tableau vs Other BI Platforms Comparison Matrix
Before diving into each tool, I like to see everything in one place. The matrix below covers all major platforms people compare with Power BI vs Tableau.
| Tool Comparison | Power BI | Tableau | Best For |
| Power BI vs Tableau vs Excel | ✅ Handles large data | ✅ Handles large data | Excel for small tasks |
| Power BI vs Tableau vs Google Data Studio | ✅ Advanced analytics | ✅ Advanced visuals | Data Studio for quick web dashboards |
| Power BI vs Tableau vs MicroStrategy | ✅ Flexible | ✅ Visual storytelling | MicroStrategy for enterprise reporting |
| Power BI vs Tableau vs Spotfire | ✅ Business dashboards | ✅ Data science visuals | Spotfire for scientific analytics |
| Alteryx vs Power BI vs Tableau | ❌ Limited prep | ❌ Limited prep | Alteryx for data prep |
| Cognos vs Power BI vs Tableau | ✅ Modern UI | ✅ Strong visuals | Cognos for legacy enterprise |
| Kibana vs Tableau vs Power BI | ❌ Limited logs | ❌ Limited logs | Kibana for log analytics |
| Looker vs Tableau vs Power BI | ✅ Easy reports | ✅ Better visuals | Looker for cloud data |
| Qlik vs Tableau vs Power BI | ❌ Associative model | ❌ Associative model | Qlik for data discovery |
| Quicksight vs Tableau vs Power BI | ❌ Limited custom | ❌ Limited custom | Quicksight for AWS users |
| SAS vs Power BI vs Tableau | ❌ Limited stats | ❌ Limited stats | SAS for statistical modelling |
| Sisense vs Tableau vs Power BI | ❌ Embedded focus | ❌ Embedded focus | Sisense for embedded BI |
| Splunk vs Tableau vs Power BI | ❌ Log heavy | ❌ Log heavy | Splunk for machine data |
| Spotfire vs Power BI vs Tableau | ❌ Scientific focus | ❌ Scientific focus | Spotfire for research |
This matrix gives a full view of Power BI vs Tableau vs Excel, Power BI vs Tableau vs Google Data Studio, Kibana vs Tableau vs Power BI, Looker vs Tableau vs Power BI and many more.
Did you know?
Over 80% of large enterprises use BI tools for decision-making.
(Source: Forbes)
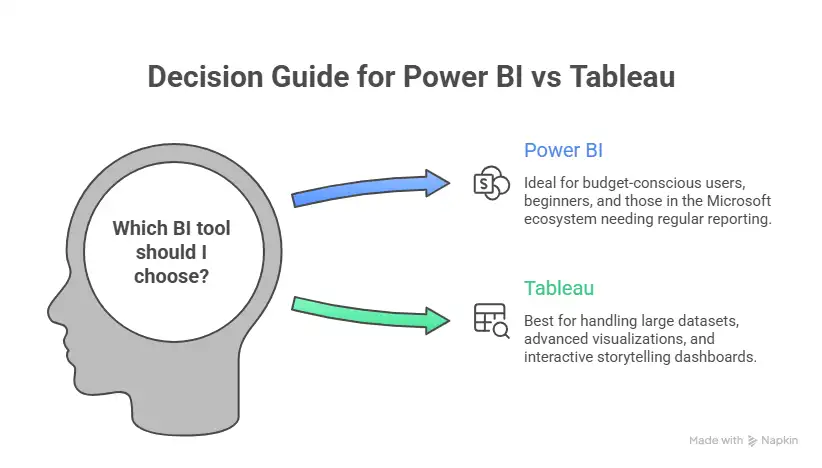
Decision Framework to Choose the Right Tool
Choosing between tools can feel confusing. I simplify it using a small checklist.
Step 1: Identify your data type
- Excel and CRM data work well with Power BI
- Large and mixed data works well with Tableau
Step 2: Identify your budget
- Low budget fits Power BI
- High budget supports Tableau
Step 3: Identify your goal
- Reporting and dashboards fit Power BI
- Data storytelling fits Tableau
Step 4: Identify your team’s skills
- Beginner team fits Power BI
- Advanced analysts fit Tableau
Choose Power BI if
- You want quick entry-level jobs
- You work with Excel or Microsoft tools
- You prefer simple dashboards
Choose Tableau if
- You want advanced analytics roles
- You enjoy data storytelling
- You work with large data sets
For many learners, the best approach is to learn both tools over time. This framework answers the common query Power BI vs Tableau, which is best in a practical way.
Also Read: Learn the Important Power BI Interview Questions and Answers
Why Choose Imarticus Learning for Data Science and Analytics
If you are serious about building a career in analytics after understanding the difference between Power BI and Tableau, then the next step is choosing a learning path that actually prepares you for real work. The Data Analytics Course from Imarticus Learning is designed with this exact focus. It combines technical skills, practical exposure and career support in one structured journey so that learners can transition into analytics roles smoothly.
Here are the key features of the program based on its official course details:
- 100% job assurance with guaranteed interviews: The program offers 10 guaranteed interviews with top companies and works with a wide hiring network of partner organisations to help learners secure roles in analytics and data science.
- Industry-aligned curriculum with 35+ tools and technologies: The program covers Python, SQL, Power BI, Tableau, machine learning, GenAI tools and more so that learners build a full-stack analytics skill set.
- Job-ready portfolio with industry-relevant case studies: The curriculum includes multiple projects and case-based assignments so that learners graduate with a strong portfolio to present in interviews.
- NSDC recognised certification for credibility: The program provides an NSDC-certified credential that is recognised across industries and strengthens professional credibility.
- GenAI integrated curriculum for future-ready skills: The program includes Generative AI tools and workflows so that learners stay aligned with current industry trends.
- Expert faculty and industry mentorship: The program is delivered by experienced trainers and industry professionals with strong domain expertise and real business exposure.
FAQs on Power BI vs Tableau
Clear answers to the most frequently asked questions help you navigate Power BI vs Tableau with confidence, covering real concerns around learning path, jobs, salary, tools and career direction in analytics.
Is Tableau better than Power BI?
When comparing Power BI vs Tableau, Tableau offers deeper visual control and handles large datasets very well. Power BI is easier to learn and costs less. Many learners start with Power BI through structured programs from Imarticus Learning and then move to Tableau for advanced analytics skills.
What is the full form of Power BI?
The full form of Power BI is Power Business Intelligence. In the context of Power BI vs Tableau, Power BI is Microsoft’s analytics platform that helps convert data into interactive dashboards and reports. Many beginners learn this tool first with guided training modules offered by Imarticus Learning.
Is Power BI enough to get a job?
Yes, learning Power BI alone can help you get entry-level analyst roles. In the Power BI vs Tableau job market, Power BI has more openings for beginner roles. Many learners build job-ready skills through industry-aligned courses by Imarticus Learning.
Which is hard Power BI or Tableau?
In the discussion of Power BI vs Tableau, Power BI is easier to learn at the beginning. Tableau takes more time to master because of its advanced visual features. Structured training programs by Imarticus Learning help simplify both tools for beginners.
Does Deloitte use Power BI or Tableau?
Large consulting firms like Deloitte use both tools based on project needs. In many client projects related to Power BI vs Tableau, teams choose tools depending on data size, visual needs and client systems.
Can I learn Power BI and Tableau together?
Yes, learning both together is possible. In the Power BI vs Tableau learning path, many professionals start with Power BI basics and then move to Tableau. Some career programs by Imarticus Learning combine both tools in one curriculum.
Should you learn Power BI or Tableau first?
Most beginners start with Power BI because it is simple. In the journey of Power BI vs Tableau, learning Power BI first builds confidence, and then Tableau adds advanced skills.
Why Power BI instead of Tableau?
Many people choose Power BI because of its lower cost and easier learning. In the Power BI vs Tableau comparison, Power BI fits small teams and startups well while Tableau fits advanced analytics use cases.
Deciding Your Direction with Power BI vs Tableau
Once you understand the full picture of Power BI vs Tableau, the choice becomes less about the tool itself and more about the kind of data work you see yourself doing every day. Some roles need quick reporting and frequent updates. Others need deeper exploration and strong visual storytelling. Both tools serve these needs well, just in different ways.
For someone entering analytics, Power BI often feels easier to begin with because it fits naturally with Excel and common business workflows. It helps in building confidence quickly and gives a clear path into entry-level roles. Tableau, on the other hand, suits those who enjoy exploring patterns in depth and presenting insights in a more visual and interactive format. It is often seen in projects where the data is large, and the presentation of insights carries high value. Once these skills are in place, switching between platforms becomes much easier, and your opportunities in the Power BI vs Tableau job market expand naturally.If you are thinking about long-term growth, it helps to learn these tools as part of a broader analytics skill set. A structured data science and analytics program offered by Imarticus Learning helps connect the dots between concepts, tools and real business problems. It also allows you to practise with real datasets and build a portfolio that reflects your ability to work with data in real situations.