Introduction: The Emergence of Data Science Careers
Data science is the refinery, and the new oil — in today’s digital-first environment, is data. It has the ability to reshape business decisions as it already influences and forecasts customer behavior or even optimises healthcare processes.
If you’re a fresher wondering about your career path, you might be probably asking: Is data science a good career for me?
The answer isn’t a simple yes or no — it depends on your interests, aptitude, and willingness to learn.
But one thing is clear — career opportunities in data science are not just growing; they are exploding.
Data science is one of the world’s top five most promising jobs, with year-over-year hiring growth at 37%, according to LinkedIn.
Here, you’ll learn in depth:
- Why data science is perfect for freshers
- What jobs you can look forward to
- What skills will help you succeed
- What courses are worth it
- What the future holds
Let’s break down the data on data science.
What Is Data Science?
Data science bridges statistics, computer programming, and business acumen to extract useful insights from data.
Fundamentally, it’s about providing answers to practical questions using data:
- What should our next product to launch should be?
- Which marketing tactic generates the most ROI?
- How can we foretell fraud beforehand?
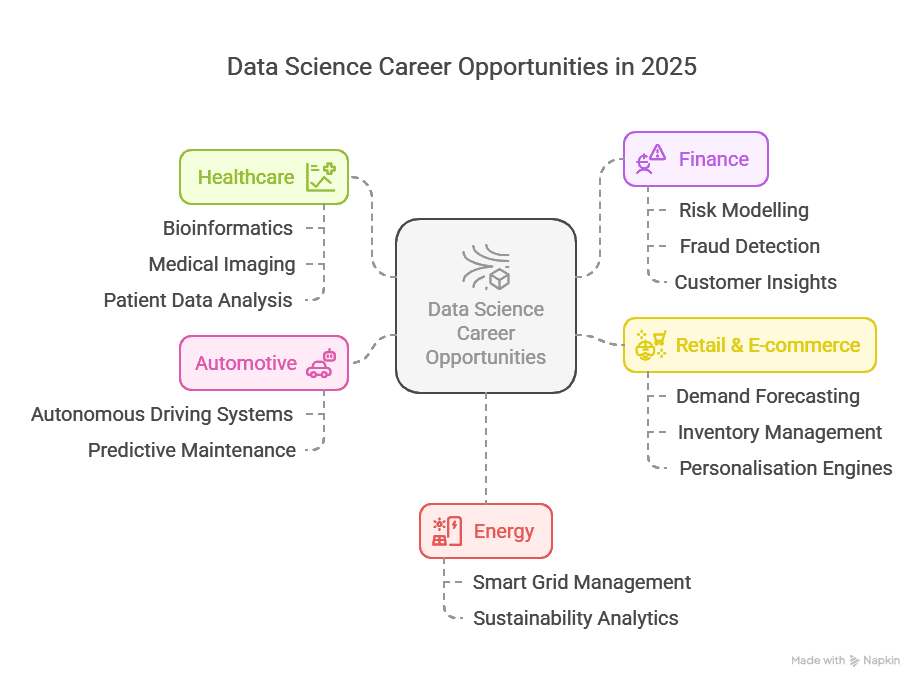
Practical Uses of Data Science
- Healthcare: Forecasting disease outbreaks
- Finance: Identifying fraud and credit scoring
- Retail: Recommendation engines and customer segmentation
- Sports: Player analysis
- Government: Policy effect and citizen services
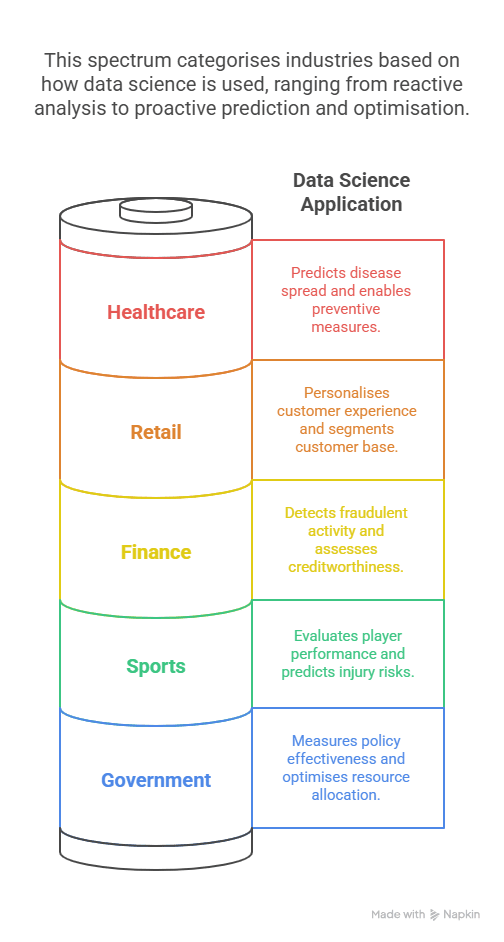
If you’ve ever seen a “Recommended for You” product, that’s data science in action.
Why Data Science Is a Good Career for Freshers
Unlike other tech roles that need years of coding experience, data science welcomes freshers who can grasp concepts and learn quickly.
Here’s why it’s beginner-friendly:
✅ Structured Learning Paths
You can start from zero by learning from courses like the Postgraduate Program in Data Science and Analytics from Imarticus Learning, which offers a comprehensive course in Data Science and Analytics.
✅ Project-Based Learning
Most courses involve real-world projects — you graduate with evidence of work.
✅ High Demand, Low Entry Barrier
Your skillset and problem-solving skills matter more to employers than degrees.
✅ Salary Growth
Data science roles have some of the best entry-level pay rates in industries.
Career Opportunities in Data Science
No one pathway — the field provides varied career paths. Let’s discuss some jobs that you can apply for as a fresher.
Entry-Level Data Science Jobs
- Data Analyst
- Junior Data Scientist
- Data Engineer (Trainee)
- Business Intelligence Developer
- Machine Learning Intern
- AI Support Associate
- Quantitative Research Analyst
These activities include:
- Data cleaning
- Making reports
- Code writing in basic Python/SQL
- Dashboards making
- Assistance in developing models
These positions entail:
| Role | Average Salary (INR/Year) |
| Junior Data Analyst | ₹5.5 – ₹7 LPA |
| Data Science Intern | ₹25,000 – ₹45,000/month |
| Business Analyst | ₹6 – ₹9 LPA |
| ML Engineer (Fresher) | ₹8 – ₹12 LPA |
Source: Payscale, AmbitionBox
These figures vary depending on the location, course qualifications, and hands-on experience.
Skills Needed for Data Science
Let’s break down the skills you’ll need into 3 tiers.
Technical Skills
- Programming: Python or R
- Data Visualisation: Tableau, Power BI
- Database Management: SQL
- Machine Learning Basics
- Data Cleaning and Preprocessing
- Statistics & Probability
Business and Soft Skills
- Analytical thinking
- Communication
- Curiosity and adaptability
- Business acumen
Data Science Tools to Learn
| Tool | Purpose | Level to Aim |
| Python | Scripting and ML | Intermediate |
| SQL | Querying data | Intermediate |
| Power BI | Visualisation | Beginner |
| Jupyter Notebook | Documentation and modelling | Beginner |
| Scikit-Learn | ML model building | Beginner |
These tools are all taught in the Imarticus Learning Postgraduate Program in Data Science and Analytics.
A Unique Insight: The “Proof of Work” Era
Traditional degrees are being overtaken by “proof of skill.”
What does it mean?
- Firms desire projects, not papers
- A GitHub portfolio is stronger than a résumé
- Hackathons and Kaggle competitions are the new recruitment grounds
In fact, as per a 2024 Coursera report, 55% of hiring managers indicated that they’d employ a fresher with project-based certification over a master’s degree candidate.
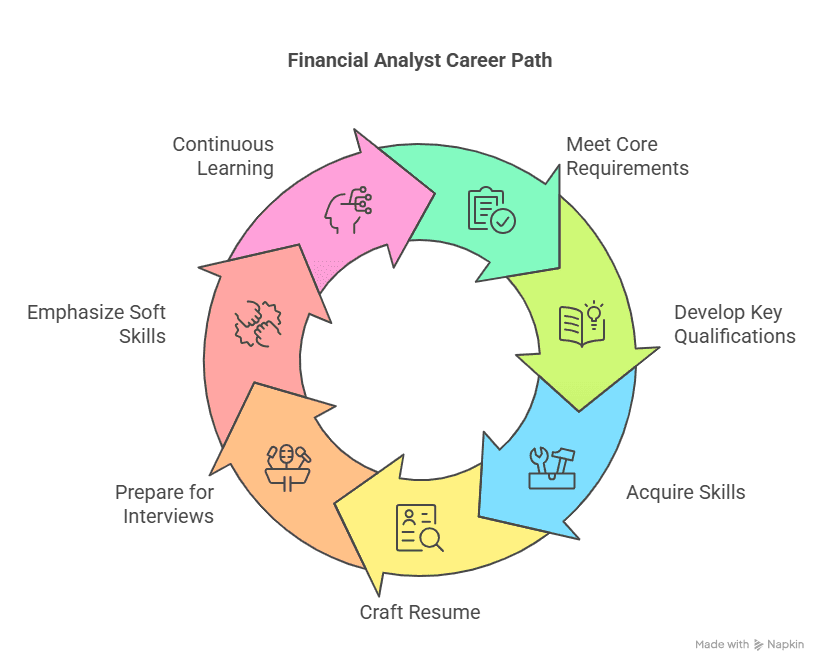
Career Development Path in Data Science
Data science provides one of the most rewarding and versatile career development paths.
Common Growth Path
- Data Analyst (0–1 year)
- Associate Data Scientist (1–3 years)
- Senior Data Scientist (3–5 years)
- Data Science Manager/Lead (5–8 years)
- Chief Data Officer / Consultant (8+ years)
With each step, responsibility, project scope, and, of course — increased compensation.
The best thing? Progression is merit-based, not age-dependent.
Career Opportunities for Data Science Entry-Level
Let’s discuss numbers once more.
- More than 70,000+ data analyst and scientist jobs posted on Indian job sites
- The demand is international in the US, UK, Singapore, and the Middle East
- BFSI, Healthcare, E-commerce, EdTech, and Logistics industries are hiring
- India is anticipated to have over 11 million analytics jobs by 2026, as per India Brand Equity Foundation.
The Future of Data Science Careers
The future looks bright, with innovation occurring quickly.
What’s Coming:
- AutoML: AI that builds models with little human intervention
- Explainable AI: Models that explain why they made a choice
- Data Privacy Engineering
- Predictive Analytics in Finance
- No-code Data Science Tools
Predictive analytics is a prime skill in finance and analytics roles — perfect for those who are into finance + data science.
Best Courses to Begin Your Journey
The Imarticus Postgraduate Program in Data Science and Analytics is created for the fresher to start his or her career in the industry.
Why It Is Special:
- Teaches full-stack capabilities from Python to ML
- Contains industry capstone projects
- Provides job placement assistance
- Trained by industry professionals
- Suits any graduate from any stream
How Long to Get Job-Ready?
Average 4–6 months with:
- 10–12 hours of study each week
- 2–3 projects
- 1 ready GitHub portfolio
- 1 mock interview round
Need a roadmap? Here’s what your first 12 weeks could be like:
| Week | Focus Area |
| 1–2 | Python Basics + Data Types |
| 3–4 | SQL + Data Cleaning |
| 5–6 | Statistics + EDA |
| 7–8 | Power BI/Tableau + Dashboards |
| 9–10 | Machine Learning Basics |
| 11–12 | Capstone Project + Interview Prep |
FAQs: Is Data Science a Good Career for Freshers?
1. Is data science difficult to learn for non-tech students?
Not at all. Several students from commerce and humanities have made the switch successfully.
2. Which one is preferable: a certification or a master’s degree?
It depends on your intention. If you need to get employed quickly, a project-based certification is better.
3. Can data science be a remote job?
Yes. A lot of companies have remote positions in data science, particularly at the entry level.
4. Do I require a laptop with heavy specs?
Mid-range laptops (8GB RAM, SSD) are enough to start with.
5. What is the stability of this job?
Very stable. Provided you continue to enhance your skills, the industry always has room for you.
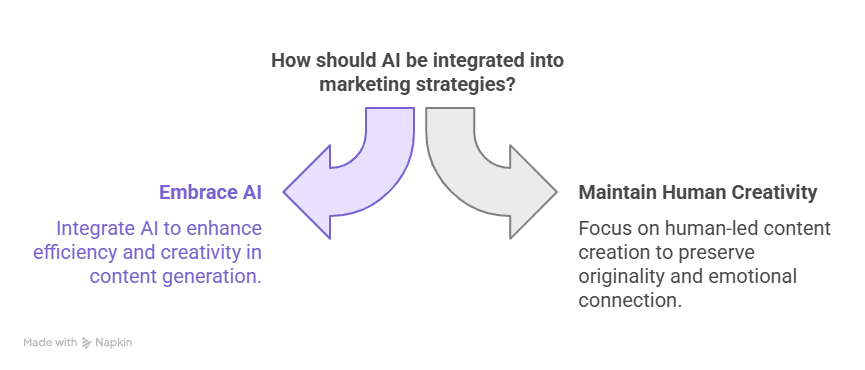
6. Will AI destroy data science jobs?
AI will transform how we work and not replace us. Human discretion in interpreting data is priceless.
7. Can I transition from BCom or BBA to data science?
Yes. Many top data scientists have a business background and employ predictive analytics in finance as a transition.
8. Which firms recruit freshers/ job prospects for data science beginners?
TCS, Accenture, Capgemini, Cognizant, Flipkart, and startups in India.
9. What’s the future salary scope?
With experience of 5+ years, professionals can have a salary of ₹25–35 LPA in best companies.
10. Do I have to learn advanced maths?
No. Maths and statistics of high school level will be enough to begin.
Conclusion
So, is data science good for freshers? Definitely.
With formal training, practice, and proper guidance, even individuals with no background in tech can enter this high-potential profession.
If you’re attracted by the paychecks, diversity of work, or pure demand — data science provides new entrants an advantage in a cutthroat job market.
Key Takeaways
- Data science is an entry-level career with thousands of job openings and increasing demand.
- Certifications and live projects are more important than your degree or experience.
- Programs such as Imarticus’ PGP provide a systematized roadmap to becoming 4–6 months job-ready.
Ready to Launch Your Data Science Career?
Discover the Postgraduate Program in Data Science & Analytics by Imarticus Learning and join thousands of learners who’ve already made the transition.
Upskill today, build tomorrow’s career.