Beat the market: Learn Computer Vision in Python

Are you looking to learn a new skill that can give you an edge over your competition? If so, then you should consider learning computer vision with Python. This powerful programming language has become increasingly popular in recent years and is perfect for tackling complex computer vision tasks.

This blog post will discuss computer vision and learn it using Python. We will also provide a few resources to get you started!

According to the World Economic Forum, nearly half of all jobs will get replaced by automation within the next 20 years. To stay relevant in this speedily changing world, we must learn new skills that can help us adapt and succeed.

One such skill is computer vision which allows you to teach computers to see as humans do! It’s an excellent process to stand out from the crowd, and you can use it in various industries such as security, manufacturing, healthcare, and more.

What is computer vision?

It is a field of AI that trains machines to understand the content of digital images or videos. You can do it by using algorithms, machine learning techniques, and deep learning networks to identify objects in an image or video frame.

With Python programming language, it’s possible to create programs quickly without having profound knowledge about computer vision algorithms or models. 

Tips to get started with computer vision in Python

There are many different ways to get started with computer vision in Python.

OpenCV library:

The OpenCV library is a popular choice for working with computer vision in Python. It provides a wide range of functions that allow you to efficiently perform tasks such as object detection and feature extraction from images or video streams. 

Scikit-learn library:

The Scikit-learn library is another popular choice for working with computer vision in Python. It provides a range of algorithms for performing image classification, object detection, and regression analysis tasks. 

Keras library:

The Keras library is another popular choice for working with computer vision in Python. It provides a high-level neural networks API, making it easy to build and train deep learning models. 

Tensorflow library: 

The Tensorflow library is another popular choice for Python computer vision. Python’s high-level programming language provides an API for building and training neural networks.  

Matplotlib library: 

The Matplotlib library is another popular choice for working with computer vision in Python. It provides a high-level API for creating charts and graphs using the Matplotlib library is another popular choice for working with computer vision in Python.

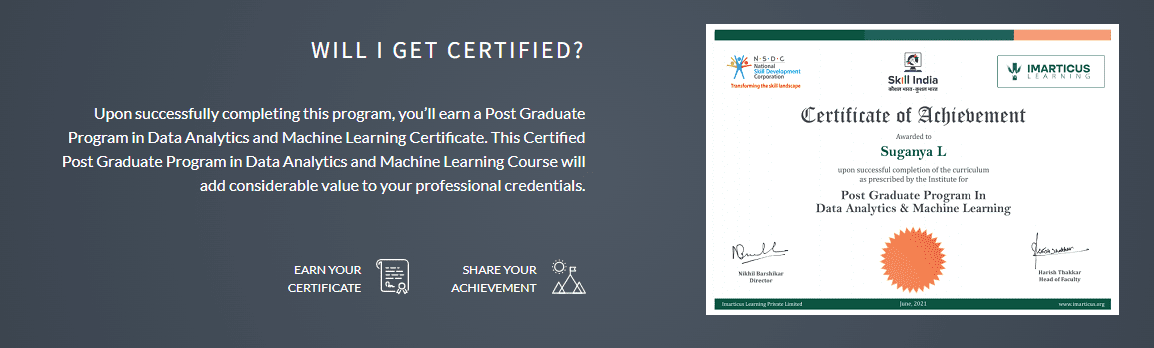
 Discover AIML Course with Imarticus Learning

The Artificial Intelligence and Machine Learning certification collaborate with industry professionals to deliver the most satisfactory learning experience for aspiring AIML students.

best artificial intelligence courses by E&ICT Academy, IIT Guwahati
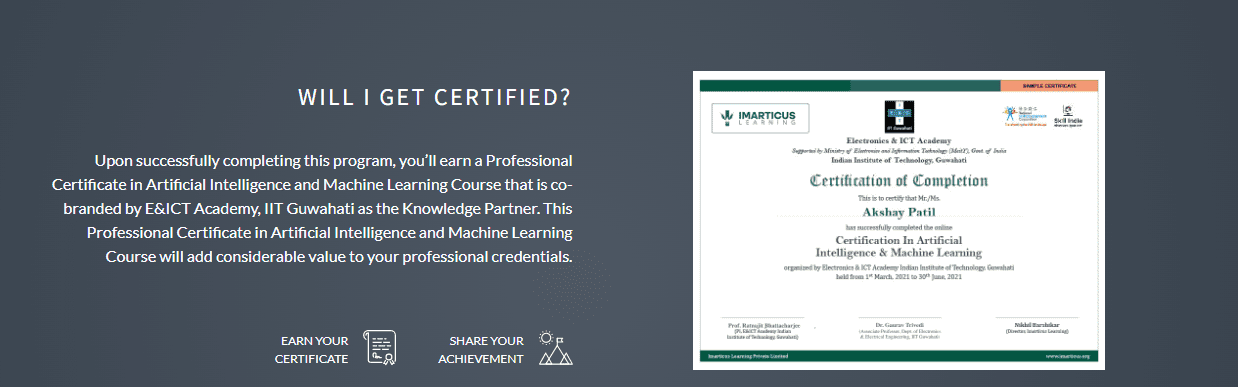
This intensive Python certification will prepare the student for a data scientist, Data Analyst, Machine Learning Engineer, and AI Engineer.

Course Benefits For Learners:

  • This Supervised Learning course will help students improve their Artificial Intelligence basic abilities.
    Students can take advantage of our Expert Mentorship program to learn about AIML in a practical setting.
     
  • Impress employers and demonstrate their AI talents with a Supervised Learning certification supported by India’s most famous academic collaborations. 
  • This course will help students gain access to attractive professional prospects in Artificial Intelligence and Machine Learning.

How to get started in Python: An overview of recent trends

Are you very interested in programming? Then you need to know the programming language Python. No, it’s not exactly about pythons and snakes, so you can let your puppy loose.

Why Python, specifically? It’s approachable, simple, and adaptable to a range of situations. And because a growing number of programmers all around the world are using and appreciating it.

In fact, according to a recent rating published by IEEE Spectrum (a prestigious engineering and applied science newspaper), Python will be the most used programming language in 2020, followed by JavaScript, C++, C, and Java.

Python’s popularity has been stable in recent years, and this trend is unlikely to reverse. Python tutorials are the most popular on Google, according to the PYPL portal, and everyone wants to learn Python nowadays.  

This explains why Dropbox, Netflix, Facebook, Pinterest, Instagram, and Google all employ Python in their technical growth. Additionally, NASA is included in this list of “tech celebrities” that use Python. Do you see why it’s important for you to be aware of it?

Python is quite popular, and everyone wants to learn more about it. You, too, would not be reading this article if you weren’t.

Projects and programs made in Python

  • Netflix

Netflix, the platform that had a growth of 16 million subscribers during the first quarter of 2020, also uses Python. Its engineers prefer this programming language mainly because of its available libraries.

  • Instagram

Yes, the app you use to share images frequently uses the Python programming language on its backend (what runs on a server). In other words, Instagram is implemented on the open-source web development framework Django which is written entirely in Python.

  • Google

This is one of the big projects that also use the Python programming language, in addition to C++ and Java.

What are the characteristics of Python?

The Python programming language is known for being simple, quick, and having a short and easy learning curve. It is free to use and share because it was created under an open-source license.

But what does “multi-platform”, “multi-paradigm” and “interpreted” mean, here is the explanation:

– Multi-platform: Python can operate on a variety of platforms, including Windows, Mac OS X, Linux, and Unix.

– Multiparadigm: Because it is a programming language that allows a variety of programming paradigms (development models), programmers are not forced to utilize a particular style. Python supports which programming paradigms? Programming styles include object-oriented, imperative, and functional programming.

– Interpreted: Python “interprets” the programmer’s code, which implies it both interprets and executes it.

Python may also be used as an extension language for applications that require a programmable interface since it is dynamically typed (when a variable can take values of multiple kinds or adapts to what we write).

What is Python and what is it for?

Python is a multi-paradigm, multi-platform interpreted programming language used mostly in Big Data, Artificial Intelligence (AI), Data Science, testing frameworks, and web development. Due to its vast library, which has a wide range of features, it qualifies as a high-level general-purpose language.

In 1989, Guido van Rossum, a Dutch programmer, decided to construct an interpreter for a new scripting language he was developing.

His significant expertise in creating the ABC system – an interactive, structured, high-level programming language – aided his efforts to develop a language that was more intuitive, simpler, more powerful. Python, the successor of the ABC language, was born in 1991 (yep, he is a millennial at 29 years old).

Conclusion

At Imarticus we offer a Data Analytics course where you will learn more about how to get started in Python and you will receive more than an overview of recent trends. Visit our website today and enroll in one of our analytics programs. 

Top 7 career options in data analytics

The world of data analytics is constantly growing and changing. With the help of new technologies, we can do more with data than ever before. The data analyst field has seen massive growth in recent years. Data analysts use their skills and knowledge to analyze large data sets and turn them into meaningful information.

Companies or organizations can use it for business purposes such as making decisions on product lines or marketing campaigns or personal reasons like choosing a career path.

The job markets for data analytics are flourishing, and the number of jobs is growing. Data is everywhere, and a career in data analysis has never been more straightforward or promising. 

Data Analytics Careers: The Top Seven Choices

Data analytics is a booming industry, and the job market shows no sign of slowing down. Data Analytics jobs are in high demand across all sectors at every career level, from entry-level to executive management. There are numerous possibilities while choosing your career as a data analyst! 

Here are seven popular choices for entering the world of data analysis:

Data analyst: This is the most common role in data analytics and refers to a professional who extracts insights from data using various techniques, such as statistical analysis and machine learning.

Data engineer: Data engineers are in charge of designing, building, and maintaining the architecture and infrastructure for collecting, processing, and storing data.

Data architect: Data architects work with large quantities of complex data to design high-level structures that inform how they should get stored in a database or file system. This role is especially relevant in big data projects where you need an experienced professional dealing with terabytes of data.

Data scientist: A data scientist is a statistician who analyzes patterns in large sets of complex datasets to extract meaning and information that can be used for decision-making or reporting the findings back to the business stakeholders.

Business analyst: This role involves working with company executives, project managers, marketing teams, and other business professionals to identify and define business problems addressed with data analytics.

Data visualizer: Data visualization is the process of transforming data into graphical representations that are easy to understand, communicate and share. As a data visualizer, you’ll be responsible for designing and creating effective charts, graphs, and other information graphics to help others visualize the data.

Data manager:  Data Manager is responsible for designing and maintaining an enterprise-wide database and overseeing compliance with records management policies.

Learn Data Analytics online with Imarticus Learning

Learn the fundamentals of data science and critical analytics technologies, including Python, R, SAS, Hadoop, and Tableau, as well as nine real-world projects. This data analytics certification course helps students get in-demand future abilities and begins their career as data analysts.

What students draw from this course:

  • Students can participate in fascinating hackathons to solve real-world business challenges in a competitive scenario.
  • Impress employers & showcase skills with data analytics certification courses recognized by India’s prestigious academic collaborations.
  • World-Class Academic Professors to learn from discussions and live online sessions.

Contact us via the chat support system, or drive to one of our training centers in Mumbai, Thane, Pune, Chennai, Bengaluru, Delhi, and Gurgaon.

Top 10 Hacks to speed up your data analysis

Data analysis can be a tedious task. Sometimes it feels like there is so much data and not enough time to analyze it all. But some simple tricks will save you a ton of time! In this blog post, we will share 10 top hacks to speed up your data analysis process. You’ll learn to quickly find insights in data without wasting precious hours waiting for programs to run or crunch numbers.

Ten hacks to speed up data analysis

  1. Use hash tables instead of unsorted arrays:
  • An unsorted array is an ordered collection of objects accessible by numerical index, where the index indicates the sequence of its element’s appearance in the variety.
  • A hash table is an associative array, map, lookup table, and dictionary (in programming languages with a limited vocabulary, as Python), a data structure that associates keys to values. 
  1. Store data in row-major order:
  • Use row-major order when storing data, which is faster to load into memory. Row major storage orders memory by rows.
  • Row major storage orders memory by rows instead of ordering memory by columns (called column-major storage).
  1. Group like items in buffers:
  • To speed up processing, store data in the most efficient order. 
  • For example, focus on grouping items in separate buffers instead of creating a different pad for every item.
  1. Store many data sets in memory:
  • If your data sets can fit into the RAM, many data sets into memory by using a hash table to map from keys to their corresponding data sets.
  1. Use persistent objects to pass data between function calls:
  • Endless things are less expensive to construct and maintain than ephemeral objects.
  • For example, instead of passing data from one function call to another, give object references and update the thing as needed.
  1. Use a meta-object system to add behavior to data:
  • A meta-object system is a software framework that provides ways to add behavior to objects.
  • Use a meta-object system to add behavior to data so that you don’t have to write the same code for every data set.
  1. Avoid garbage collection overhead:
  • Avoid using a garbage collector to reclaim unused memory if you can avoid it because the garbage collector has overhead that slows down the program.
  1. Reuse objects instead of allocating new ones:
  • To reuse objects, maintain a cache of things that get frequently used.
  • Enable garbage collection only after the cache has filled up since garbage collection is less expensive if the stock is entire.
  1. Create only the objects you need:
  • Create only the objects you need to reduce memory allocations and garbage collection overhead.
  1. Use language-specific techniques:
  • If possible, use language-specific techniques to avoid memory allocations that you can prevent in languages with control over memory allocation.

Explore and Learn with Imarticus Learning

Industry specialists created this postgraduate program to help you understand real-world Data Science applications from the ground up and construct strong models to deliver relevant business insights and forecasts. This program is for recent graduates who want to further their careers in Data Analytics course online, the most in-demand job skill. With this program’s job assurance guarantee, you may take a considerable step forward in your career. 

Some course USP:

  • These data analytics courses in India to aid the students in learning job-relevant skills.
  • Impress employers & showcase skills with the certification in data analytics endorsed by India’s most prestigious academic collaborations.
  • World-Class Academic Professors to learn from through live online sessions and discussions.

Contact us through the chat support system or visit Mumbai, Thane, Pune, Chennai, Bengaluru, Delhi, and Gurgaon, training centers.

Here’s why music created by AI is better than you think

Artificial Intelligence or AI is capable of carrying out tasks that are much more advanced than just arranging words to generate lyrics. AI already has the ability to offer an immersive listening experience by adapting to a user’s preference. As seen in Spotify and Apple Music for a long time, AI systems understand the user’s preference and recommend songs that the user will enjoy.

AI has gone a step further and now is also able to compose completely personalized music for users. AI can understand certain benchmarks such as harmony, structure, and balance, using which, AI models can generate songs or background music based on the input provided by the user.

Is AI Capable of Creating Better Music Than Humans?

If AI is able to compose music without human supervision, people who need background tracks or copyright-free songs might not need music producers or artists as much as they currently do. Purchasing AI-created music also is easier as there are no royalties while the music generation process would be faster and available on demand.

Yes, with vast amounts of data and training, AI can help in creating a very capable autonomous music generation system, however, it will still be relying on historic data and other pieces of music in order to generate future songs. But, due to the vast amount of data available, the probabilities are limitless and if taught to truly identify good music, AI can become capable of generating hit songs one after another using the very same data.

Even coming up with new songs are just mathematical likelihoods for AI and by analyzing enough combinations, AI is bound to come up with good music. Similarly, meaningful lyrics can also be generated with Natural Language Processing or NLP. However, it will take a while till AI systems become as sensitive to the context of lyrics and innovative in using musical notes.

How AI is Helping in Creating Music?

Even though completely AI-generated music has not reached the Billboards Top 10 yet, services such as AIVA uses AI and Deep Learning models for composing soundtracks and music for users. This helps both small content creators and mainstream celebrities generate music for YouTube, Tik Tok, Twitch or Instagram. This is a cheaper alternative as well. Amper is another great online tool for content creators and non-musicians to make royalty-free music based on their own preferences and parameters. Amper has been created by the music composers who are behind creating the soundtrack for movies such as ‘The Dark Knight’. 

Alex the Kid is a UK-based Grammy-nominated music producer who has used ‘heartbreak’ as a theme and with the help of Machine Learning (ML) and Analytics, has created the hit song ‘Not Easy’. The song even features celebrity music artists such as Wiz Khalifa, Sam Harris, and Elle King.

The hit song had reached the 4th rank in iTunes’ ‘Hot Tracks’ chart within 2 days of its release. Alex used IBM Watson for analyzing billboard songs of the last 5 years as well as cultural and socially relevant content, scripts, or artifacts in order for including references to these elements within the song. Then, the producer used Watson BEAT, the ML-driven music generation algorithm powering the cognitive system for coming up with various musical backgrounds till he found the most suitable combination. 

Conclusion

Artificial intelligence and Machine learning courses can definitely help one learn AI topics for getting involved in interesting projects such as those mentioned above. A Machine Learning and Artificial Intelligence course, such as one offered by Imarticus, are essential for building AI systems such as soundtrack generators or lyrics generators. 

Understanding the basics of data visualization with python

Data visualization has become an increasingly important part of the data analysis process in recent years. Many analysts have found that a picture is worth a thousand words, and in this case, it just might be true. You could say that good data visualization can save even more than 1,000 words–it can save lives! Let’s explore some basics of making compelling visualizations with Python.

What is Data Visualization?

Data visualization represents data in a visual form. You can use visualizations to help people understand data more efficiently, ranging from simple graphs to complex infographics. Data visualization is an increasingly popular field with many practical applications. For example, you can use it for business intelligence gathering and analysis or education purposes. Some experts consider data visualization to be a vital part of the expanding field of big data.

Data types and how they get visualized?

There are many types of data, including categorical, univariate, multivariate normal, and so on. Data visualization methods vary depending on the type of data represented. For example, there are several other ways to express categorical data than with graphs.

Univariate data is usually best displayed in a simple bar graph or line graph. Categorical information is often best represented by a pie chart. Multivariate data can be shown in a radar graph or spider chart, while multivariate average data get visualized with a scatter plot.

How to use Python for data visualization?

Python is an easy-to-use programming language that You can use for data visualization. Many libraries, including matplotlib, make it possible to create visualizations without much technical knowledge.

You can even create interactive online visualizations using Python. For example, you can use Python to create visualizations for the Vega-Lite specification, which allows you to create interactive online data visualization. Due to its flexibility and ease of use, it has become one of the most popular languages for data science. It is perfect for working with large amounts of data because it can easily handle large lists or arrays.

Python-based data visualization libraries are beneficial because they typically allow for rapid prototyping of visualizations. It makes them an excellent choice for exploratory data analysis because you can quickly try out different algorithms and processes. The downside is that they can sometimes be challenging to use for more complex projects.

Explore and Learn Python with Imarticus Learning

Industry specialists created this postgraduate program to help the student understand real-world Data Science applications from the ground up and construct strong models to deliver relevant business insights and forecasts. This python tutorial is for recent graduates and early-career professionals (0-5 years) who want to further their careers in Data Science and Analytics, the most in-demand job skill.

Some course USP:

This Python for data science course for students is with placement assurance aid the students to learn job-relevant skills.


Impress employers & showcase skills with the certification in Python endorsed by India’s most prestigious academic collaborations.

World-Class Academic Professors to learn from through live online sessions and discussions.

What’s happened to the data analytics job market in the past year?

A data scientist has been one of the topmost jobs people have been trying to land for a long time. And well after witnessing the benefits of data science and analytics in literally every sector, there is no wonder why. It helps in fields like education, retail, customer service, the health sector, and tourism. It helps corporate firms where it matters. That is, in processing, analyzing, managing, and storing a vast amount of data.

It also helps them to make predictions according to the changing market trends and client demands. This is why it is important to learn data analytics if you want to pursue a career as a data analyst

A lot of institutions offer good data analytics courses in India. Check out Imarticus Learnings’ data analytics certification course to hone your skills properly. This will provide you with enough exposure and real-life experience which, in turn, will help you land your dream data analytics job

However, last year saw the data analytics job falling behind in the charts for the first time. Now, is it finally coming down from its throne, or is it just another victim of the coronavirus? That is what we are trying to figure out here. Keep reading to learn more.

Is the market decreasing or a victim of Covid-19?

2020 saw a lot of upheavals globally. From educational institutions being shut down to corporate offices going on hiatus for months and some small businesses going out of business altogether, it was a year of getting used to the new normal. With that came the trend and the necessity to work from home.

Not to mention the terrible loss people faced all over the world. Unfortunately, with the new variant on the rise once again, the troubles seem far from over as of now. This also caused a lot of people out of jobs overnight. Not only that, but a lot of jobs went out of practice as well. 

People are still figuring out how to cope with this unprecedented situation. So, as of now, it is really up for debate as to what caused this upheaval in the hierarchy of job positions. Some things come into play though when it comes to changing market trends. Let us look at the situation by trying to analyze those.

Economic factors that factor into changing trends

About three major factors disrupt an ongoing situation, especially in the job market. Those are, as follows:

  • Demand: The reason why any job ranks as the topmost is its demand. Thankfully, the demand for a data analytics job is still very high, as it still ranks as number three on the list. So, the era of data science is far from over.
  • Supply: The supply of data scientists is quite low as of now. And, it seems that it is going to stay that way for years, so the job is going to keep reigning over for a long time.
  • Growth: Growth is a major factor when it comes to any job being relevant. And, the market for data scientists is still growing. In fact, if reports are to be believed, then this field saw an increase of about 650% since 2012. So, it is safe to say that the market will remain relevant in the coming years.

Conclusion

To begin your career as a data analyst, you need to learn from the best. Check out Imarticus Learnings’ data analytics course and boost your career to the max. 

What 60% of data analytics learners do wrong

Data science is a field that is as demanding as it is difficult. It has become a necessary part of our lives. Whether managing education, retail or corporate, data analytics has come in really handy in recent years. Corporate especially is a field where data analytics helps a lot as there are always big amounts of data to be processed. It is in no way an easy job. The job market is also very demanding, but thankfully numerous positions are being offered across the globe. 

This is why if you are thinking of switching to a data analytics career, then you should learn data analytics properly. Fortunately, a lot of institutions in India offer compact courses on it. Such an institution is Imarticus Learnings who offer a solid data analytics certification course with placements. This will not only cover the basics of ‘what does a data analyst do’ but also hone your skills to a different level. Now, here, we are going to elaborate on some primary mistakes that a majority of data analytics learners do wrong to help you avoid them altogether. Please read on to learn more.

What does a data analyst do?

A data analyst needs to process big data, including the current trends of a market, the inefficiencies present in the current system of a company, changing market trends, changes in customer demands, and so on very quickly. This is the only way to analyze certain problems and address them accordingly. Data analysts need to make suggestions for a more profitable approach for the company that they are in. They also need to collaborate with other departments to make a plan that works for all and even supervise it regularly. So, mistakes are not appreciated.

The mistakes to avoid

There are some primary mistakes that beginners end up making that can become harmful to their careers. They are, as follows:

  • Jumping into things headfirst: You need to analyze the problem first properly before jumping into conclusive solutions. The best way to deal with this is to scope the entire value of delivery from the get-go. This comes in really handy later as it gives a clear value of what data science can bring with each step.
  • Exploratory Data Analysis (EDA) is a must: Although EDA might seem like a tedious aspect, it is a must. It gives you the edge in both competitions and real-life projects. Skipping it entirely and jumping straight into modeling can turn out to be a real problem later on.
  • Spend time on feature engineering: This is directly linked to your building models. You need to spend enough time building predictive parameters after the initial processing and cleaning of a data set. Although directly jumping to grid searches and model building without this might work in some cases, that does not work well when you are trying to build a proper score.
  • Global models are part of the process: It is necessary to have the entire picture in mind before getting into projects seriously. This will help you make a plan with minimum efficiency and easier structures if the client has limited resources.


  • You also need to talk to domain experts regularly as they can provide insights you might overlook sometimes.
  • Know the basics properly.
  • Improve your connections.

Conclusion

The job can seem intimidating at first, but there are also some seriously interesting aspects to it. For a better understanding, learn data analytics with Imarticus Learnings’ data analytics certification course to give your career the boost it needs.

What no one will tell you about data analytics job applications

Do you know what the data analytics job roles are? At Imarticus we look at the keys to this professional profile, what their work consists of and the main requirements to start a career as a data analyst. We also tell you all you should know about data analytics jobs.

We are surrounded by data that, while it may not mean much in its raw form, can give significant value to many businesses and organizations when analyzed and turned into information. It’s not about who has the most, but who gets the most out of it at the end of the day.

The data analyst is a specialist who converts data into information so that they may make better-informed judgments. To that goal, these experts complete the following tasks:

In the discipline of data engineering, consider the following:

– Data acquisition: 

  • Dataset identification: data may be found in a variety of places (e.g. databases, social networks, etc.).
  • Acquisition: strategies for retrieving data for data analysis and processing.
  • Review of the information gathered (structure).

– Preparation: 

  • Exploration: using strategies to gain a better understanding of the data through preliminary analysis and a study of its nature (correlation, trends…).
  • Data cleansing (incoherent, duplicated, incorrect values, etc. ), transformation, and packaging into useful/manageable structures for processing.

In the subject of computational data science, there are a few things to keep in mind:

– Analyze: by deciding on the best strategies and creating processing models (predictive models, classification, clustering, etc.).

– Dissemination of data analysis/processing outcomes.

– Using the model’s conclusions in real-world situations, such as decision-making.

Data analyst profile

Due to the incipient process of digital transformation that many firms and organizations that already have a huge quantity of data but don’t know how to use it to gain commercial benefits have begun to handle, the data analyst’s profile is one of the most in-demand today.

With the rise of new occupations coming from technology demand, such as data analysts, the necessary training to perform the activities of this profile may be obtained in a variety of methods. STEM (Science, Technology, Engineering, and Mathematics) degrees are the ideal place to start if you want to learn the fundamentals of this field.

There are also many postgraduate and master’s degrees available to become an expert in this sector, such as a master’s degree in Big Data Analysis and Visualisation / Visual Analytics & Big Data.

Requirements to be a good data analyst

– Communication skills: describing the outcomes of the task to company or organization managers and directors who do not have a technical background.

– Dashboard design and implementation experience, particularly in the area of business intelligence.

– Familiarity with distributed storage systems

– Technological and “Machine Learning” foundation: algorithm creation, programming languages and databases management, and so on.

– Computer science, mathematics, and statistics knowledge: these profiles must be able to analyze databases, construct models, and forecast statistics, among other things.

– The capacity to evaluate data and draw judgments based on it is critical.

– The capacity to synthesize data in order to derive meaningful and relevant information.

– Analytical and creative skills: methodical, systematic, and creative workers do their tasks carefully, analyzing and processing data to develop answers to issues or company demands.

– Business acumen: understanding of the industry and the activities of the firm for which you work, as well as the ability to apply that knowledge to identify problems that can be solved through data analysis and processing.

Conclusion

If you want to find out what data analytics job roles entail, at Imarticus, we look at the most important aspects of this profession, what they do, and what it takes to get started in your career as a data analyst. We also cover all you need to know about data analytics jobs.

Which languages should you learn for data analytics?

Data science is a fascinating topic to work in since it combines high statistical and mathematical abilities with practical programming experience. There are a variety of programming languages in which a prospective data scientist might specialize.

In this article, we will tell you how by learning machine learning and taking a python course you can obtain a Data analytics Certification

big data analytics courseWhile there is no one-size-fits-all solution, there are various factors to consider. Many factors will determine your performance as a data scientist, including:

  • Specificity: When it comes to sophisticated data science, re-inventing the wheel each time can only get you so far. Master the numerous packages and modules available in the language of your choice. The extent to which this is feasible is determined by the domain-specific packages that are initially accessible to you! 
  • Generality: A smart data scientist will be able to program in a variety of languages and will be able to crunch statistics. Much of data science’s day-to-day job is locating and processing raw data, sometimes known as ‘data cleaning.’ No amount of clever machine learning software can assist with this. 
  • Productivity: In the fast-paced world of commercial data science, getting the work done quickly has a lot of appeal. This, however, is what allows technical debt to accumulate, and only rational procedures may help to reduce it.
  • Performance: In some circumstances, especially when working with enormous amounts of mission-critical data, it’s crucial to maximize the performance of your code. Compile-time languages are often substantially quicker than interpreted languages and statically typed languages are far more reliable than dynamically typed languages. The clear trade-off is between efficiency and productivity.

These can be viewed as a pair of axes to some extent (Generality-Specificity, Performance-Productivity). Each of the languages listed below can be found on one of these spectra. 

Let’s look at some of the more popular data science languages with these key ideas in mind. What follows is based on research as well as personal experience from myself, friends, and coworkers – but it is by no means exhaustive! Here they are, roughly in order of popularity:

    • R: R is a sophisticated language that excels in a wide range of statistical and data visualization applications, and it’s open-source, which means it has a vibrant community of contributors. Its current popularity is a reflection of how effective it is at what it accomplishes. 
    • Python: Python is a fantastic language for data research, and not only for beginners. The ETL process is at the heart of most of the data science processes (extraction-transformation-loading). Python’s generality is appropriate for this task. Python is a tremendously interesting language to work with for machine learning, thanks to libraries like Google’s Tensorflow.
    • SQL: SQL is best used as a data processing language rather than as a sophisticated analytical tool. Yet ETL is critical to so much of the data science process, and SQL’s endurance and efficiency demonstrate that it is a valuable language for the current data scientist to grasp. 
    • Java: There are several advantages to studying Java as a primary data science language. Many businesses will value the ability to easily incorporate data science production code into their existing codebase, and Java’s performance and type safety will be significant benefits. However, you won’t have access to the stats-specific packages that other languages provide. That said, it’s worth thinking about, especially if you’re already familiar with R and/or Python.


  • Scala: When it comes to working with Big Data using cluster computing, Scala + Spark are wonderful options. Scala’s characteristics will appeal to anybody who has worked with Java or other statically typed languages. However, if your application doesn’t deal with large amounts of data, you’ll likely discover that adopting alternative languages like R or Python will increase your productivity significantly.


Conclusion

At Imarticus we commit to giving the best quality education, so if you are interested in getting a data analytics certification, taking a python course, and learning machine learning come and visit us! 

Related Article:

https://imarticus.org/what-are-top-15-data-analyst-interview-questions-and-answers/