


Last Updated on 4 weeks ago by Imarticus Learning
Data is already part of your daily routine. You check a ride app and compare surge prices. You open a food app and see which restaurants show up first. You scroll through a fitness app and notice a drop in steps after a long work week. Each of these small moments is powered by data that has been shaped into a simple visual. It helps you decide without thinking too hard.
Now pause and ask yourself something.
→ What if you could take the same idea and apply it to your own questions?
→ What if you could look at your monthly expenses and see the pattern of small spends that add up?
→ What if you could take match statistics from your favourite cricket league and show how a player performs in pressure overs?
→ What if you could track your learning hours and see how your focus changes across the week?
These are not complex research problems. These are everyday patterns waiting to be seen clearly, which a data analytics certification can help you get the hang of.
This is where Tableau Public becomes useful in a very practical way. It turns ordinary data into something you can look at and understand in seconds. It lets you move from a sheet full of numbers to a story that makes sense to anyone who sees it. You do not need to explain every detail. The visual does that work for you.
The real value shows up when you keep going. Your first visual may be basic. Your next dashboard will be cleaner. After a few projects, you start paying attention to layout, colour, and clarity. You start thinking about how a viewer will move across the screen. You start shaping a clear story with data.
If you are ready to turn everyday data into something meaningful and visible, the next sections will guide you through each step. From setting up Tableau Public to building and sharing dashboards, you will see how simple actions can lead to strong outcomes.
Did you know?
According to Tableau usage statistics, people process visuals 60,000 times faster than text. This is why dashboards are more effective than long reports.
A Quick Tableau Public Overview Before You Start Building Dashboards
When I first came across Tableau Public, I saw it as a simple way to turn raw numbers into stories that anyone could understand. Over time, I realised it is more than a free tool. It is a platform that lets anyone build data stories and share them with the world in seconds.
At its core, Tableau Public is a free data visualisation platform. It allows you to connect to data, build charts, and publish dashboards online. Everything you create is stored in the cloud and is publicly visible.
Tableau Public is designed as a simple flow. You bring in data, you build visuals, and you publish your work online. Each part connects with the next so that even a beginner can move from raw numbers to a public dashboard in a short time.
How Tableau Public Works In One Simple Flow
Below is a clear view of the journey you will follow through this guide.
| Stage | What you do | What you get |
| Data input | Upload Excel, CSV, or Google Sheets | Clean data ready for analysis |
| Visual creation | Drag fields to create charts | Simple charts and graphs |
| Dashboard building | Combine charts into one screen | Interactive Tableau Public dashboards |
| Publishing | Save to the Tableau Public cloud | Public dashboard link |
| Sharing | Share or embed online | Portfolio-ready visualisation |
This flow is what makes Tableau Public easy to learn and easy to apply.
What Makes Tableau Public Useful For Beginners
Tableau Public removes many barriers that new learners face.
- No cost to start because Tableau Public is free
- No coding needed to create charts
- Built-in templates for quick dashboard creation
- Online storage through Tableau Public cloud
- Public sharing through the Tableau Public gallery
This makes it a simple entry point for anyone who wants to learn data visualisation techniques. So when someone asks, “What is Tableau Public used for?”, the answer is simple. It is used for:
- Sharing dashboards publicly
- Building a data portfolio
- Learning visual analytics
- Storytelling with real-world data
Think of it like a digital art gallery. Instead of paintings, you display charts and interactive dashboards. Each dashboard tells a story.
Where People Use Tableau For Public In Real Life
I have seen Tableau for Public used in many simple ways.
- A student shows a project on cricket match data
- A marketing intern builds a dashboard of Instagram engagement
- A job seeker uploads a sales dashboard to show skills
- A freelancer shares client insights publicly
Each use case adds visibility. This is why many data professionals use Public Tableau as a portfolio tool.
A clear roadmap for entering the data analytics field in 2026, covering the skills to learn, tools to master, and practical steps needed to build a strong, job-ready portfolio and career path.
Tableau Public Features That Make It Powerful
Before you install Tableau Public, it helps to know what it offers.
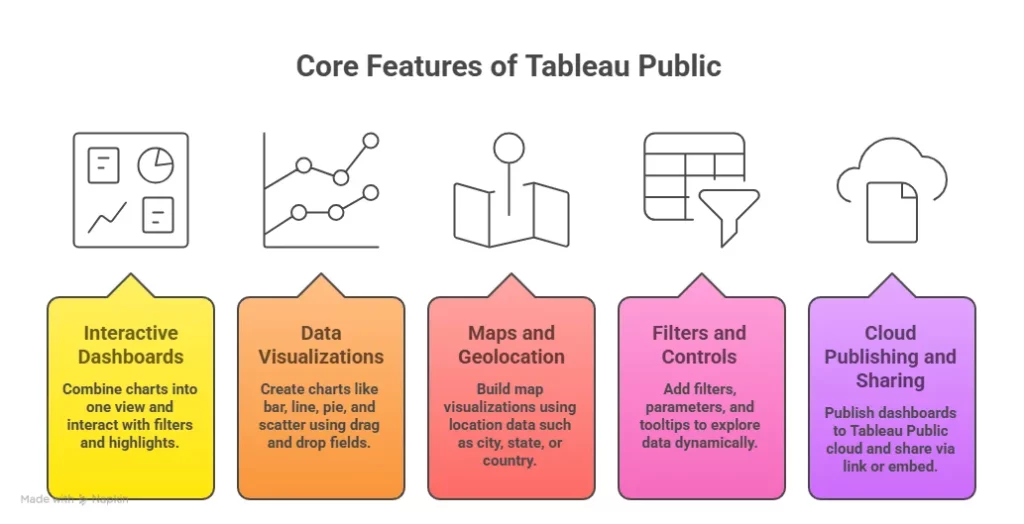
Core Tableau Public features
Tableau Public features focus on visual storytelling and sharing.
- Drag and drop interface
- Ready chart types
- Interactive dashboards
- Map-based visualisations
- Cloud publishing
- Embedding dashboards in websites
These features make Tableau Public visualizations easy, even for beginners.
How Tableau Public Works Behind The Scenes
Before building anything, it helps to understand how Tableau Public data flows. When you create a workbook:
- You load your dataset into the Tableau Public desktop
- You build charts and dashboards
- You save it to the Tableau Public cloud
- It gets published in the Public Tableau gallery
This process makes your visual work easy to share.
Simple example
Imagine you track your daily expenses in Excel. You upload that sheet into the Tableau Public desktop. You build a bar chart of your spending by category. Then you publish it online. Now, anyone can see how you spend money each month. That is how simple it is.
Also Read: See Data Science Careers Set to Dominate the Job Market by 2030
Types Of Tableau Public Dashboards You Can Create
Before learning how to download Tableau Public, it helps to see what you can build.
Common dashboard types
Below are some dashboards created in the Public Tableau gallery.
| Dashboard Type | Example use case |
| Sales dashboard | Monthly revenue trends |
| Marketing dashboard | Campaign performance |
| HR dashboard | Employee attrition |
| Finance dashboard | Expense tracking |
| Sports dashboard | Player statistics |
| Maps dashboard | City-wise performance |
These Tableau Public dashboards are interactive. Users can click filters and explore insights.
Tableau Public Latest Version And Interface Overview
Every year, Tableau releases updates to improve usability. The Tableau Public latest version includes:
- Faster dashboard load time
- Improved map visual options
- Enhanced Tableau Public map features
- Better sharing controls
The interface of the Tableau Online Public desktop is divided into simple sections:
- Data pane
- Worksheet
- Dashboard
- Story tab
Once you sign in using Tableau Public sign-in, your profile is linked to your dashboards.
Also Read: Important Features You Should Know for Tableau with Beginners
Tableau Public vs Tableau Desktop vs Professional
Many beginners get confused between Tableau vs Tableau Public and other versions. Before choosing, it helps to see a simple breakdown.
Key Difference Between Tableau Public And Tableau Desktop
Below is a simplified comparison table.
| Feature | Tableau Public | Tableau Desktop |
| Price | Free | Paid |
| Data privacy | Public only | Private and secure |
| Cloud storage | Yes | Optional |
| File saving | Public cloud | Local and server |
| Data size limit | Limited | Larger datasets |
This table explains the difference between Tableau Desktop and Public clearly.
Tableau Public vs Desktop For Beginners
If you are just starting, the Tableau Public free version is enough. It helps you learn and build projects. If you work with company data, you need Tableau Desktop or Tableau Server.
Also Read: The Ultimate Cheat Sheet On Data Analysis With Tableau
Tableau Public Datasets And Data Sources
Before creating visualisations, you need datasets.
Common Tableau Public datasets used by beginners
- Sales data
- E-commerce data
- Covid data
- Stock market data
- Sports statistics
You can download free datasets from sites like Kaggle. Once downloaded, you can load these into the Tableau Public desktop.
Tableau Public Cloud, Server And Online Access
Once you publish a dashboard, it goes to the Tableau Public cloud. This allows access through Public Tableau online or Tableau Online Public.
How The Tableau Public Server Works
Tableau Public server stores your workbooks online. It lets people view your dashboards without installing any software. You can share your work using a link from Tableau Public com.
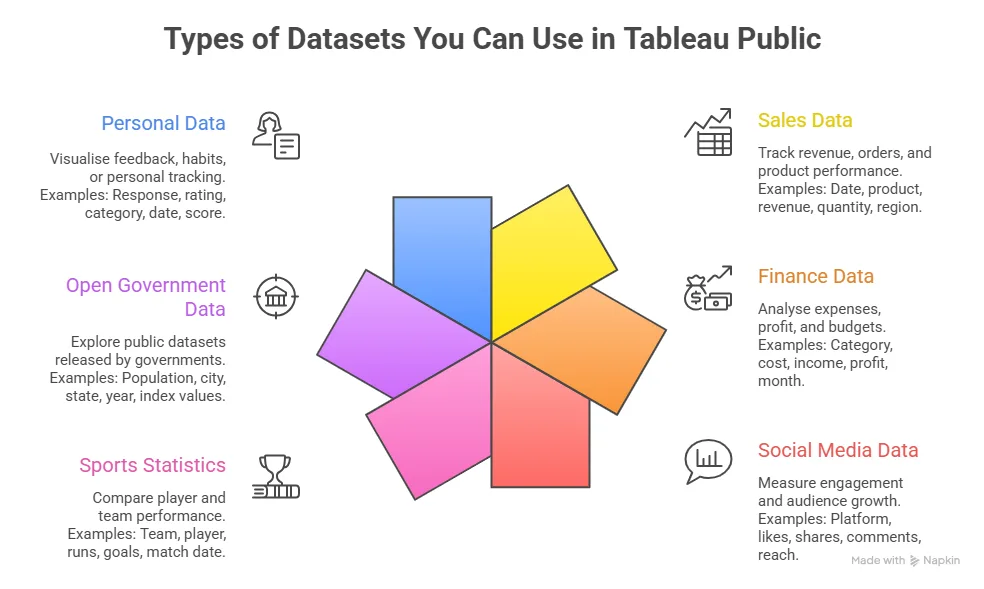
Tableau Public Documentation And Learning Resources
If you want to explore deeper, Tableau Public documentation is a good place. You can learn about:
- Connecting to data
- Creating charts
- Using calculated fields
- Publishing dashboards
Official documentation is available at Tableau Public help.
Why Tableau Public Is Free And What That Means
Many people ask if Tableau Public is free or if there are hidden costs. Tableau Public is free because:
- All data is public
- Dashboards are shared online
- It helps build a data community
This free model helps learners and job seekers.
How To Download Tableau Public Step By Step
Before you begin Tableau certification and creating dashboards, you need to complete the Tableau Public download process on your system. This step is simple and takes only a few minutes.
I always suggest downloading the latest version so you get updated features and better performance.
Steps for Tableau Public free download
Follow these steps carefully for a smooth Tableau Public desktop download:
- Visit the official site at: Tableau Public official download page
- Click on the option for the Tableau Public free download
- Select the correct installer for your system
- Start the Public Tableau com download
- Wait for the file to finish downloading
This process is often referred to as Tableau Desktop Public download or Tableau Desktop Public Edition download.
How To Install Tableau Public On Your System
After completing the Tableau Public download, the next step is Tableau Public installation.
Step-by-step Tableau Public installation
Once you download the installer, follow these steps:
- Open the setup file
- Accept the license agreement
- Choose installation location
- Click install Tableau Public
- Wait for the installation to complete
Once done, the software launches automatically. This process ensures your Tableau Public desktop is ready for use.
Tableau Public sign-up process
When you open the software, you will be prompted to:
- Create a Tableau Public profile
- Enter email and password
- Confirm your account
This step connects your desktop software to the Tableau Public cloud.
Tableau Public login and sign in
Each time you open the software, you use Tableau Public login or Tableau Public sign-in to access your work.
Your Tableau Public profile login lets you:
- Publish dashboards
- Edit visualizations
- Manage your gallery
Your profile is visible on Tableau Public com and acts like an online portfolio.
Did you know?
The installer file is usually less than 500 MB, which means it can be downloaded even on a standard internet connection without issues.
Understanding The Tableau Public Desktop Workspace
Once you sign in, you see the main workspace of the Tableau Public desktop.
Key sections in Tableau Public desktop
Each section helps in building visualisations:
- Data pane
- Worksheet area
- Dashboard canvas
- Story tab
This workspace is designed so beginners can start quickly without technical coding.
Simple example
If you import a CSV file of monthly expenses, the data pane shows columns like rent, groceries, and travel. You can drag these into the worksheet to create charts instantly.
Connecting data sources in Tableau Public
Before building visuals, you need to connect data.
Types of Tableau Public data you can use
You can connect:
- Excel files
- CSV files
- Google sheets
- Text files
These are common Tableau Public datasets used by beginners.
Steps to load data
- Open the Tableau Public desktop
- Click Connect to data
- Select your file
- Load the data into the worksheet
Now your Tableau Public data is ready for analysis.
Also Read: 6 steps to enhance your Tableau dashboard
Creating Your First Chart In Tableau Public
After loading your data, the next step is building a simple chart.
How to create a basic chart
To build your first visual:
- Drag a dimension to rows
- Drag a measure to columns
- Select chart type
- Apply filters
This creates your first Tableau Public visualizations.
Example
If you load sales data:
- Drag the city to the rows
- Drag revenue to columns
- Select bar chart
You will instantly see city wise revenue comparison.
Building dashboards in Tableau Public
After creating charts, you can combine them into dashboards.
Steps to create Tableau Public dashboards
Follow this simple flow:
- Create multiple worksheets
- Open dashboard tab
- Drag worksheets into the dashboard
- Add filters and legends
- Adjust layout
This is how Tableau Public dashboards are created.
Also Read: 5 mistakes to avoid while working with Tableau
How To Save In Tableau Public And Manage Workbooks
Saving work is an important step in the workflow.
How To Save A Workbook In Tableau Public
Follow these steps:
- Click file
- Select save to Tableau Public
- Enter workbook name
- Add description
- Publish
This method is also called how to save to Tableau Public.
How To Save Tableau Public Files Locally
You can also save a local copy of your work.
- Choose save as
- Select a local folder
This ensures you have backup access.
How To Publish A Tableau Dashboard To The Public Gallery
Once your dashboard is ready, you can publish it online.
How To Publish To Tableau Public
Publishing steps are simple:
- click save to Tableau Public
- Enter project name
- confirm publish
Your dashboard is now visible on the Tableau Public gallery.
Public Tableau Gallery Visibility
Your work appears in:
- Public Tableau gallery
- Tableau Public gallery
- Public gallery Tableau
This makes your work discoverable by others.
Things to Keep in Mind Before Using Tableau Public
Every tool has limits. Tableau Public is powerful, yet it is designed for open sharing. This affects how you use it.
Key Limitations of Tableau Public
Before you build serious projects, it helps to know the limits.
| Limitation | What it means in simple words |
| Public data only | Anyone can view your dashboards |
| No private storage | You cannot hide workbooks |
| Limited data size | Large files may slow down |
| No live data refresh | Data needs manual updates |
| No enterprise server control | No role-based access |
These limits exist because the Tableau Public free model focuses on open learning.
Data privacy and safety practices for Tableau Public data
Since Tableau Public data is public, you must take care of what you upload.
Safe data practices
Use these simple rules:
- Remove personal identifiers
- Avoid confidential business data
- Use sample or dummy datasets
- Anonymise sensitive fields
These steps ensure your work stays safe while using Public Tableau online.
A focused look at the types of questions commonly asked in data science interviews, along with the concepts and problem-solving approaches that help you prepare with confidence and present your skills effectively.
How To Organise Your Tableau Public Profile Like A Portfolio
A strong profile increases job visibility.
Structure your Public Tableau profile
Use this structure:
| Section | What to include |
| Featured dashboards | Your best 3 visualisations |
| Industry projects | Finance, marketing, HR |
| Practice dashboards | Learning projects |
| Maps and storytelling | Geo-based dashboards |
| Resume link | Add external portfolio link |
This setup makes your Tableau Public profile login page look professional.
Real-World Use Cases Of Tableau Public In Careers
Tableau Public helps in many roles across industries.
Career use cases
- Data analyst portfolio
- Business analyst reporting
- Marketing campaign dashboards
- Finance trend analysis
- Operations tracking
Freelance use cases
- Show client dashboards
- Create marketing reports
- Share insights with startups
- build portfolio for gigs
This improves trust when clients see real dashboards in the Public Tableau gallery.
An overview of how data science careers are shaping up in India, including common job roles, growth opportunities, and salary trends, along with the skills and tools needed to enter this evolving field.
Advanced Workflow From Data To Dashboard To Publish
A smooth workflow improves efficiency.
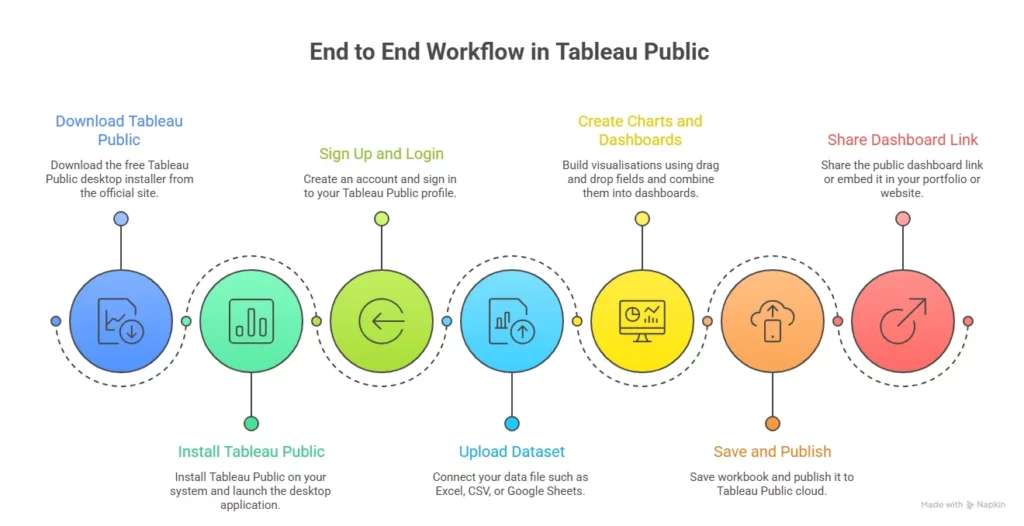
Complete workflow table
| Step | Action |
| 1 | Collect dataset |
| 2 | Clean data using Tableau Prep Public |
| 3 | Load into Tableau Public desktop |
| 4 | Create charts |
| 5 | Build dashboard |
| 6 | Save workbook |
| 7 | Publish to the Tableau Public cloud |
| 8 | Share dashboard link |
This workflow covers how to save a workbook in Tableau Public and publish effectively.
Also Read: A Step-By-Step Guide To Tableau Charts
Why Imarticus Learning stands out for data science and analytics
Learning a tool like Tableau Public is a great start. Turning that skill into a career takes a more structured path. That is where a focused program can make a visible difference. The Data Science and Analytics Program from Imarticus Learning is designed to take you from basic concepts to job-ready skills in a way that feels practical and industry-aligned. It combines tools, projects, career support, and hiring access so your learning leads to real outcomes.
Below are the key strengths of the program based on the official course details.
Key features of the Imarticus Learning Postgraduate Program in Data Science and Analytics
- 100% job assurance with guaranteed interviews: The program offers 10 guaranteed interviews with hiring companies, so learners get real opportunities to enter the data analytics field.
- Strong placement network and hiring partnerships: Imarticus Learning works with more than 2000 hiring partners and has facilitated 15000 plus placements, which gives learners access to a wide hiring ecosystem.
- Hands-on projects and internship exposure: The program includes real-world projects and advanced data science and AI internships so learners can work on practical business problems and build real experience.
- Job-ready portfolio development: Learners build a complete project portfolio with industry-relevant dashboards, analytics models, and data stories to showcase their skills during interviews.
- GenAI-powered learning with future-ready skills: The course includes training in generative AI tools so learners stay aligned with the latest trends in data and analytics.
- Coverage of 35+ industry tools and technologies: The curriculum includes tools like Python, SQL, Tableau, Power BI, and machine learning frameworks to build a complete analytics skill set.
- 360-degree curriculum with a hands-on approach: The learning journey is designed to build job-ready skills even for beginners with no prior programming experience.
- NSDC-certified program recognised across industries: Learners earn an NSDC certification, which adds credibility and recognition when applying for roles in analytics and data science.
These strengths make the program relevant for learners who want to move from basic dashboard creation in Tableau Public to a full career in analytics.
FAQs on Tableau Public
Clear answers to the most frequently asked questions make it easier to move from curiosity to confident use of Tableau Public, whether you are downloading the tool, building dashboards, or sharing your first data project.
What is Tableau Public in the Tableau Tool?
Tableau Public is the free version of the Tableau platform that allows users to create, publish, and share interactive dashboards online. It works as a cloud-based visualisation tool where data is stored publicly, making it ideal for learning and portfolio creation. Many learners at Imarticus Learning use Tableau Public to build their first data projects and showcase their work to recruiters in a visual format.
How do you create a viz in Tableau Public?
To create a visualisation in Tableau Public, you start by loading your dataset into the desktop application, then drag fields into rows and columns to create charts. You can customise colours, add filters, and combine multiple charts into a dashboard. Learners often practice these steps through structured projects at Imarticus Learning, where they build real dashboards step by step.
How can I download Tableau Public?
You can download Tableau Public by visiting the official website, selecting the free download option, and installing the desktop software on your computer. After installation, you create an account and log in to begin building dashboards. Many beginners learn how to complete this process during guided sessions in Imarticus Learning data analytics programs.
Is Tableau Public free?
Tableau Public is free to use for anyone who wants to create and share visual dashboards online. There are no subscription costs, but all dashboards are saved publicly on the platform. This free access makes it popular among students and professionals who learn visual analytics through programs like Imarticus Learning.
Which workbook is used in Tableau Public?
The workbook used in Tableau Public is a packaged workbook file that stores your data, charts, and dashboard layout in a single file format. This file is uploaded to the cloud when you publish your work. Many training programs at Imarticus Learning guide learners on how to structure these workbooks properly for portfolio use.
What is the difference between using Tableau Desktop and Tableau Public?
The main difference between Tableau Desktop and Tableau Public is data privacy and storage. Tableau Desktop allows you to keep data private and connect to secure enterprise systems, while Tableau Public stores dashboards in a public cloud environment. Learners often understand this difference through hands-on projects at Imarticus Learning, where both tools are demonstrated.
What are the benefits of using Tableau Public?
The benefits of Tableau Public include free access to powerful visualisation tools, the ability to publish dashboards online, and the opportunity to build a public portfolio of data projects. It helps beginners gain visibility and develop practical skills. Many aspiring analysts at Imarticus Learning use Tableau Public to present their work during job applications and interviews.
Start Building Your Tableau Public Portfolio Today
By now, you have seen how Tableau Public fits into the full data journey. You start with a simple dataset. You turn it into a chart. You combine charts into dashboards. You publish your work online for anyone to see. Each step builds your skill and your confidence.
What makes Tableau Public special is its openness. It gives you a space where you can learn, test ideas, and show your work to the world. You do not need a big budget or advanced tools to begin. You only need curiosity and a willingness to explore data.
For learners who want to take this further, structured guidance can help build momentum. A focused learning path in data analytics with Imarticus Learning can help you connect tools like Tableau Public with real business problems in a data analytics course offered by Imarticus Learning, industry datasets, and career-ready projects. When practice and direction come together, progress feels smoother.
As you move ahead, keep creating, keep sharing, and keep improving your dashboards. Each visual you build adds one more step to your journey in data analytics.
