


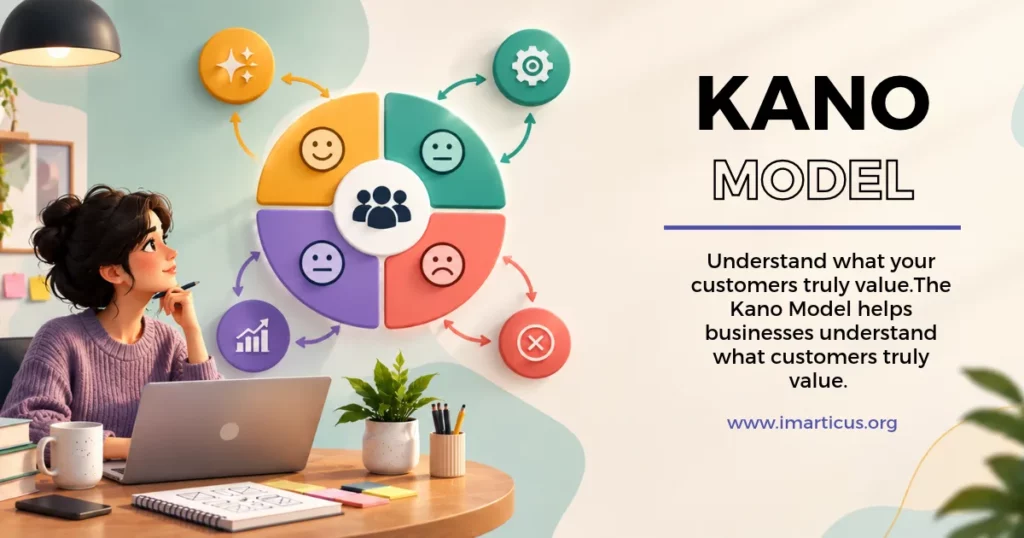
The Kano model is a simple way to work out which features your customers actually care about. A Japanese professor, Noriaki Kano, came up with it in the 1980s, and it sorts every feature into one of five boxes: must-be, one-dimensional, attractive, indifferent and reverse. The basics people take for granted (a secure login, say) are must-be. Features that get more valuable the better they work, like delivery speed, are one-dimensional. Attractive ones are the pleasant surprises nobody asked for. Indifferent features leave people cold, and reverse features irritate part of your audience. You find the right box by asking customers two questions per feature, how they’d feel with it and how they’d feel without it, and checking the answers against a small table. Product managers then use the result to decide what to build first, what to polish and what to quietly drop.
Ask any product manager about their backlog, and you’ll get a sigh. It never gets shorter, and every item on it has somebody fighting for it. The Kano model is the tool I’d hand them first, because it swaps the fighting for a question: how would customers actually feel?
This blog goes through the whole thing at a relaxed pace. We’ll cover what the model means, the five categories, the diagram, how to run the survey, two examples with real numbers and the spots where it falls flat. Nothing here needs a research background. If you’ve got a spreadsheet and a handful of customers you can reach, you’re set.
Want to try it on live products with working PMs giving you feedback? The AI First Product Management Prodegree course covers Kano, ICE, and RICE in its road mapping module, so it’s worth a look once you’re done here.
Don’t Let Our Best Advice Get Buried
Add Imarticus as a Preferred Source — see more of what we publish, every time you search.

Kano Model Quiz: Check If This Framework Fits Your Work
Quick check before we dive in. It’s five questions, takes about two minutes, and tells you whether this model deserves your attention right now or can wait a few months.
Five quick questions, about two minutes. Answer yes or no and see if the Kano model is worth your time right now.
What Is the Kano Model?
Think of the last hotel you stayed in. Nobody walks into a room and thinks, wow, the sheets are clean. But if they’d been grubby, you’d have been at the front desk in five minutes. Now imagine they left a free dessert you never ordered. You’d tell your friends about that one. And the little card about the spa menu on the table? You didn’t even pick it up. Four reactions, four kinds of features. That’s the Kano model in one hotel room.
Kano Model Meaning
So, what is the Kano model in plain terms? It’s a way to sort a product’s features by how much customers care about them, and in what way they care. Some features only cross your mind when they break. Some keep paying off the better they get. A few create real excitement, and plenty do nothing at all. The model gives you a method to tell them apart, and the answer comes from customers, not from the team’s gut feeling.
Kano Model Definition
If you need the textbook version for a report or an exam, here it is. The Kano model is a theory of product development and customer satisfaction that classifies customer preferences into five categories, depending on how a feature’s presence or absence affects satisfaction. The detail worth remembering is the source. The categories come from survey answers, not from the team’s guesses.
Kano Model Full Form
“Kano model full form” is typed into Google a lot, and I get why. Most business models are acronyms (SWOT, RICE, MoSCoW). This one isn’t. Kano is a surname, Professor Noriaki Kano’s, so there’s no full form to find. If some website gives you one, somebody invented it.
Who Created the Kano Model
Professor Kano began working on the idea in the late 1970s and 1980s, and a 1984 paper he wrote with colleagues on attractive quality and must-be quality gave the model its shape. He taught at what is now the Tokyo University of Science.
It started out in quality management, long before anyone talked about product roadmaps. That’s why you still bump into it in Six Sigma courses. Product teams picked it up later, and they’ve kept it ever since.
Key Features of Kano Model
There’s no shortage of prioritisation frameworks. This one earns its place because it asks something the others skip. It doesn’t ask what a feature costs or earns. It asks how people will feel about it, and teams forget to check that more often than they’d admit.
Key Features of Kano Model
The key features of the Kano model, in short:
- The category comes from what customers say, not from internal opinion.
- Satisfaction is treated as a curve, so doubling the effort doesn’t double the happiness.
- Every feature gets a pair of questions, one about having it and one about not having it.
- Each feature ends up in one of five categories, and that makes the decision easy to explain to a manager.
- The same feature can land in a different box for a different group of customers (new users versus old ones, for example).
- Expectations keep creeping up, and the model has that built in.
That last point is the one I’d underline. Most methods give you a score for today. This one warns you that the score will expire.
Objectives of Kano Model Analysis
Teams usually reach for it with a specific problem in mind.
| Goal | What it looks like in practice |
| Set priorities | The list has 40 items and the quarter has room for 10 |
| Protect the basics | Nobody wants to discover a missing must-be after launch |
| Find delighters | You’re looking for small additions people will mention to others |
| Cut waste | Someone suspects half the settings page is never used |
| Explain decisions | A senior person asks why their pet feature was dropped |
Most teams start with the first row and discover the rest along the way.
The 5 Categories of Kano Model
The 5 categories of the Kano model describe five different ways a feature can affect satisfaction. Each one leads to a different decision, which is why it pays to get them straight early. I’ll take them one at a time, then put all five in a single table.
Quality in the Kano Model
These are the things people simply assume. A banking app that logs you in securely is the classic case. Nobody has ever said “I love how safe my login is.” But the day it fails, customers are furious, and plenty of them leave for good.
There’s a ceiling on must-be features, though. Once they work reliably, making them even better buys you very little. I’ve seen teams keep polishing something like this for weeks, and honestly that time was better spent elsewhere.
One-Dimensional Quality in the Kano Model
Here, more is simply better. Faster delivery, longer battery life, lower prices, extra storage. People notice every improvement, and they use these features to compare one product with another. Two phones look the same on the shelf? The one with the better battery wins.
This is where most of the competition happens, and most of the budget goes. So it’s worth checking how much of your own list sits in this category, because it’s the expensive one.
Attractive Quality in the Kano Model
Attractive features are the pleasant surprises. Nobody asked for them and nobody will miss them, but when they show up, people light up. A handwritten thank you note in a delivery box. A free upgrade at check-in. An app that quietly remembers your usual order.
They’re a cheap way to stand out. They won’t rescue a product with broken basics, though. Customers forgive plenty when the essentials work, and almost nothing when they don’t.
Indifferent Quality in the Kano Model
People don’t care about these features either way. A settings page nobody opens, a fourth colour theme, an export option for a file type no one uses. They hang around in products for years because nobody ever checks.
Finding them is one of the best things a Kano survey can do for you. Each one is build time and maintenance you can hand back, and most teams are surprised by how many they turn up.
Reverse Quality in the Kano Model
Reverse features make some people less happy when they’re present. A screen with fifty options might thrill a power user and scare off a beginner. A pop-up begging for a rating after every single action annoys nearly everyone.
They usually start with good intentions. A few customers asked for the option, someone built it, and nobody asked the quiet majority. The survey is how you hear from them.
Kano Model Categories at a Glance
Here’s all five in one table. I keep something like it open whenever I’m going through a backlog.
| Category | If present | If absent | Example |
| Must-be | No real excitement | Strong dissatisfaction | Secure login |
| One-dimensional | Satisfaction rises | Satisfaction drops | Faster delivery |
| Attractive | Strong delight | No complaint | Surprise free gift |
| Indifferent | No change | No change | Rarely used setting |
| Reverse | Satisfaction drops | Satisfaction rises | Cluttered options |
Run down your own list and ask which row each feature lives in. You’ll see pretty quickly where your effort is going.
Also Read: What Is Product Management?
Kano Model Diagram and Graph
Ask people what they remember about this model and most will describe the picture. The Kano model diagram puts all five categories on one chart, and it’s usually the moment the whole thing clicks.
How to Read a Kano Model Diagram
There are two axes. Left to right is how well a feature is delivered, from not at all to completely. Bottom to top is how customers feel, from unhappy to delighted, with a neutral line running across the middle. Each category traces its own path through that space.
To read it, check three things for each path: where it starts, where it ends, and whether it ever climbs above the neutral line. That’s really all there is to it.
Kano Model Graph: The Curves Worth Remembering
The Kano model graph gives you five shapes to know.
| Line | Shape | What it tells you |
| One-dimensional | A straight diagonal, bottom left to top right | More performance always means more satisfaction |
| Must-be | A curve that starts low and flattens out below the middle | Doing it well only gets you back to neutral |
| Attractive | A curve that sits at neutral, then shoots up | Leaving it out costs nothing, adding it makes people happy |
| Indifferent | A flat line across the middle | Nothing changes whether you do it or not |
| Reverse | A line sloping downward | The more you deliver, the less people like it |
Look at the must-be curve again. It never gets above the middle. You can’t impress anyone with a must-be feature, you can only avoid upsetting them, and that’s a useful thing to keep in mind.
Why Kano Model Categories Shift Over Time
This part gets skipped a lot. Categories move. What delights people this year becomes something they expect next year, and by the year after that nobody even thinks about it. Live location sharing in a messaging app was a “wow” feature once. Now people just assume it’s there.
That drift, from attractive to one-dimensional to must-be, is why a Kano model analysis is worth repeating. A feature that earned you praise two years ago might be the bare minimum today, and if you stopped investing because it was a “delighter,” you could be losing ground without noticing.
Did You Know?
The model grew out of a 1984 paper by Kano and his colleagues on attractive and must-be quality. Source
Step by Step Kano Model Analysis
Kano model analysis sounds heavier than it is. You write a short survey, send it out, collect answers and look for patterns. No special software needed. A free form tool and a spreadsheet will do the job, and plenty of teams finish a first round inside a week. Here’s how I’d break it down.
Step 1: Pick the Features for Your Kano Model Analysis
Start with ten to fifteen features. Pull them from places where customers already talk: support tickets, sales calls, interviews, app store reviews and your own backlog. Keep each one specific. “Better search” is vague. “Search that suggests results while you type” is something a person can picture and react to.
Stay under fifteen. Every feature needs two questions, so fifteen features means thirty questions, and people get tired quickly.
Step 2: Write the Functional and Dysfunctional Questions
Every feature gets a pair of questions. The functional one asks how the person would feel if the feature were there. The dysfunctional one asks how they’d feel if it weren’t. Both use the same five answer choices.
- I like it that way
- I expect it to be that way
- I am neutral
- I can live with it that way
- I dislike it that way
Describe each feature in one plain sentence, and try the survey on two or three colleagues first. Small changes in wording can swing the answers a lot, and the dysfunctional question is the one people trip over. Reading it out loud helps. If it sounds odd to you, it’ll confuse respondents too.
Step 3: Match Answers in the Kano Evaluation Table
Each person gives one answer to each question, and that pair points to a single cell in the evaluation table. The letters stand for Must-be (M), One-dimensional (O), Attractive (A), Indifferent (I), Reverse (R) and Questionable (Q).
| Functional answer | Dysfunctional: Like | Expect | Neutral | Live with | Dislike |
| Like | Q | A | A | A | O |
| Expect | R | I | I | I | M |
| Neutral | R | I | I | I | M |
| Live with | R | I | I | I | M |
| Dislike | R | R | R | R | Q |
Read across for the functional answer and down for the dysfunctional one. Someone who likes having a feature and dislikes it being gone lands on O. Someone who expects it and dislikes it being gone lands on M. A Q means the two answers contradict each other (say, “I like it with” and “I like it without”), so you just set that response aside.
Step 4: Read the Better and Worse Scores
Once every response has a letter, count how many of each category each feature got. The biggest group usually wins. Plenty of teams go one step further and work out two scores.
- The Better score is (A + O) divided by (A + O + M + I). It tells you how much satisfaction could rise if you add the feature.
- The Worse score is minus (O + M) divided by (A + O + M + I). It tells you how much unhappiness you’d cause by leaving it out.
A high Better score with a mild Worse score points to a delighter. A strongly negative Worse score points to a must-be. If both numbers are small, you’re probably looking at an indifferent feature.
Step 5: Turn Kano Model Analysis Into Decisions
A result only matters if it changes the plan. Next to each feature, write one word: build, improve, test, delay or drop. Then share the list with your team together with the raw counts, so people can see where each decision came from. That part matters more than you’d expect, because a decision with data behind it rarely turns into an argument.
Tips for a Cleaner Kano Survey
A few habits make the results far more trustworthy.
- Ask current and likely users, not just anyone you can reach.
- Look at each segment separately, since new users and long-time users often disagree.
- Add one open question at the end (“Anything we missed?”), because it often explains the surprises.
- If a result looks strange, call two or three respondents and ask them why.
My own rule of thumb is to not trust a segment with fewer than fifteen to twenty responses. It’s not a hard rule, but below that, one or two odd answers can swing the whole result.
Also Read: What Is a Minimum Viable Product (MVP) in Business?
Kano Model Example With Real Numbers
A method is easier to trust once you’ve watched it work. So here are two cases. The first has actual numbers, so you can see how survey answers turn into decisions. The second is a quick walk through a product you’ve probably used.
Kano Model Example: A Food Delivery App
Say a food delivery team surveys 20 customers about four features. I’ve kept the numbers small so this Kano model example is easy to follow. Each figure shows how many of the 20 people landed in that category.
| Feature | M | O | A | I | Category | Better | Worse |
| Live order tracking | 12 | 5 | 2 | 1 | Must-be | 35% | -85% |
| Loyalty points on every order | 2 | 11 | 4 | 3 | One-dimensional | 75% | -65% |
| Surprise dessert on the fifth order | 0 | 3 | 13 | 4 | Attractive | 80% | -15% |
| Dark mode | 1 | 2 | 3 | 14 | Indifferent | 25% | -15% |
Here’s how I’d read it. Live order tracking is a must-be: 12 of the 20 expect it, and the Worse score of minus 85 percent shows how much it hurts to leave out. The Better score is only 35 percent, so adding it won’t excite anyone. Loyalty points sit in the one-dimensional box. People compare them, so a better offer earns more loyalty.
The dessert is the interesting one. Nobody asked for it, and leaving it out only costs minus 15 percent. But the Better score is 80 percent, which makes it a textbook delighter. Dark mode? Fourteen of the 20 couldn’t care less, so it can wait.
The next steps almost write themselves. Make sure tracking is rock solid. Improve the loyalty scheme. Try the dessert on a small group before rolling it out, and slide dark mode down the list.
Kano Model Example: An Online Learning App
Let’s try a product where the categories are easy to spot. In a learning app, videos that play without stopping are a must-be. Nobody writes a review praising them, but everybody quits when the video keeps buffering. Fast replies to doubts and a bigger bank of mock tests are one-dimensional, since learners notice every improvement and compare apps on exactly these points.
A study plan that rearranges itself after a bad test week could be an attractive feature. Nobody asked for it, but people would remember it. A custom app icon is probably indifferent. And a notification after every lesson with a streak reminder? That’s reverse for a lot of learners, even if a few enjoy it.
Kano Model Example Outside Apps
None of this is limited to software. A restaurant, a gym, a hostel or a smartphone can all be sorted the same way. Clean tables, working Wi-Fi and fresh food will fall into different boxes depending on who you ask, and the survey questions stay identical. That’s one reason the model is still in use after forty years.
Kano Model Prioritisation
Kano model prioritization is what you do with the survey results once you have them. It’s simple enough to explain in a single meeting, which is a big part of why teams stick with it. Below you’ll find the order, how the model compares with other methods and how to put the results on a roadmap.
How Kano Model Prioritisation Works
Most teams end up following something like this.
- Fix the must-be gaps first, because nothing else matters if these fail.
- Put effort into the one-dimensional features customers compare most.
- Add a few attractive ones so the product stands out.
- Skip or delay the indifferent ones, or build them as cheaply as you can.
- Leave out reverse features, unless only the group that wants them gets them.
One caution. Don’t treat this as a strict queue. If a delighter takes an afternoon and a must-be fix takes three months, there’s no rule against shipping the delighter while the big fix is in progress. The order tells you what matters most, not what to start on Monday.
Kano Model vs MoSCoW and RICE
People often ask how the Kano model differs from MoSCoW and RICE. They answer different questions, so they get along fine.
| Framework | Main question | Based on | Best used for |
| Kano model | How will customers feel? | Survey answers | Understanding value |
| MoSCoW | What must ship this time? | Team agreement | Scope for a release |
| RICE | Which gives the most return? | Scored estimates | Ranking by effort and reach |
What I usually do is run the Kano survey first and then use RICE to rank the features inside each Kano category. That way the final order reflects both how customers feel and what it costs to build. MoSCoW can then help trim the list for a particular release.
Placing Kano Model Results on a Product Roadmap
Once the categories are clear, I place them on the roadmap in three layers. Must-be fixes go in early, since they protect what you already have. One-dimensional improvements fill the middle of the plan and take most of the effort. One or two delighters go into each release as a small highlight.
The mix keeps the roadmap balanced. A team that only ships basics looks dull, and a team that only ships surprises looks unreliable. A bit of each gives customers a product that works and now and then makes them smile.
Also Read: A Comprehensive Guide on Product Management Lifecycle
Kano Model in Project Management
This isn’t only an app thing. The Kano model in project management helps teams decide which requirements deserve effort when time and budget are tight. The logic is the same, you just say “requirements” instead of “features,” and “client” instead of “customer.”
Using the Kano Model for Project Scope
Treat each requirement like a feature. Must-be requirements go into scope with no debate, because missing them means the client sees the project as a failure. One-dimensional requirements get budget in proportion to how much they matter. Attractive ones become stretch goals, to be done if there’s time. Indifferent ones are the first to go when a deadline gets close.
It’s especially handy when a client keeps adding requests. Showing them, with survey data, which requests are indifferent is a lot easier than just saying no.
Kano Model in Software Engineering
Software teams use it to sort user stories before a sprint. A story that’s a must-be for most users goes in first, and one that tests as indifferent can wait. It also takes some of the heat out of conversations between engineers and the business side, because when the survey says nobody wants a feature, nobody has to win an argument.
Kano Model in Six Sigma
Since the model began in quality management, it feels at home in Six Sigma work. Quality teams use it to capture the voice of the customer and turn it into requirements. It helps them separate the defects customers will never forgive from the improvements customers won’t even notice.
Did You Know?
A feature can sit in different categories for different customer groups, so always read results by segment. (Source)
Why Learn the Kano Model
You might be thinking there are enough prioritisation methods already, so why add another one. Fair question. I think this one is worth the time, and the reasons are practical. Here’s how it helps day to day, how companies use it and what it does to your decisions.
How the Kano Model Helps You at Work
It gives you a clear answer to a question that never goes away: what should we do first? It also gives you a polite way to say no to a feature, because the answer comes from customers and not from you. And it makes your reasoning visible. When people can see why you chose something, they trust the choice more, even if they don’t fully agree.
How Companies Use the Kano Model
In practice, you’ll see companies use it in three main ways.
- In product planning, to sort feature requests before a quarter begins.
- In quality improvement, to work out which defects and gaps hurt customers most.
- In service design, to plan what an experience must include and where a small surprise would help.
Banks, hotels, hospitals and software companies all use some version of it, mostly because every one of them has a list that’s longer than the budget.
Impact of the Kano Model on Product Decisions
The biggest effect is less waste. Teams that run a Kano survey often drop features customers don’t care about and move that effort into the basics and a few delighters. A year or two on, products feel more balanced and roadmaps are easier to defend. Meetings get shorter too, since most of the arguing happens before the survey, not after it.
Who Can Learn the Kano Model and When
You don’t need a product title to use this. If your job involves deciding what to build, offer or improve, it’ll help. Here’s how it fits different people, and when the right moment is to pick it up.
Kano Model for Students
If you’re studying management, design or engineering, the Kano model is a good first prioritisation tool. You can practise it on a college project with a few classmates as respondents. It’s also easy to explain in an interview, which helps more than you’d think.
Kano Model for Working Professionals
Product managers, business analysts, project managers and marketers can all use it. It helps you argue for the right backlog with evidence, and it works for scope decisions as well as feature ones. If you already talk to customers on calls, you’ve got most of what you need.
Kano Model for People From a Non-Technical Background
No coding involved. A simple form and a spreadsheet are enough, and if you can write clear questions and count answers, you can run a Kano survey. Plenty of people from sales, operations and teaching find it easier than they expected.
Whichever group you’re in, the method stays the same. Only the examples change.
Best Time to Learn the Kano Model
The best time is just before your first serious roadmap discussion, since that’s where it saves the most arguments. Students can pick it up in their final year or right after graduating. Working professionals can learn it the moment a backlog starts feeling out of control, and career switchers can learn it while building a portfolio. Wait until someone asks you to prioritise and you’ll be learning under pressure, which is harder.
What Change the Kano Model Brings
A method earns its place when it changes how you work. Here’s what shifts for a business, an individual and a working professional.
| For | What changes |
| A business | Roadmaps are built on customer answers, so fewer features get built and then ignored. |
| An individual | You can explain every priority with data and spend less time defending your choices. |
| A working professional | Your plans carry more weight in meetings, and stakeholders trust your reasoning more. |
None of this happens overnight. It builds slowly, one survey at a time, and the first one is always the hardest. By the third round most teams find it routine.
Kano Model and AI
AI is changing how product teams collect and read feedback, and the Kano model is part of that story. It doesn’t replace the method. It speeds up the parts around it, and it’s worth knowing where it helps and where it doesn’t.
Using AI Tools for Kano Model Analysis
AI tools can read hundreds of customer comments and group them by theme in a few minutes. That gives you a better starting list of features to test, which is step one of the survey. They can also help you draft the question pairs, tidy the wording and write a short summary of the results for your manager. A job that used to take two days can now take an afternoon.
You still need real customers answering the questions, though. Their answers are the whole point.
Where AI Cannot Replace the Kano Model
An AI tool can guess how customers might feel, but it can’t know. Categories depend on real people in a real market, and they shift over time. Ask a tool to sort your features without a survey and you’ll get a confident answer that may well be wrong. So the sensible use of AI here is to speed up the work around the survey, not to skip it.
The Future of the Kano Model in Product Management
My guess is that teams will run shorter Kano surveys more often, inside their own products, and read results by segment automatically. Some already do. The core idea won’t change, because the question behind it, how will customers feel, isn’t going anywhere. If anything, as products get easier to build, knowing what to leave out will matter more.
Common Kano Model Mistakes to Avoid
The biggest one is asking only the positive question. Without the second question, you can’t tell a must-be from a one-dimensional feature. Other common slips include surveying people who’ll never use the product, treating the first result as final and skipping the segment split. An average can hide the one group that matters most to you.
Benefits of the Kano Model
No method is perfect, and I’d rather you know the weak spots before you lean on this one. Here are the benefits, the limits and the mistakes I see most often.
- It turns a long wish list into ordered work.
- It shows you indifferent features before you spend money on them.
- It points to the delighters that make a product stand out.
- Designers, engineers and business people can all follow the five categories.
Limitations of the Kano Model
- Writing, sending and reading a survey takes time, and some teams don’t have much to spare.
- Badly worded questions give misleading answers.
- Results go stale as expectations rise.
- It tells you nothing about how hard a feature is to build.
That last point catches people out. A feature can be a perfect delighter and still cost six months of engineering. It’s the reason I pair the model with a cost method like RICE.
Also Read: Top 10 Product Management Tools for 2024
Why Choose Imarticus for AI First Product Management
Knowing a method is one thing. Using it in a room full of stakeholders, with a deadline looming, is another. That’s where guided practice helps, and it’s why I’d point a serious learner towards a structured programme.
The AI First Product Management Prodegree course runs for six months on weekends, so you can do it alongside a job. Its road mapping and prioritisation module teaches ICE, RICE and Kano on live product cases, and the programme lists 550+ career transitions into product roles.
Here’s what sets it apart, as listed on the course page.
| What you get | Why it matters |
| Product Studio with teardowns, challenge labs and failure sprints | You solve real product problems instead of only reading theory |
| IBM AI Product Manager Professional Certificate, plus 10 course certificates | Industry recognised proof of AI and product skills |
| 100% live, interactive classes | You can ask questions and get feedback in the moment |
| 15+ AI powered tools, including Mixpanel, Uizard and Notion AI | You learn the tools product teams use every day |
| Mentorship from working product leaders | You get feedback from people doing the job |
| B2C and B2B product portfolio | You build a portfolio that suits consumer and enterprise roles |
| Capstone with Demo Day | You pitch your product to industry mentors |
| Career Launchpad | Resume labs and mock interviews help you get ready for interviews |
It suits early product managers, tech professionals, analysts, project managers, designers and marketers, including people from non-technical backgrounds. You learn the way real product teams work, and by the end you’ve got a portfolio to show hiring managers.
FAQs About Kano Model
These are the frequently asked questions I get asked most about the Kano model, answered the way I’d answer them over a cup of tea.
What is the Kano model used for?
Mostly for deciding which features to build, which to improve and which to skip. It checks how each feature affects customer happiness, so your effort goes where it counts.
What are the 5 requirements of a Kano model?
They’re must-be, one-dimensional, attractive, indifferent and reverse. Each one is just a different way a feature can affect how satisfied customers are.
What are Kano model categories?
The five main ones are must-be, one-dimensional, attractive, indifferent and reverse. Some surveys add a sixth called questionable, which is just a label for answers that contradict each other.
What is Kano analysis and how does it work?
You ask customers two questions about each feature, one about having it and one about not having it. Then you match the pair of answers in an evaluation table, and the table gives you the feature’s category.
What are the four types of customer satisfaction?
Most people mean the four main Kano categories: must-be, one-dimensional, attractive and indifferent. Reverse is the fifth one, for features that make people less happy.
Why is the Kano model important?
It stops you from spending time on features nobody cares about. It also helps you spot the small surprises that make a product feel special, and you get data to back up your decisions.
Run Your First Kano Survey This Week
I opened this blog with a backlog that never gets shorter, so let me close with it too. A long list isn’t proof that a team is doing well. More often it means nobody had a good way to say no, and the Kano model gives you one. You don’t need a big budget or a research team to start.
The whole method fits in four habits. Protect the basics, because customers don’t forgive their absence. Improve the things people use to compare you with others. Add a small surprise now and then. And stop spending time on whatever nobody notices. Each of those starts with asking customers two simple questions and then listening to them more than to the loudest voice in the meeting.
So pick a small set of features this week, write the question pairs and ask ten people. See what the evaluation table says and share it with your team. If you’d like to build this habit properly, the AI First Product Management Prodegree course gives you the mentors, live projects and certification to do it at work.
Liked This? Follow Us Where You Already Search.
Preferred Sources is Google’s built-in follow button — no app, no login, just more Imarticus in your results.