If the CMA exam were a cross-country race, your study materials are your shoes. Pick the wrong pair, and even the best runner stumbles.
Every CMA aspirant starts with the same ambition: to earn that coveted Certified Management Accountant badge. But what truly separates successful candidates isn’t intelligence. It’s strategy. And that strategy begins with choosing the right CMA study materials.
The right CMA study materials can turn 400 hours of random studying into 250 hours of focused mastery. And with 2025 seeing new IMA content updates around analytics and technology, choosing current resources has never been more critical.
Gone are the days of bulky textbooks and endless notes. Today, you have AI-powered dashboards, adaptive quizzes, bite-sized video micro-lessons, and real-time mentorship; all designed to help you pass smarter, not harder.
But the real question is: Which ones actually work?
This guide breaks down the best CMA study materials for 2025, across books, guides, PDFs, and online resources.
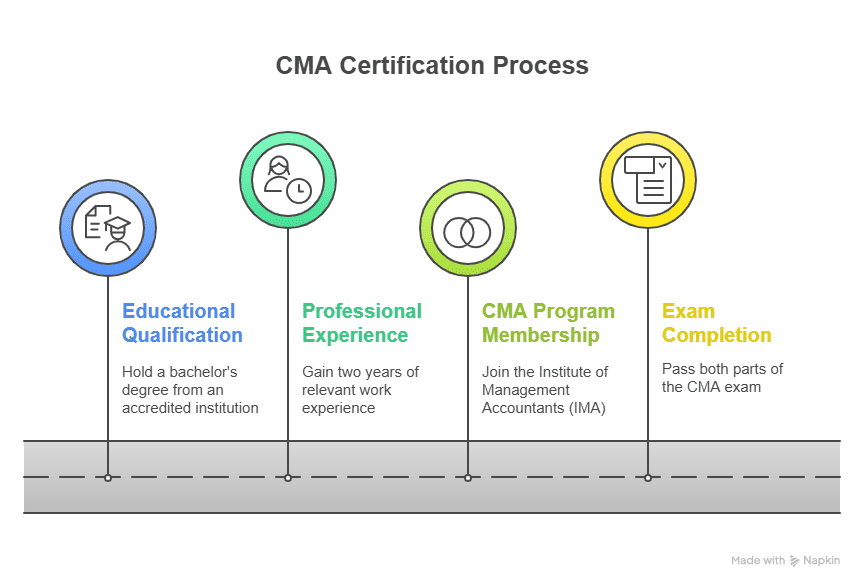
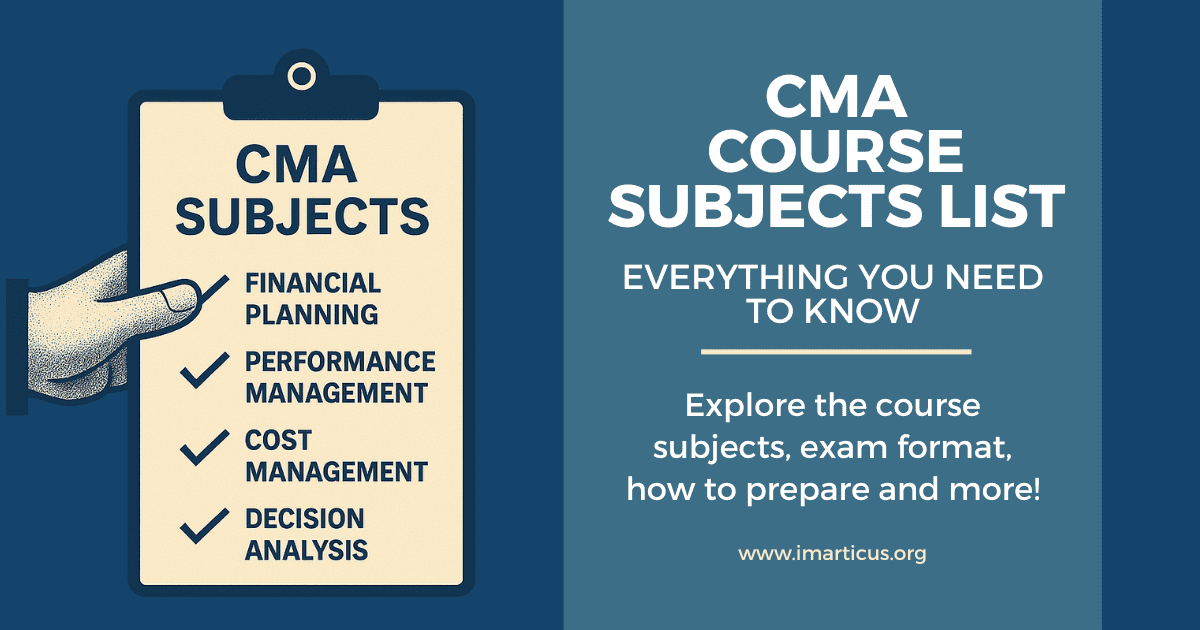
What Is the CMA Certification?
If you’ve ever wondered why some finance professionals seem to “just get it”, the ones who can look at a balance sheet and instantly tell whether a business is healthy or heading for trouble, chances are, they think like a Certified Management Accountant (CMA). Now, let’s understand what is CMA.
Offered by the Institute of Management Accountants (IMA, USA) – a 100-year-old global body with members across 150+ countries – the CMA certification has quietly become the benchmark for management accounting excellence. Over 100,000 professionals worldwide have earned it, and many hold leadership roles in leading multinational firms like Amazon, Deloitte, PwC, and Johnson & Johnson.
What sets CMA apart is its focus on the why behind the numbers. You won’t just learn to report profits, you’ll learn to question them.
- Why did costs rise despite steady revenue?
- How do strategic investments translate to long-term value?
- Are today’s profits hiding problems that could hurt tomorrow’s results?
These are the kinds of questions CMAs are trained to answer, and that mindset is what CEOs and CFOs value most.
Why Choosing the Right CMA Study Materials Is a Game-Changer
Before we dive into the list, let’s be honest, CMA preparation isn’t just about what you study, but how you study it. You could spend hours going through random notes and YouTube videos, but if your materials aren’t aligned with the exam’s structure and mindset, you’ll just end up working harder, not smarter.
The right CMA study materials don’t just explain theories; they train you to think like a management accountant. They help you see beyond definitions and formulas to understand how each topic connects to real business decisions.
Good CMA materials do more than explain concepts; they train your brain to think like a management accountant. The right resources will:
- Cover the full CMA syllabus with updated IMA guidelines.
- Simplify complex topics like cost management and decision analysis.
- Provide realistic practice tests mirroring the exam interface.
- Teach time management – arguably the toughest skill for CMA aspirants.
- Offer flexibility – because many CMA students juggle work, family, and study.
💡 Did you know? The global pass rate for each part of the CMA exam sits around 45-50%, underscoring the need for quality preparation. (Source)
Best CMA Preparation Books for 2025
If you’ve ever tried preparing for the CMA exam, you know it’s not about stuffing your brain with formulas but about training it to think in systems. And that’s where good books quietly outperform.
Books like Wiley CMAexcel and Gleim CMA Review have survived for decades for a reason. They’re built around the psychology of how candidates learn. The explanations aren’t fancy; they’re deliberate. Every paragraph builds on the last, and every chapter teaches you to think a little more like management, less “what happened?” and more “what does this mean for the business?”
So, if you’re starting your CMA syllabus, think of these books as your base layer, the part of your prep that ensures every formula, framework, and principle fits together logically before you move to advanced testing.
1. Wiley CMA Review 2025
Why it stands out:
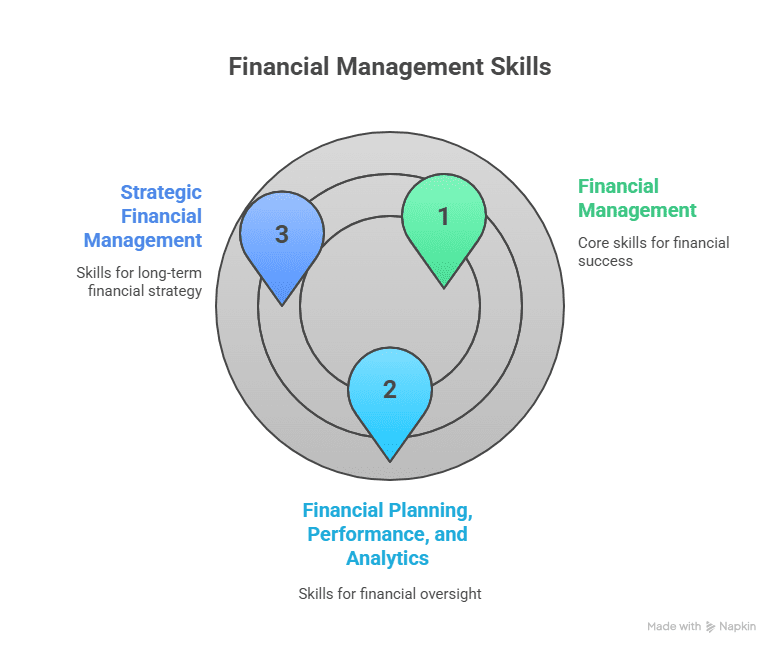
- Comprehensive coverage for Part 1 (Financial Planning) and Part 2 (Strategic Financial Management)
- 4,000+ practice questions with detailed solutions
- SmartStudy™ planner for daily goals
📘 Ideal for: Students who prefer in-depth reading combined with digital access to test banks.
Download trial chapters from the official Wiley CMA site.
2. Becker CMA Exam Prep Books
Why it stands out:
- AI-based adaptive learning
- Crisp, modular layout with exam-style practice questions
- Paired with Becker’s online platform for videos and simulations
3. Gleim CMA Review 2025
Why it stands out:
- Legendary for detail and exam-style rigour
- Includes a diagnostic quiz after every topic
- Excellent for those who want zero conceptual blind spots
🧾 Best for: Candidates retaking the exam or those with an accounting background.
4. Hock International CMA Books
Why it stands out:
- Extremely beginner-friendly
- Focuses on simplifying jargon-heavy finance concepts
- Comes with step-by-step problem walkthroughs
🔍 Pro tip: Hock’s “Smart Notes” PDF is a lifesaver for last-minute revisions.
5. ICMAI Official CMA Study Material
Why it stands out:
- Directly aligned with IMA’s learning outcome statements
- Great for syllabus integrity
- Free PDFs available from the ICMAI official site
Quick Comparison Table: Best CMA Books 2025
This quick comparison table helps you cut through the clutter. It lines up the most trusted CMA review courses, highlighting what each does best, from question depth to digital integration, so you can pick the one that fits your learning style instead of second-guessing your choice.
| Book Name | Format | Ideal For | Key Features |
| Wiley CMA Review | Book + Online | All-rounders | 4,000+ Qs, Smart Planner |
| Becker CMA Review | Book + AI Portal | Tech-savvy learners | Adaptive learning |
| Gleim CMA Review | Book + Mock Tests | Experienced students | Rigid exam focus |
| Hock CMA Review | Book + Notes | Beginners | Concept clarity |
| ICMAI Material | Free PDF | Budget learners | Official syllabus |
Best CMA Online Study Resources for 2025
Online study resources have become the go-to choice for candidates who want structure without being tied to a classroom. Think of them as your on-demand mentors: available anytime, anywhere, guiding you through complex topics with interactive videos, adaptive quizzes, and real-time progress tracking. Whether you’re revising on your commute or brushing up on concepts before bed, these digital platforms make preparation fit your schedule, not the other way around.
The CMA Program collaboration with KPMG in India offered by Imarticus Learning, is designed to give learners practical exposure alongside exam-focused preparation. The curriculum blends global CMA content with real-world case studies, analytics tools, and scenario-based learning.
You get:
- Live classes with IMA-recognised mentors
- Real-world case studies aligned to the US CMA exam
- Exclusive access to industry projects simulating managerial accounting decisions
- Career mentorship and placement support
- Wiley CMA Online
- AI-driven question analytics
- Flashcards and bite-sized lessons
- Mobile app for on-the-go learning
- Becker CMA Online
- Interactive dashboard
- “Exam Day Ready” mocks
- Personalised performance tracking
- Gleim CMA Study Planner
- Adaptive question sets
- Study planner synced with your calendar
- Hock CMA Online Resources
- 80+ hours of video lectures
- Downloadable workbooks
- Community support groups
CMA Coaching Materials for 2025
If you’re the kind who needs structured schedules and feedback loops, coaching-based CMA materials can make a world of difference.
| Provider | Unique Offering | Best For |
| Imarticus Learning | Live expert sessions, 1:1 mentorship, integrated projects | Working professionals |
| Wiley CMA Coaching | Test banks + faculty webinars | Self-paced learners |
| Becker CMA Coaching | Smart tracking dashboard | Analytical thinkers |
| Gleim CMA Coaching | AI-personalised mentoring | High performers |
| Hock International | Real-time concept feedback | Beginners |
CMA Study Guide PDFs – Free & Paid
CMA study guide PDFs are the go-to resource for candidates who like to revise on the move or keep all their key notes in one place. These digital companions summarise vast topics into concise, exam-ready insights — ideal for last-minute brush-ups or structured weekly revisions. Whether you prefer official IMA handbooks or publisher-specific summaries, having the right PDF library means you can review formulas, standards, and key concepts anytime.
Imarticus CMA Study Resources: This guide is designed to help you align your prep with the latest CMA exam structure. It includes a section-wise syllabus breakdown, formula sheets, and study hacks based on real student feedback. What sets it apart is its integration of conceptual clarity with real-world finance examples, making it easier to remember and apply concepts.
- Wiley CMA PDF: The Wiley CMA PDF series remains one of the most trusted names among aspirants for a reason. It’s structured, clear, and updated to match every change in the exam pattern. The PDFs feature topic-wise summaries, practice questions, and progress checklists to help you track what’s done and what’s pending.
- Becker CMA Notes: The Becker CMA PDF material simplifies complex theories into short, visual summaries. Each section begins with key formulas and ends with a quick revision checklist, helping you reinforce core concepts efficiently. The layout is learner-friendly and perfectly suited for end-of-week reviews before mock tests.
- Gleim Exam Prep Guide: The Gleim CMA PDF isn’t just a study guide; it’s a digital flashcard deck for the entire syllabus. You get capsule summaries of tricky topics like variance analysis, cost behaviour, and internal controls. These micro-learning tools are perfect for 15-minute study breaks when you want to revise without reopening full-length books.
- ICMAI Study Materials: For candidates following the Indian ICMAI CMA syllabus, the ICMAI study material PDFs are freely available and officially recognised. These modules cover each subject in depth, from Financial Reporting to Strategic Management, and are a great starting point for foundational learning before diving into international CMA content.
- CMA Candidate Resource Centre by IMA: The IMA’s CMA Candidate Resource Centre is the official source for everything CMA-related, from learning outcome statements to sample exam questions and performance standards. It’s a must-visit for anyone serious about aligning their prep with global CMA study materials and standards set by the IMA.
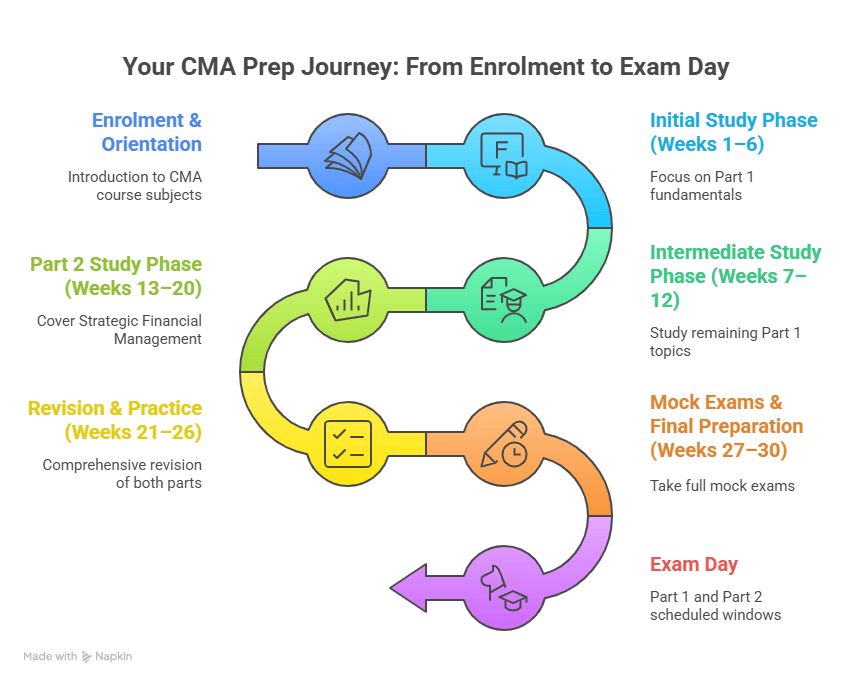
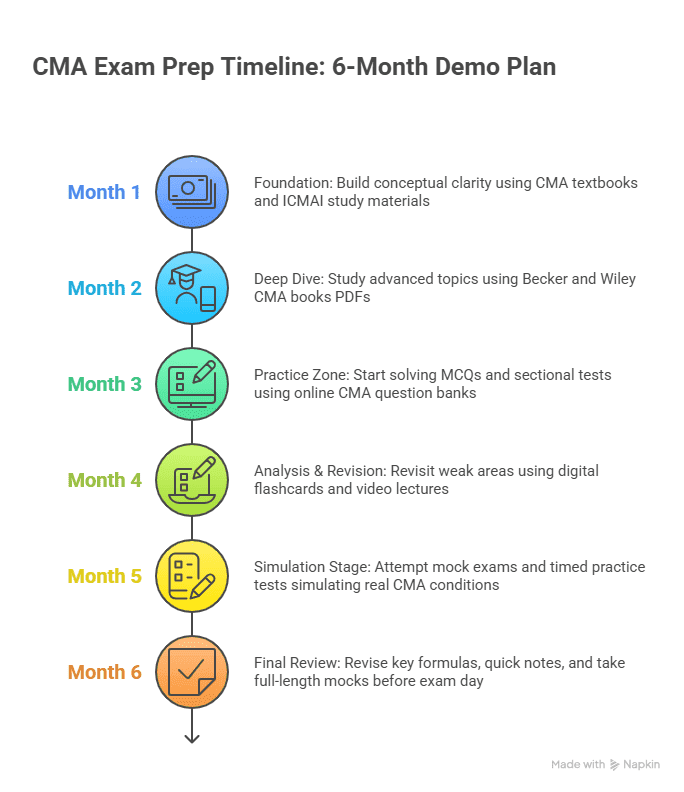
This demo CMA exam prep plan visualises how top candidates pace their preparation, balancing theory, practice tests, and revision cycles week by week. It’s not a one-size-fits-all template, but a smart starting point to help you align your own CMA study materials and time effectively.
Study Efficiency by Resource Type (2024 Candidate Survey)
How you study is just as important as what you study. According to a recent candidate survey, the material type makes a measurable difference in how quickly and effectively you learn for the CMA exam. Learners who combined multiple material types, for example, a book for depth, a question bank for practice, and a digital tool for revision, reported higher retention, faster progress, and better readiness than those who relied on a single mode.
| Study Material Type | Avg. Weekly Hours | Avg. Exam Score | Pass Rate |
| Books Only | 10 hrs | 65% | 39% |
| Online + Books | 14 hrs | 75% | 56% |
| Coaching + Books | 16 hrs | 81% | 67% |
| Online + Coaching + Books | 18 hrs | 88% | 79% |
(Source: IMA Global Exam Insights 2024)
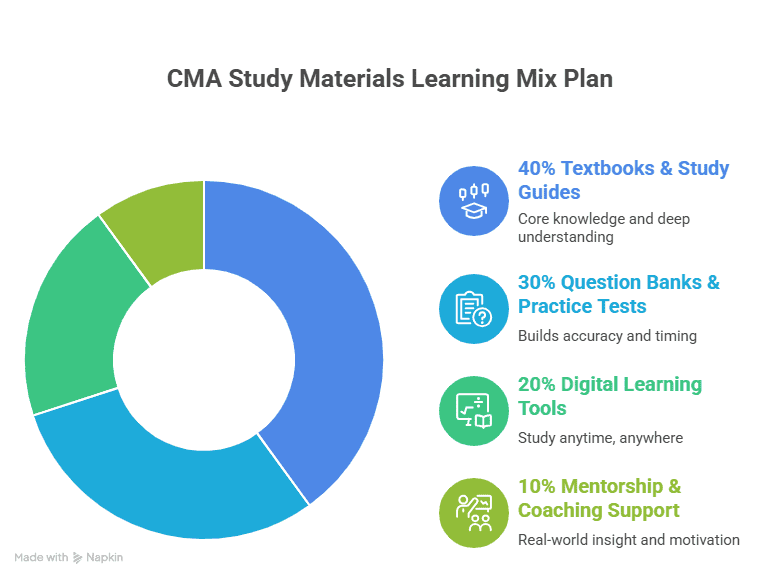
This CMA study materials learning mix plan shows the optimal balance between textbooks, practice questions, digital tools, and mentorship based on how real candidates succeed. It helps you visualise where to invest your time for maximum retention and confidence, whether you’re revising formulas, solving case studies, or taking mock exams.
How to Choose the Right CMA Study Material for You
Before you invest in any resource, step back and look at what kind of learner you are and what the CMA exam really demands. This isn’t an exam you can crack by memorising; it tests how you connect strategy, finance, and decision-making in real-world contexts. So, your study materials need to do more than explain concepts; they should train you to think like a management accountant.
Before you buy anything, ask yourself these:
- What’s my learning style?
If you love visuals → choose Becker or Wiley.
If you prefer structured text → go for Gleim or Hock. - How much time do I have weekly?
Less than 10 hours? Go hybrid with adaptive apps. - Do I need motivation?
Then coaching (like Imarticus) is worth every rupee. - Is my goal just to pass or to master?
Passing is short-term. Mastery builds your finance career.
Here’s a video on preparing for your CMA with a mock interview-
Why Choose Imarticus Learning for CMA Prep
Imarticus Learning’s CMA program goes beyond typical coaching. It’s designed by mentors who’ve been there, done that.
Here’s why Imarticus stands out:
✅ Live Mentor-Led Classes: Not pre-recorded monotony. Every class is interactive and application-focused.
✅ Case-Based Learning: You’ll solve finance scenarios similar to what CMAs actually face in corporates.
✅ Career Support: Placement prep, resume workshops, and mock interviews included.
✅ Hybrid Flexibility: Attend live, or learn at your pace via recorded sessions.
✅ Global CMA Alignment: 100% mapped to the latest IMA curriculum.
✅ Community Access: Join a peer network of finance aspirants and mentors across industries.
Bridge the gap between theory and practice with expert-led guidance. Explore the CMA Program in collaboration with KPMG in India offered by Imarticus Learning
FAQs on CMA Study Materials
Still have questions about where to begin or what to use? You’re not alone. These frequently asked questions break down everything you need to know about the best CMA study materials, from how to choose between books and online courses to whether free PDFs and mock tests are enough to pass.
Which study material is best for CMA?
The best CMA study materials are the ones that balance concept clarity, practice, and exam relevance. For 2025, most CMA mentors recommend a mix of Wiley CMA books, Becker CMA Review, and the official IMA learning resources.
If you prefer self-study, start with the US CMA study material for conceptual grounding; it’s the official reference, after all, and then move to Wiley or Gleim for deeper question banks and mock exams.
Can I do CMA by self-study?
Absolutely! Many candidates clear the CMA with self-study, provided they choose updated CMA study materials 2025 and follow a disciplined study plan.
The trick is to follow the syllabus systematically:
- Start with foundational concepts using the CMA study materials PDF available from trusted sources.
- Use video lectures from Wiley or Becker to clarify tough topics.
- Join study forums or Telegram groups where CMA aspirants discuss tricky problems.
If you’re a working professional, however, blending self-study with expert-guided sessions from Imarticus Learning can be a game-changer. Mentors break complex topics into relatable, industry-based examples.
Can CMA earn 1 crore?
Yes, but context matters. A CMA with 7–10 years of experience, working in global finance, FP&A, or strategic management roles, can absolutely reach that milestone.
According to IMA’s Global Salary Survey, CMAs earn 58% higher median total compensation than non-certified peers globally.
In India, mid-senior CMAs in MNCs or Big 4 firms earn ₹25–₹40 LPA, and senior finance leaders easily cross the ₹1 crore mark with bonuses and stock options.
How to study CMA at home?
Studying CMA at home requires the right resources, a realistic plan, and consistent practice.
Here’s a step-by-step structure:
- Plan your study hours – Aim for 15–20 hours weekly.
- Use structured materials – Start with US CMA resources, then supplement with CMA material PDFs from Wiley or Becker.
- Simulate exam conditions – Attempt one mock every 10 days.
- Track progress – Use online dashboards (like Gleim’s or Imarticus’ learning portal) to track weak topics.
If you get stuck, consider enrolling in a hybrid learning model, like the one at Imarticus, where you can balance flexibility with mentor-led sessions.
Is CMA very difficult?
Not really. CMA is challenging, not impossible. It’s designed to test the application of knowledge, not rote memorisation. The difficulty often depends on your background and study discipline. With updated CMA study materials, structured guidance, and mock practice, most candidates pass each part in 4–6 months.
Imarticus mentors often compare it to training for a marathon: once you understand the pace, it’s about consistency, not intensity.
How many hours to pass CMA?
Most successful candidates dedicate around 300–400 study hours for both parts combined.
Here’s a rough breakdown:
- Part 1 (Financial Planning & Analytics): 180–200 hours
- Part 2 (Strategic Financial Management): 150–200 hours
If you’re using premium CMA study materials (like Wiley or Becker), the adaptive study tools help optimise your time by focusing on weaker sections.
💡 Time management tip: 2 hours daily for 6 months is usually enough if you stay consistent.
How many attempts are in CMA?
You can take the CMA exam as many times as needed, but the exam window system means you’ll have to plan ahead.
There are three testing windows each year:
- January–February
- May–June
- September–October
So, if you don’t pass on one attempt, you can reattempt in the next window without waiting long.
How to pass CMA on the first attempt?
To pass CMA on your first try, you need a strategy, not just study hours.
Here’s a proven formula:
- Use updated CMA study material to stay aligned with syllabus changes.
- Practice at least 2,000 MCQs before the exam.
- Focus 70% of your time on concepts, 30% on practice tests.
- Review tricky topics through video lectures and flashcards from Becker or Wiley.
Which CMA part is easier?
Most students find Part 2 (Strategic Financial Management) slightly easier because it’s more conceptual and less calculation-heavy.
Part 1 (Financial Planning & Analytics) requires strong numerical ability and covers cost management, budgeting, and internal controls.
However, difficulty is subjective. With strong CMA study materials, particularly adaptive ones like Gleim or Wiley, both parts become manageable with practice.
Is CMA full of maths?
Not at all. CMA isn’t about advanced mathematics; it’s about analytical thinking and logical problem-solving.
You’ll need comfort with numbers, yes, but most calculations are based on formulas and financial reasoning rather than complex algebra or calculus.
Final Thoughts
At some point in your CMA prep, you’ll realise, it’s not the syllabus that’s hard, it’s staying curious long enough to connect the dots. The formulas, the costing models, the variance analyses — they start making sense only when you stop chasing answers and start asking why. That’s the real turning point.
Good CMA study materials don’t just prepare you for an exam; they help you build the kind of clarity that CFOs rely on in boardrooms. It’s not about cramming Becker chapters or flipping through Wiley flashcards; it’s about developing the instinct to look at a balance sheet and see a business story.
If there’s one thing this journey teaches you, it’s discipline dressed as curiosity. Every solved mock, every revised PDF, every late-night session is shaping how you think. And once you’ve built that mental muscle, you’ll never look at numbers the same way again.
👉 And if you’re ready to turn that understanding into impact, start your CMA prep with Imarticus Learning’s offering CMA Program in Collaboration with KPMG in India.