FRM Course: Empowering Finance Minds to Lead

Tired of just running reports? Ready to be the one guiding decisions when markets shift and uncertainty hits? That’s exactly where the Financial Risk Manager (FRM) course steps in. 

Offered by the GARP and recognised worldwide, the FRM program equips you to analyse, manage, and mitigate complex financial risks. Its curriculum spans quantitative methods, market and credit risk, liquidity and operational challenges, and emerging industry practices – preparing you to build risk frameworks that support real business strategy.

For professionals aiming to move beyond routine finance tasks and step into impactful, leadership-oriented roles in banks, consulting firms, and multinational organisations, FRM acts as a true career accelerator.

In this guide, we’ll break down everything you need to know about the FRM course – from eligibility and fees to career benefits and job opportunities – so you can decide if it’s the right next step for your finance career.


What is the FRM Course?

The FRM course is offered by the Global Association of Risk Professionals (GARP). It’s globally recognised. That means whether you’re in Mumbai, New York, or Singapore, your credential signals expertise in financial risk management – a language that every top-tier firm understands.

In today’s unpredictable financial landscape, FRM gives you the expertise to make smarter, more confident decisions, the kind that help organisations stay steady even when markets get volatile.

If you might be wondering what is FRM, think of the FRM Course as your toolkit for risk leadership. While traditional finance roles focus on reporting or compliance, FRM trains you to identify, assess, and mitigate risks before they turn into problems.


🎥 Before we dive in, here’s a video that breaks down everything you need to know about the FRM course – from fees and eligibility to duration and career scope. 


The FRM Course Structure

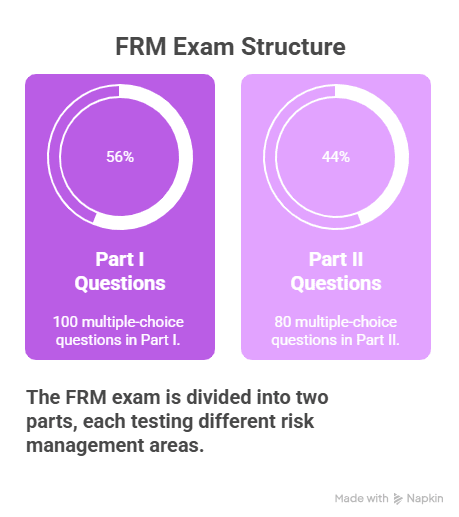
The FRM isn’t just a credential; it’s a signal to employers that you’re prepared for strategic leadership. The FRM program is broken down into two parts, designed to build your knowledge from the ground up.

Part I builds foundations in quantitative methods and financial market instruments, while Part II delves into market, credit, operational and liquidity risks, as well as contemporary risk management challenges. 

Part I: The Core Foundations

This is where you lay the groundwork. Imagine trying to explore a new city without a map – you’d get lost. Part I gives you the map. It focuses on quantitative methods, financial instruments, and the core concepts of risk.

TopicFocus
FoundationsEthics, Corporate Governance, and Core Risk Concepts
Quantitative AnalysisStatistical methods and modelling for risk
Financial Markets & ProductsUnderstanding Derivatives, Fixed Income, and more
Valuation & Risk ModelsMeasuring risk with tools like VaR and stress testing

If you were equipped with Part I knowledge back during the 2008 financial crisis, you could have quantified subprime mortgage risk, understood derivatives exposure, and anticipated the ripple effects across global banks. That’s the kind of foresight FRM equips you with.

Part II: Strategic Application

Part II is where you move from theory to strategy. It’s like being fresh out of an architecture degree; the first project hits hard. It isn’t just designing – suddenly, you are juggling market swings, credit, operations, cash flow, and new challenges like ESG and cyber risks. Real-world projects are way more complex than any classroom could prepare you for.

TopicFocus
Market RiskManaging fluctuations in market prices
Credit RiskDealing with potential borrower defaults
Operational RiskMitigating losses from internal failures (people, processes, systems)
Liquidity & Investment RiskManaging cash flow and investment portfolio risks
Current Industry IssuesEmerging topics like ESG, climate risk, and cyber risk

Passing the exams and documenting two years of relevant professional experience signals your readiness to lead risk initiatives rather than simply react to them. To understand how the FRM program builds your knowledge step-by-step, explore our detailed FRM Course Structure section.

Pro Tip: Specialising in emerging areas like ESG risk, climate modelling, regulatory technology, and sustainable finance further enhances your market edge. As firms prioritise these domains, FRM holders find themselves at the forefront of transformational finance roles.

Important Note: To officially get your FRM Charter, you must document two years of relevant work experience after passing both exams and within a 10-year window.


FRM Exam Details & Preparation 

You can’t ace this by just skimming. The FRM exams are rigorous, but the structure is straightforward. With disciplined preparation, you can confidently clear them.

AspectPart IPart II
Format100 multiple-choice questions80 multiple-choice questions
Duration4 hours4 hours
Study Time275-300 hours recommended275-300 hours recommended

Smart Tip: If you schedule 2 hours daily for quantitative practice and another hour for reading GARP core texts. By four months, complex probability models that initially seemed daunting become intuitive.

FRM Course Cost Breakdown 

Here’s a quick overview of the FRM course fees to help you understand how the total cost is distributed across different components.

ComponentCost (USD)Notes
Enrolment Fee$400One-time fee
Part I Exam Fee$600-$800Based on early vs. standard registration
Part II Exam Fee$600-$800Based on early vs. standard registration
Estimated Total$1,600-$2,000A small investment for a big return!

Think about it – spending $2,000 to unlock global career opportunities and leadership roles is a small price for financial freedom and professional growth.

FRM Exam Structure

FRM Course Pass Rates

The FRM Certification remains one of the most demanding credentials in financial risk management – official data from GARP shows that exam pass rates for Part I typically range between 40% and 50%, while for Part II they trend higher, at about 50% to 60%. 

These moderate pass rates reflect the rigorous nature of the exams and why holding the FRM credential is viewed as a mark of serious competence in risk management skills.


How to Prepare for the FRM Course?

Using the right techniques can make a huge difference when it comes to acing your exams. Here are a few practical tips to help you prepare effectively for the FRM exams:

  • Structured Study Plan: Break the syllabus into weekly milestones with a reputable provider. Consistency beats cramming.
  • Mock Exams: Build stamina and timing. FRM isn’t just about knowledge – it’s about applying it under pressure.
  • GARP Core Readings: Don’t skip them. They’re the backbone of exam success. Supplement with trusted third-party question banks.
  • Real-World Application: Whenever possible, link theory to your current work. For example, use Part II frameworks to evaluate your company’s operational risks.

Why is the FRM a game-changer? 

Let’s be real – the FRM isn’t just another finance certification you add to your résumé. It’s a powerful launchpad that can completely change the direction of your career.  Let’s break it down:

  • Massive Paycheck: According to the U.S. Bureau of Labour Statistics, risk management roles and FRM holders enjoy median salaries soaring around USD 156,100 globally. For Indian finance professionals, this translates to career paths that not only elevate your earning potential but position you as a coveted expert in a field that’s gaining unprecedented strategic importance.
  • Job Security & Growth: Roles in financial management are expected to grow by a strong 16% through 2032. Plus, 40% of risk-management jobs require or prefer the FRM credential.
  • Global Elite: Join a network of 90,000+ FRM professionals operating in over 190 countries. Talk about a serious networking edge!
  • In-Depth Expertise: You won’t just learn buzzwords. You’ll master cutting-edge quantitative models, stress testing, and frameworks for complex risks like climate and cybersecurity.
  • Future is Bright: A staggering 73% of professionals expect risk management roles to increase over the next 18 months, and 85% would recommend a risk career to a peer. Optimism is high. And you need to be ready to step up!

Why Choose the FRM Course?

Let me be honest: the FRM is not for everyone. This certification is purpose-built for finance professionals who are ready to seize the leadership seat. If you’re in a finance role and feel limited by repetitive tasks, FRM can change your trajectory.

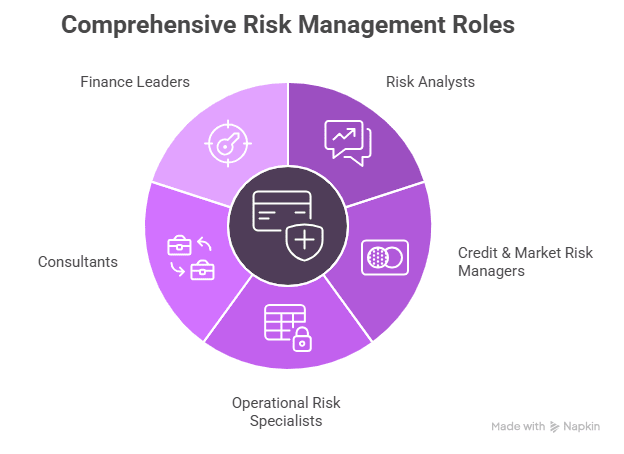
You should pursue the FRM if you are a:

  • Risk Analyst ready to lead projects and transition into management.
  • Credit & Market Risk Manager seeking the deepest, most authoritative insights.
  • Operational Risk Specialist looking to streamline firm-wide processes and influence enterprise strategy.
  • Consultant advising clients on macro-level risk and corporate resilience.
  • Finance Leader committed to steering a firm through market volatility and regulatory change.

Stop settling for a career of calculations. The FRM course is the definitive step to becoming an indispensable, high-earning financial strategist.


💡 Did You Know? 

According to the 2025 FRM Global Practice Analysis Report,
40% of financial risk managers have responsibilities related to climate risk.
42% of financial risk managers view AI/machine learning as a key area for continuing education.
55% of financial risk managers spend at least half of their time performing risk management tasks.


Insights from the 2024 GARP Risk Careers Survey 

  • GARP‑certified professionals are in high demand. More than 40% of survey respondents said the FRM Certification is listed as preferred or required in job postings.
  • Nearly 79% of survey respondents globally reported a high degree of satisfaction in their work. 73% anticipate opportunities in risk management will increase slightly or significantly over the next 18 months. 54% plan to hire more risk professionals, and 85% would recommend a risk management career to peers.

This underscores why FRM holders are in demand worldwide.


FRM Course Benefits

Imagine being the person in the room who can spot a financial storm before it hits – a professional everyone turns to for guidance when markets shift unexpectedly. That’s the kind of edge the FRM certification gives you. 

Earning your FRM isn’t just about learning risk – it’s about becoming the go-to expert in a fast-moving financial world. 

Top banks, investment firms, consultancies, and regulators look for professionals who can spot, analyse, and manage complex risks that others might miss.

It also opens doors to better pay – FRMs often earn 15-30% more than their peers and career paths that can take you from risk analyst all the way to chief risk officer. 

With a global network of over 90,000 risk professionals across 190 countries, your opportunities aren’t limited by geography. 

And with emerging areas like ESG, climate, and cyber risks shaping the future of finance, FRM helps you stay ahead, think strategically, influence decisions, and turn your expertise into real impact, reputation, and career growth.


FRM Career Path

When I first looked into the FRM course, what really grabbed my attention was how practical and career-focused it is. Unlike generic finance certifications, FRM is built to give you skills you can actually use in high-impact roles.

Here’s what you stand to gain from pursuing the FRM:

Strategic Risk Expertise: You’ll learn how to spot, measure, and manage financial risks before they become big problems. Think of it as having a financial radar for every decision your company makes.

Global Recognition: FRM is recognised in over 190 countries. Your skills aren’t just for local roles—they make you a global asset.

Leadership Readiness: FRM doesn’t just teach technical stuff. It trains you to make smarter decisions under uncertainty – a skill that sets you apart for managerial and executive roles.

Future-Proof Skills: From ESG and climate risk to AI in finance, FRM ensures your knowledge stays relevant as the industry evolves.

Networking Opportunities: You join a community of over 90,000 professionals worldwide, opening doors to mentorship, collaboration, and career growth.

Real-World Impact: Imagine being a Risk Analyst, and your bank is eyeing a new investment portfolio. FRM equips you to quantify market and credit risks, spot operational weak spots, and make recommendations that protect the firm’s bottom line – turning you into a trusted decision-maker.

Risk Management Roles

But the opportunities don’t stop there. The rise of fintech and digital banking has created new roles in model risk, compliance analytics, and stress testing, where FRM knowledge gives you a powerful edge. Even consulting and tech-driven financial companies now rely on FRM-certified professionals to design robust, data-backed risk frameworks.

Whether your goal is to work with global banks or lead risk strategy for an emerging fintech, the FRM badge signals that you’re equipped to guide decisions – not just report on them.

Emerging Specialisations: ESG, AI, and Sustainable Finance

Risk management isn’t just about markets anymore.
With global shifts in ESG (Environmental, Social & Governance) standards, climate risk, and AI-driven analytics, FRMs are at the forefront of defining what financial sustainability looks like.

These evolving domains are opening new, high-impact roles in green finance, climate risk assessment, and digital risk strategy – all areas where FRM knowledge gives you a clear edge.


FRM Salary in India

More than just a pay bump, the certification opens doors to leadership. Many professionals transition from routine finance roles to strategic positions like Risk Manager or even Head of Risk within a few years of completing their FRM journey.

Let’s talk numbers. One of the biggest motivators for taking any certification is the career upside – and FRM salary delivers.

Experience LevelCommon Job RolesAverage Salary Range 
Entry-Level (0-2 years)Risk Analyst, Credit Risk Associate, Junior Risk Manager₹10-15 LPA
Mid-Level (3-5 years)Risk Manager, Market Risk Analyst, Treasury Specialist₹18-25 LPA
Senior-Level (7+ years)Senior Risk Manager, Head of Risk, Chief Risk Officer (CRO)₹30-50 LPA+
  • Fresh FRM-certified professionals start in analytical or junior management roles across banks, NBFCs, and consulting firms.
  • With experience, FRMs move into risk management and treasury functions, handling complex portfolios and regulatory reporting.
  • At senior positions, FRMs lead enterprise-wide risk frameworks, policy compliance, and strategic decision-making across financial institutions.

You can transition from an Analyst role at a mid-sized bank to a Senior Risk Manager position at a multinational after completing FRM. Within three years, your salary can nearly double, and you can lead a team that directly advises on strategic investments.

Globally, salaries are even more attractive than the FRM salary in India: FRM holders in the US, Singapore, and the Middle East often earn USD 100,000-180,000+, depending on experience and industry.


Why Choose Imarticus for the FRM Course?

The FRM is the smartest move for ambitious finance pros who want to lead, not just calculate. It’s in high demand, offers great pay, and equips you with future-proof expertise in a rapidly evolving financial world.

Thinking of studying FRM on your own? That’s possible – but here’s why Imarticus Learning makes it easier and more effective:

Why Choose Imarticus FRM:

  • Learn from Experts: Mentorship from industry pros who’ve managed risk at global banks.
  • Complete FRM Coverage: Structured, GARP-aligned guidance for Part I & II.
  • Interactive Classes: Real-time problem-solving, case studies, and doubt-clearing sessions.
  • Smart Progress Tracking: AI tools highlight your strengths and areas to improve.
  • Trusted Study Material: Kaplan resources and mock exams included.
  • Flexible Learning: Full-time, part-time, or hybrid options for working professionals.
  • Career Support: Assistance with placements at top banks and firms.
  • Pass & Career Guarantee: Structured coaching to get you exam-ready and job-ready.
  • Real-World Learning: Cases drawn from actual boardrooms, trading floors, and advisory work.

Success in FRM isn’t about cramming formulas; it’s about connecting those numbers to real situations – like understanding how a shift in interest rates ripples through bond portfolios or liquidity positions. With a clear plan, discipline, and the right training support like Imarticus’ GARP-aligned modules, most committed candidates manage to clear both parts confidently.


🎥Curious about how the FRM stacks up against other big finance certifications like ACCA, CMA, CFA, or CPA? Check out this video:


FRM Course vs CA vs CPA vs CFA vs CMA vs ACCA: Which Finance Qualification Wins?

The FRM is specialised in risk management, whereas general finance certifications like CFA or CPA focus on investments, accounting, or auditing. For professionals aiming to lead strategic decision-making in uncertain markets, FRM offers unmatched expertise and credibility.

CredentialFocusGlobal ReachSenior Salary (India)Top Role Target
FRMRisk Management (ESG, Credit)Global₹30 LPA+Chief Risk Officer
CFAInvestment AnalysisGlobal₹28 LPA+Fund Manager
CPAAccounting (US GAAP)Global₹25 LPA+CFO
CA (India)Accounting & TaxIndia₹20 LPA+Domestic CFO
CMA (USA)Management AccountingGlobal₹22 LPA+Corporate CFO
ACCAGlobal AccountingGlobal₹22 LPA+Audit Specialist

Why FRM is the Preferred Choice?

  • Directly prepares you for leadership roles in risk management.
  • Global recognition in 190+ countries ensures career mobility.
  • Hands-on skills in quantitative modelling, ESG risk, climate, and AI.
  • High earning potential with strategic career growth.
  • Networking edge with 90,000+ FRM professionals worldwide.

For finance professionals looking to step into roles where decisions shape business outcomes, FRM is not just another certification – it’s a career accelerator.


FAQs About the FRM Course 

If you’re considering the FRM course, you probably have a few questions. Here are a few frequently asked questions covering topics such as eligibility, exam difficulty, salaries and career opportunities related to the FRM course.

What is the FRM Course?

The FRM course, offered by the Global Association of Risk Professionals (GARP), is one of the most respected and in-demand qualifications in the finance world. It’s designed to help you truly understand how risks affect businesses and how to manage them effectively. Whether it’s market, credit, operational, or liquidity risk, FRM gives you the real-world tools to handle them confidently. In simple terms, it trains you to think like a risk expert – the kind of professional companies rely on when the markets get unpredictable.

Is FRM better than CFA?

Honestly, it depends on what you want to do in your career. The CFA is great if you’re drawn to investment analysis, portfolio management, or research. On the other hand, the FRM is all about understanding and managing financial risks – perfect if you’re interested in banking, treasury, or enterprise risk roles. They’re both valuable in their own ways. In fact, many professionals choose to pursue both, as the combination provides them a strong balance of investment knowledge and risk expertise – a real advantage in today’s financial world.

Who is eligible for the FRM course?

Anyone interested in finance or risk can register for FRM Part I. There aren’t strict eligibility rules. To actually earn the FRM Charter, though, you need to pass both Part I and II and have at least two years of relevant work experience in finance, investments, or risk management.

What are the FRM course fees?

The total cost of the FRM course typically ranges between ₹1,41,800 and 1,80,000. This covers a one-time enrollment fee plus the exam fees for both Part I and Part II. The exact cost depends on when you register – those who sign up early usually pay less. So, if you plan and register during the early window, you can save quite a bit compared to the standard registration fee set by GARP.

Is FRM tougher than an MBA?

They’re different. An MBA gives you a broad understanding of business, while FRM is highly specialised and technical. Many people find FRM more quantitative, especially in areas such as probability, statistics, and valuation models. That said, pairing an MBA with an FRM can give you an edge in strategic and technical skills.

Is the FRM Course Very Difficult?

Let’s be honest – yes, it’s challenging. GARP designed the exam to test real-world understanding, not just theory or rote learning. You’ll be diving deep into quantitative methods, risk models, and decision frameworks that push you to think like a strategist. Pass rates usually range between 40% and 60%, which tells you it’s rigorous but absolutely doable with the right approach.

Can I complete the FRM course in 1 year?

Yes! With the right plan, it’s doable. Many candidates take Part I in May and Part II in November. With consistent study and guidance from institutes like Imarticus Learning, you can complete both parts in just one year.

What is the FRM Salary?

FRM-certified professionals generally start around ₹12-15 LPA in entry-level roles, often as Risk Analysts or Associates. Once you gain a few years of experience, the numbers rise quickly – mid-level professionals earn between ₹18-25 LPA, while senior roles, especially in risk leadership or treasury, cross ₹30 LPA and beyond.

Who Hires FRMs in India?

FRM professionals in India land roles at some of the biggest names in finance – HDFC, ICICI, SBI, and the Big Four consulting giants like Deloitte and KPMG. You’ll also find them steering risk at global banks like Morgan Stanley, Citi, and HSBC. But it’s not just the traditional players – fintech startups, asset managers, rating agencies, and even regulatory bodies are now actively hunting for FRM-certified talent. If you want to be the go-to person who helps firms navigate risks and make smarter decisions, getting your FRM opens doors everywhere.


Take Charge of Tomorrow’s Financial Challenges with FRM

The FRM course is your ticket to stepping out of routine finance tasks and into strategic risk leadership. The FRM isn’t just about clearing exams – it’s about truly mastering the skills to navigate real-world challenges like market volatility, credit risks, operational hiccups, and even newer threats such as ESG and cybersecurity. 

It’s a globally recognised credential that earns you respect and opens doors to top banks, consulting firms, fintechs, and regulatory bodies. More than anything, it gives you the confidence and credibility to make an impact where it matters most – in key financial decisions.

Ready to lead, not just calculate? Start your FRM Course journey with Imarticus Learning, where expert mentors, GARP-aligned curriculum, smart progress tracking, and real-world case studies come together to make your success achievable. Take that decisive step towards becoming the financial strategist tomorrow’s market needs.

Why FRM Certification is the Best Career Option for Finance Experts

Introduction

FRM Certification is the pinnacle of risk management qualifications, which enables finance experts to analyse and manage complex financial risks. 

With increasing regulatory pressures and market volatility, international employers seek experts who know how to map credit, market and operational risk. 

By obtaining an FRM Certification, you sharpen your analytical ability and signal to international employers that you possess the math and ethics capabilities necessary to manage assets and drive strategic decision-making.

What is FRM Certification?

The FRM Certification, developed by the Global Association of Risk Professionals (GARP), tests candidates on:

  • Foundations of risk management and quantitative analysis
  • Valuation methods, derivatives and issues in today’s markets
  • Credit risk measurement and credit risk management
  • Operational risk frameworks and risk modelling

Part I consists of 100 multiple‑choice questions to be completed in four hours, and Part II consists of 80 multiple‑choice questions to be completed in another four-hour exam. 

The candidates should pass both exams and acquire two years of relevant professional experience to be deemed eligible. 

Until now, over 90,000 professionals have obtained the FRM charter, demonstrating its popularity and global reach.

Why a Financial Risk Manager Course in India

Enrolling in a Financial Risk Manager program in India ensures you will learn in a setting that combines local market forces with GARP’s global syllabus. 

Leaders in the industry, like Imarticus Learning, offer:

  • Live, interactive classes from industry experts
  • Detailed mock exams with analytics-based feedback
  • Active peer forums and mentorship support

These topics enable you to develop a deeper understanding of key concepts, such as Basel III capital requirements and stress testing, and to hone the skills applicable to real-world risk situations.

FRM Career Development Prospects

FRM career development prospects include some high-impact roles:

  1. Risk Analyst (Quantitative modelling, scenario analysis)
  2. Credit Risk Manager (Loan portfolio valuation, credit scoring)
  3. Operational Risk Specialist (Process audits, control framework design)
  4. Regulatory Compliance Officer (Policy implementation, reporting)
  5. Chief Risk Officer (CRO) (Board advisory, enterprise risk management)
  6. Climate Risk Analyst (Sustainability and environmental risks analysis)
  7. FinTech Risk Consultant (Cryptocurrency and cybersecurity risks analysis)
RoleAverage Salary (INR LPA)Key Responsibilities
Risk Analyst6–10Quantitative models and stress-testing
Credit Risk Manager10–15Loan portfolio monitoring and credit scoring
Operational Risk Specialist8–12Control evaluations and loss analysis
Regulatory Compliance Officer12–18Compliance audits and regulatory reporting
Chief Risk Officer25+Strategic risk governance and leadership

Advantages of FRM Certification

The benefits of FRM certification far outweigh a line on your resume:

  • Global Acceptance: FRM-holders are accepted in 190+ countries.
  • Compensation Boost: ₹9–12 LPA base pay for Indian FRM professionals
  • Excellent Network: GARP alumni conference, webinars and thought-leadership access.
  • Skill Enhancement: Proficiency in complex risk models, stress-testing techniques and regimes.
  • Continuous Learning: GARP’s Risk Intelligence platform is updated monthly on new risks and best practices.

Global Risk Management Career

A Global risk management profession is concentrated in major financial centres like London, Singapore, and New York, where risk professionals with professional credentials hold key positions. 

Financial managers’ occupations are forecasted to grow 17% between 2023 and 2033, contrasted with a 4% increase for all occupations over the same timeframe (Bureau of Labor Statistics).

Key trends driving demand are:

  • More regulation, management, and capital levels
  • Increasing demand for cryptocurrency and digital asset risk management
  • Greater emphasis on reducing climate risk and sustainability
  • Increased application of AI and data-driven risk analytics

FRM Course Eligibility and Scope

Understanding FRM course eligibility and scope makes your preparation easy:

Eligibility: Bachelor’s degree (any stream) or equivalent; final-year students can enrol.

Exam Schedule: Part I and Part II are both available every May, August, and November.

Curriculum Coverage: Areas covered in teaching are market risk, credit risk, operational risk, derivatives, quantitative analysis and new issues.

Fees: Standard Fee of USD 800 for Part I and Part II; USD 600 for Part I and Part II for early registration, and also one-time registration fee of USD 400 is to be paid.

FRM versus Other Risk Credentials

FRM is solely focused on risk management, while other credentials are broader or of a differing focus:

RoleAverage Salary (INR LPA)Key Responsibilities
Risk Analyst6–10Quantitative models and stress-testing
Credit Risk Manager10–15Loan portfolio monitoring and credit scoring
Operational Risk Specialist8–12Control evaluations and loss analysis
Regulatory Compliance Officer12–18Compliance audits and regulatory reporting
Chief Risk Officer25+Strategic risk governance and leadership

How to Effectively Prepare for FRM Certification

A thoughtful study calendar is the key:

  • Plot the Syllabus: Allocate topics for each part and assign studying hours (200–250 hours per Part).
  • Choose the Right Material: Utilise GARP’s authentic study materials, including Schweser Notes, AnalystPrep, and Imarticus Learning study packs.
  • Peer Groups: Studying in groups enhances memory and introduces you to various problem-solving approaches.
  • Mock Exams: Simulate practice tests to build exam stamina and improve time management.
  • Weak Spots: Analyse study performance reports to reveal quantitative or conceptual knowledge deficiencies.
  • Up-to-Date: Study GARP’s monthly Risk Intelligence bulletins for trends and exam question insights.

Industry Insight & Fresh Perspective

Updated GARP data indicate that 40% of job specifications for risk jobs now include FRM Certification as desired or needed, again solidifying its central role in hiring. 

Banks and financial institutions are trying to keep up with emerging risks—like AI-tailed trading irregularities and climate-borne credit risk exposure—so demand for certified risk managers keeps increasing.

Watch the below video to know more 

FRM Certification Explained

Frequently Asked Questions

What is the pass rate for the FRM?

    Part I is around 55%; Part II is roughly 52%.

    How much preparation time do I need?

    Allow 200–250 study hours per exam.

    Can I sign up before graduation?

    Yes, final-year students are also eligible.

    Is prior work experience necessary before exams?

    No, two years’ work experience in the relevant field following the clearing of both parts.

    What study material is recommended?

    GARP study material, Kaplan Schweser, AnalystPrep and Imarticus study material.

    Are there online and classroom classes?

    Yes; Imarticus Learning and Kaplan offer both classroom and live-online classes.

    How is FRM distinguished from CFA?

    FRM deals with risk, whereas CFA focuses on broader portfolio management.

    Conclusion

    Apart from enhancing your quantitative and ethical abilities, FRM Certification provides the best career opportunities worldwide in the field of risk management, a skill deemed necessary in today’s modern age.

    Key Takeaways:

    • Highest Demand: 54% of companies plan to expand risk teams within the next 18 months.
    • Competitive Compensation: From ₹9 LPA to ₹33 LPA maximum with experience.
    • Global Mobility: Valid in over 190 countries, leading to opportunities in London, Singapore, New York, and other professional destinations.

    Ready to begin your risk career now? 

    Enrol for the FRM Certification preparation program with Imarticus Learning. 

    Make use of expert guidance, in-depth mock tests and personalised placement support. 

    Top Statistical Concepts Every Data Scientist Should Master

    In the hectic era of data science, statistical concepts are the pillars of wise decision-making, precise model forecasts, and wise data stories. Machine learning model construction or riding business metrics, sound knowledge of statistics is essential. Having an ability to grasp basics of statistics for data science, in this hectic competitive data-driven enterprise era, is an absolute requirement for anyone in this profession.

    In this blog, we’ll explore the important statistical concepts for data scientists, and basics of statistics for data scientists from foundational ideas to the more nuanced statistical methods in data science. We’ll also discuss how these concepts apply practically and why every aspiring professional must-know stats for data science to thrive in their career.

    Statistical Concepts

    Why are Statistical Concepts Important in Data Science?

    Statistics is not merely something in your school background. It’s the foundation of data science. Any algorithm, any prediction, any correlation – they’re all built on statistical theory. From machine learning statistics to running data experiments, data scientists use stats to decode and validate results.

    Statistical Concepts Provide:

    • Order of Data Interpretation
    • Validation
    • Inventive Summaries of Trends
    • Platform for Hypothesis Testing
    • Predictive and Probabilistic Tools

    Now, let’s talk about the key statistics for data science that any professional needs to know.

    Descriptive Statistics: The Foundation

    There is descriptive statistics in every single dataset – they’re measures that aptly summarize data.

    Key Measures Include:

    • Mean, Median, Mode: Simple measures of central tendency.
    • Standard Deviation & Variance: Dispersion measures that reflect data spread.
    • Skewness & Kurtosis: Distribution shape measures.

    These factors enable analysts to immediately understand the data structure prior to getting to dig deeper.

    Probability: Measuring Uncertainty

    No discussion of statistical concepts would be complete without a discussion of probability. It is the foundation of decision-making and predictive models.

    Key Ideas:

    • Probability Distributions such as Binomial, Normal, and Poisson
    • Conditional Probability & Bayes’ Theorem
    • Monte Carlo Simulations

    Statistics and data science’s probability enables data scientists to put numbers on uncertainty and provide more informed estimates.

    Inferential Statistics: Drawing Conclusions from Samples

    While descriptive stats enable you to summarize your dataset, inferential stats enable you to make conclusions beyond your dataset.

    Core Methods:

    • Confidence Intervals
    • Hypothesis Testing (Z-test, T-test)
    • Chi-square Tests
    • ANOVA (Analysis of Variance)

    These are the fundamentals of running A/B testing, customer testing, and model testing on real-world data science pipelines.

    Regression Analysis: Building Predictive Models

    Perhaps the most ubiquitous statistical technique of data science, regression assists in assessing association and predicting future trends.

    Types of Regression:

    • Linear Regression: most suitable for continuous prediction
    • Logistic Regression: applied to classification problems
    • Ridge/Lasso Regression: regularized forms for greater accuracy

    Regression is one of the data science stats staples because it yields insights into feature significance and the ability to forecast.

    Bayesian Thinking: A Modern Approach to Inference

    Bayesian statistics are increasingly applied due to its inherent handling of uncertainty.

    Concepts Include:

    • Prior and Posterior Probability
    • Bayesian Inference
    • Bayesian Networks

    The majority of statistics and data science work, particularly in recommendation systems and NLP, is based on this paradigm.

    Sampling Techniques: Working With Real-World Data

    Sampling allows for effective handling of big data in the form of representative samples.

    Important Techniques:

    • Random Sampling
    • Stratified Sampling
    • Systematic Sampling
    • Bootstrap Sampling

    Sampling is crucial to prevent biases and keep the model pure.

    Central Limit Theorem (CLT): Statistical Bedrock

    CLT tells us why most statistical methods perform so well. CLT tells us that with the population size being large enough, the sampling distribution of the mean will be very close to a normal distribution.

    It’s used in most statistical concepts and is the fundamental thought process of hypothesis testing.

    Feature Selection and Correlation

    It is absolutely critical to recognize the behavior of correlation and its limitations while selecting features for a model.

    • Pearson Correlation Coefficient
    • Spearman’s Rank Correlation
    • Multicollinearity Analysis (VIF)

    Variable selection is essential to design effective and efficient ML models.

    Time Series Analysis: Tracking Data Over Time

    Applied in financial forecasting, trends in sales patterns, and predicting stock prices.

    Techniques:

    • Moving Averages
    • ARIMA Models
    • Exponential Smoothing

    These statistical values enable one to understand the pattern of variable change over time.

    Imarticus Learning’s Data Science Course: Practical Stats in Action

    If you want to apply all these key statistical concepts to data scientists in live projects, the Postgraduate Program in Data Science and Analytics by Imarticus Learning simply does that.

    This 6-month program includes:

    • Job-oriented Curriculum: Python, SQL, Tableau, and statistics
    • 10 Interview Guarantees: With 2000+ hiring partners
    • Projects Based on Real-world Applications: 25+ projects with statistical applications
    • Live Learning & Career Services: Resume development, hackathons, mentorship

    22.5 LPA top salary and 52% mean raise, this is the best way to study statistics for data science with job assurance.

    Real-world Applications of Statistical Concepts

    In Machine Learning:

    Control by regression, classification, and probability supervise learning

    Statistical distances are utilized in clustering and density estimation

    In Business:

    • A/B marketing campaign testing
    • Forecasting sales trend analysis

    In Healthcare:

    • Biostatistics in clinical trials
    • Risk prediction models

    These machine learning ideas equip professionals across domains of life.

    Challenges in Learning Statistics

    Statistics are strong, but students are afflicted by:

    • Too complicated mathematical notation
    • Scary jargon
    • Lack of ability to connect practice and theory

    That is why a structured course like Imarticus’ Data Science Course is necessary.

    Tips to Learn Statistics for Data Science

    • Begin with Descriptive Stats and Visualisations
    • Python Packages such as Statsmodels & Scipy
    • Apply principles to actual datasets
    • Mentor-guided courses
    • Hackathons and competition

    FAQs

    1. Why are statistical concepts important in data science?

    They form the basis of all analysis models and methods and are employed to retrieve conclusions and test predictions.

    2. What are the most important statistical methods for data scientists?

    Descriptive statistics, probability, regression, and hypothesis testing are the stars of the show.

    3. Is it necessary to be a math expert to learn data science?
    No, but you do have to know elementary statistics.

    4. How can I apply statistics in real-world projects?
    Use them for A/B tests, machine learning model validations, and business analytics projects.

    5. Are there tools that make learning statistics easier?

    Yes, Python (Scipy, Statsmodels), Excel, and R make statistical analysis easier.

    6. Can I learn statistics without coding?

    You can learn theory, but in today’s life, you have to know basic programming.

    7. How does the Imarticus course cover statistics?

    It involves practical exposure of Python, SQL, and introductory statistical theory through case studies and projects.

    Conclusion

    Statistics principles aren’t something that you decide to learn – it’s a necessity. If you’re looking for trends within patterns or creating machine learning models, core statistics for machine learning, statistics in data science helps you take numbers and turn them into findings. Bayesian inference to hypothesis testing, every principle gets you one step nearer to becoming an excellent data scientist.

    Ready to start your odyssey? With Imarticus Learning Postgraduate Programme in Data Science and Analytics, not only do you learn all this, but get to implement it on real-time projects, with 100% job guarantee and unparalleled career advice.

    Top Python Libraries for Data Analysis: Boost Your Skills

    Python is now the undisputed data science king—and, not surprisingly, so. Its simplicity, malleability, and size of library ecosystem are some of the reasons that it remains the perfect tool for data manipulation, visualization, and analysis. For either the new entrant newcomer entering the picture or the experienced analyst scaling up high-end models, mastery of the leading Python libraries for data science is the thing.

    If you’re studying data science, or at least considering it, then you’ve probably already heard the names Pandas, NumPy, Matplotlib, etc. This tutorial is all about the Python packages for data analysis that will bring you up to the next level. They’re not just a timesaver— they’re a must to anyone serious about getting this done.

    In this article, we will talk about the most popular Python libraries utilized in data analysis, best Python tools for data analysis, and how they are used in production pipelines, and their usage.

    Top Python Libraries

    What Makes Python Ideal for Data Science?

    Let us take a look at why Python is the favored language for data science.

    Readability and Simplicity

    Python has clean and readable syntax. It is easy for new developers to learn, and it removes the complexity that most programming languages contain.

    Community and Support

    There are wildly enormous numbers of developers who support and take care of data analysis with Python libraries with day and night support and very descriptive documentation.

    Compatibility with Tools

    Python is highly compatible with tools like SQL, Hadoop, Spark, Tableau, and Power BI.

    Pandas: The Backbone of Data Analysis

    Query any data scientist his workhorse tool for his day-to-day operations and Pandas will more than likely be the answer. Pandas offers smooth data analysis with clean data and offers high-level data manipulation capabilities.

    Key Features:

    • Tabular data in DataFrames
    • Smooth CSV, Excel, SQL imports
    • Grouping, filtering, joining, reshaping data

    Use Case: Cleaning and preparing ginormous data sets to feed machine learning algorithms.

    NumPy: Powerful Numerical Computing

    NumPy (Numerical Python) forms the foundation of all Python data pipelines. NumPy offers n-dimensional array and high-level numerical functions.

    Key Features:

    • Support for large datasets
    • Fourier transform, linear algebra, and random numbers
    • Construction blocks for libraries such as TensorFlow and SciPy 

    Usage: Math calculation between ginormous matrices in a data science training course.

    Matplotlib: Data Visualization Made Easy

    Matplotlib is the old grandfather of Python graphics libraries. It is capable of taking raw data and converting it into meaningful visualizations with small amounts of code.

    Key Features:

    • Has support for bar chart, line chart, scatter plot, histogram
    • Very configurable and horrifyingly flexible
    • It is capable of embedding itself in applications

    Use case: Plotting customer trends in exploratory data analysis.

    Seaborn: Statistical Graphics on Steroids

    Along with Matplotlib, Seaborn is equally good as an info-visualiser and as a prettifier. Also works exceedingly well with Pandas DataFrames.

    Key Features:

    • Themes and in-built color palettes
    • Violin plots, regression plots, box plots, etc.
    • Statistical libraries integration

    Use Case: Plotting heatmaps of correlation in your data science course capstone project.

    SciPy: Advanced Scientific Computing

    SciPy is built on top of NumPy and is a library to facilitate scientific and technical computing. It is generally used to calculate optimisation, statistics, and linear algebra issues.

    Key Features:

    • Interpolation and integration
    • Signal and image handling
    • Multidimensional image operations

    Use Case: Executing high-level simulations in research work data.

    Scikit-learn: Machine Learning Simplifiedg

    Due to being one of the most effective Python modules for machine learning and data processing, Scikit-learn facilitates clustering, regression, classification, etc.

    Key Features:

    • Preprocessing techniques like MinMaxScaler, OneHotEncoder
    • Classification, regression models like SVM, Logistic Regression, etc.
    • Tools for model performance

    Use Case: Loan approval prediction in a banking case study for data science training.

    Statsmodels: Statistical Modelling the Right Way

    Statistical modelling at heart, and hypothesis testing too, if that’s what you want, then Statsmodels is the place for you. It provides you with an insight which can’t be obtained using machine learning models.

    Key Features:

    • Linear regression, logistic regression
    • Time-series analysis
    • ANOVA, chi-square tests

    Use Case: Time-series forecasting model designing to predict stock prices.

    TensorFlow and PyTorch: Deep Learning Giants

    Even though both such libraries are technically used to perform deep learning, both these libraries get proper utilization in Python data manipulation and data analysis at the abstraction level through the use of Python.

    Key Features:

    • Building neural networks and training them
    • GPU acceleration
    • Scaling on CPUs and clusters

    Use Case: Building image classification models in sophisticated AI modules.

    Plotly and Bokeh: Interactive Visualisation

    Matplotlib and Seaborn are awesome, yes, but Plotly and Bokeh offer something more—interactivity.

    Key Features:

    • Hover tools and click events in dashboards
    • Integration with web apps
    • Zoomable, pannable plots

    Use Case: Real-time dashboard generation for a business analytics project.

    Jupyter Notebook: The Ultimate Playground

    Originally a standard library, Jupyter Notebook is now just a bare necessity of every data analysis practitioner. It has code, images, and documentation all under one roof.

    Use case: Interactive presentation and report generation for portfolio creation.

    Real-World Application: From Learning to Earning

    Imarticus Learning 6-month job-assured Postgraduate Programme in Data Science and Analytics covers all these best Python libraries as a part of the course. Students are guided from Pandas to TensorFlow via 25+ real-time live projects.

    Online and classroom course advantages:

    • 100% Job Guarantee
    • 10 Sure Shot Interviews
    • 52% Average salary increase
    • Access to 2000+ Hiring Partners

    Course curriculum allows you to collaborate with Python data manipulation libraries, such as Power BI, SQL, and live hackathon case studies.

    Benefits of Mastering Top Python Libraries

    Career Edge

    Knowledge of top Python libraries makes you employment-ready to implement in any industry—fintech or healthcare, for example.

    Practical Exposure

    Imarticus’ courses don’t just make you “learn” but develop your skills through Python coding for data analysis.

    Portfolio Building

    You may upload all of your actual projects that you are working on at present to your GitHub, and you are competent enough to be recruited by the recruitment managers.

    FAQs

    1. What are the top Python libraries for data analysis?

    The most important ones are Pandas, NumPy, Matplotlib, Seaborn, Scikit-learn, Statsmodels, and TensorFlow.

    2. Do I need to know all libraries to start a data science career?

    No, start with Pandas and NumPy for data science. Once you’re familiar with those, you’ll need to learn the others like Scikit-learn and Matplotlib.

    3. Are these Python libraries used in actual companies?

    Yes. Start-ups and Fortune 500s alike, these libraries make up the foundation of data teams globally.

    4. Is it better to learn Python or Excel for data analysis?

    Excel can be okay for small businesses but Python can be scaled up and automated and therefore is used by professionals.

    5. Can I master these libraries through an online course?

    Yes. Imarticus’s Postgraduate Program in Data Science and Analytics imparts comprehensive training in all the large scale Python libraries.

    6. How long will it take to learn these libraries?

    If you invest the time, 3–4 months will be sufficient to learn basics with projects and training from experts.

    7. Are these libraries free to use?

    Yes. All the aforementioned large Python libraries are open-source and free.

    Conclusion

    The data science world is big and breathtaking—but gated by the incorrect tools, inaccessible to you. Beginner or upgrade, discovering the best Python libraries is your path to smarter data.

    If you are looking for a structured method to know about all these tools, then Imarticus Learning’s Postgraduate Program in Data Science and Analytics is your doorway to an exciting high-salary and future-proof career.

    How to Develop In-Demand Data Science Skills: Tips and Resources

    Data science skills are business need in the coming age of digital economy. Whether you are current working individual or engineering college student, you have to get appropriate set of in-demand data science skills like any other professional individual so that you can achieve the high-level job in this competitive era. The demand for limited data science talent increases every day, and thus it is one of the future-proof and highest revenue-generating careers across the world. 

    How Essential Data Science Skills Are?

    Companies all over the world are making decisions, predicting trends, and viewing the world as data. That also poses more challenging tasks to skills of a critical nature. Companies are being enabled to do business with information in an improved way by data scientists in a way that organizations become enabled and form new ideas.

    Skills Required for Data Scientists

    You need to learn technical and soft skills to remain updated with this career. The top skills are:

    • Programming Skill: Python, R, SQL skill.
    • Data Cleaning and Processing: Data cleaning, processing skill, data handling using libraries like Pandas and NumPy.
    • Statistical Analysis: Basic stats, probability, hypothesis testing.
    • Machine Learning Basics: Knowledge of ML algorithms and usage of ML.
    • Data Visualization: Practical experience in creating dashboards with Power BI, Tableau, or Matplotlib.
    • Big Data Technologies: Practical experience in using Hadoop, Spark, or similar technology.
    • Communication: Practical experience in presenting findings from deep data to technical business decision-makers.

    Technical data science skills are the flavor of the month. Imarticus Learning’s Postgraduate Program in Data Science and Analytics familiarizes you with domain-based learning of subject matter areas such as:

    • Python & SQL
    • Data Visualisation & Analytics
    • Power BI & Tableau
    • 25+ business project experience

    Business-agnostic, and voila. You’re a master of the key skills of a data scientist.

    Must-have Data Science Skills for Beginners

    Beginners, you have to know these core skills to start with:

    • Python programming basics
    • Data wrangling using Pandas
    • Chart-based data visualisation basics
    • Probability & statistics basics
    • SQL database query

    Our data science course provides seamless acquisition of these skills via live sessions and guidance.

    Data Science Career Key Skills

    Hiring managers in data science seek owners of pertinent knowledge to implement in real-world problems. The data science key skills for a data science career are:

    • Data storytelling: data insights as stories
    • Developing machine learning models
    • Business context
    • Data problem-solving
    • Knowledge of Python, SQL, and data tools

    Top Data Science Skills Hired by Recruiters

    Practice of top skills recruiters seek:

    • Pre-processing & data manipulation
    • Application of machine learning
    • Model testing & tuning
    • Stakeholder management & communication
    • Real-world project working experience

    Learning Materials to Develop Data Science Skills

    Acquisition of core skills includes exposure to quality learning materials. Some of the learning materials which are suggested include:

    • Web-based learning portals such as Coursera, Udemy, and Imarticus Learning
    • Industry case studies & industry project
    • Coding hackathons & coding contests
    • Experiential development environments such as Jupyter Notebooks

    Why Imarticus Learning?

    Our Postgraduate in Data Science and Analytics features:

    • 100% Job Guarantee with 10 assured interviews
    • Experiential job-focused curriculum
    • 25+ experiential projects
    • Practice on 10+ data science tools
    • Career mentorship by career mentors
    • Placement with 2000+ hiring companies
    • Industry-approved faculty

    Career Prospects After Gaining Data Science Skills

    Gaining the right skills can make you a:

    • Data Scientist
    • Data Analyst
    • Business Analyst
    • Machine Learning Engineer
    • Analytics Manager
    • Business Intelligence Specialist

    Conclusion

    Data science skills is your gateway ticket to a thrilling, future-proofed career. Invest wisely in training, key skills for data science jobs, and mentorship by Imarticus Learning, and you can purchase hot data science skills that will be in hot demand by employers. Up-skilling or fresh graduate, invest in yourself today and be the pioneer of data science professionals.

    FAQs

    1. What are the key data science skills?

    • Python/SQL coding, stats, data analytics, machine learning, and communication.

    2. Can a novice learn fundamental data science skills?

    • Absolutely! Our course is specially tailored for beginners to develop proficiency right from the ground level.

    3. How long before you’re a data science master?

    • You can acquire marketable skills and hands-on training with our 6-month duration.

    4. Do I need technical skills for data science?

    • Technical skills, of course, but business administration and soft skills as well for us.

    5. What are the top demanded data science skills of 2024?

    • Data wrangling, machine learning, data storytelling, and Python remain in demand even now.

    6. How does Imarticus skill up applicants with data science skills of today?

    • With live lecture, project, mentorship, and interview assurance.

    7. Does technical background remain a necessity for carrying out data science?

    • We need no technical background at all. We have a great study course within our program and are even student-focused.

    8. Can I complete data science work anywhere on the globe?

    • In-demand Data science can be worked upon anywhere in the world, and we do prepare our students to be globally competitive as well.

    9. What am I learning to apply in the program?

    • Python, SQL, Power BI, Tableau, etc.

    10. What is the job guarantee?

    • We have 10 interview booking of interviews with 2000+ partners which can get you employed.

    From Zero to Hero: Your Data Science Success Blueprint

    In today’s data age, enrolling in a data science course is not only an educational process—it is a passport to entry into one of the most remunerative and fulfilling career options of the digital age. This course, as a career change or new college graduate, has the potential to turn you around from zero to hero by making you more hands-on, job-guaranteed, and analytics-confident.

    The demand for data professionals is through the roof. Companies are making decisions on the basis of data more and more, and the world is in need of capable data scientists in increasing and increasing numbers every year. You have our Postgraduate Programme in Data Science and Analytics with a 100%-job-assurance-guaranteed course, 25+ projects, 10+ tool exposure, and mentorship that actually makes your journey, all under Imarticus Learning.

    Let’s discuss how this data science course can be your gateway to a lucrative analytics and tech career.

    Data Science Course

    What is a Data Science Course?

    Understanding the Basics of a Data Science Course

    A data science course is technique and tool-based with prerequisite courses in Python, SQL, Tableau, and Power BI. The data science for beginners courses to professionals who can work in heavily regulated industries through intense project work, placements, and training.

    You will learn:

    • Data wrangling and collection
    • Exploratory data analysis
    • Machine learning algorithms
    • Predictive modeling
    • Visualisation using BI tools
    • Communication of results to stakeholders

    Wherever it is an on-campus or online data science course, the program supports multi-styled learning to yield results that matter.

    Why Learn Data Science Today?

    Exploring the Scope for a Career in Data Science

    The world is generating data at a bewildering pace—2.5 quintillion bytes per day, actually. The data itself is not necessarily useful unless utilized in the proper manner, and that’s where data science learning courses are of use.

    Why learning data science is a good idea:

    • Massive career opportunities in financial services, health care, retailing, and technology industries
    • High paying salaries with starting offers of 4–7 LPA and even 22 LPA and higher for working professionals
    • Offshore demand guarantees opportunities overseas
    • Develops reasoning skills, a key 21st-century skill

    Curriculum Overview: Learn the Right Tools

    What Will You Learn in a Data Science Course?

    A proper online course in data science will have theory, application, and employability-based modules. Imarticus’ course includes:

    • Python for data manipulation
    • SQL for database management
    • Machine Learning for prediction
    • Power BI & Tableau for visualization
    • 25+ Projects to apply concepts to actual projects

    Students are exposed to Imarticus COE Hackathons and case studies that hone technical as well as business acumen. The combination makes you stand out in the job market.

    Job Assurance and Placement Success

    How a Data Science Training Program Ensures Career Success

    Job placement is the biggest fear barrier that students face. At Imarticus Learning, you are assured of:

    • 100% Job Guarantee
    • 10 Interview Guarantees
    • 2000+ Recruitment Partners
    • 52% Average Pay Rise
    • Max Package of max 22.5 LPA

    This data science course is results-driven. You also receive:

    • Resume guidance
    • Interview preparation
    • Personal guidance
    • Career mapping sessions

    This type of guidance benefited over 15,000 students in getting placed at top companies.

    Career Opportunities After a Data Science Course

    What Jobs Can You Get After This Course?

    It is not a course. It is a career launcher for roles such as:

    • Data Scientist
    • Business Analyst
    • Data Analyst
    • Machine Learning Engineer
    • Business Intelligence Specialist
    • Analytics. Manager
    • Data Science Consultant

    They will be in sectors as broad as banking and e-commerce and will go up in number even more as more businesses are adopting data-driven strategies.

    Who Should Enrol in This Course?

    Is This Course Right for You?

    The data science course is best suited for:

    • Recent graduates holding engineering or technical diplomas
    • Working professionals with less than 3 years of work experience
    • Career transition candidates, who need to shift to an analytics career.
    • Professionals with data logical and analytical problem-solving skills

    Being a low coding skill or a beginner coder, instructor-led training is given in this course.

    Real Projects. Real Skills.

    Why Projects Matter in a Data Science Course

    You don’t learn theory—you implement real solutions. Imarticus provides:

    • 25+ Interactive Projects
    • Simulation for Ethical Banking
    • AML Detection Systems
    • Analytics on Business Use-Case

    The projects are business simulated problems and prepare you to derive value out of data in high-risk environments.

    Learn Online or in the Classroom

    Flexible Learning Modes with Equal Impact

    Whether you are taking online classes or want classroom sessions, the data science course is made to be interactive. From live expert sessions and peer group work to round-the-clock learning access, you experience the best of both worlds.

    • Weekday batches to suit working professionals
    • Interactive modules and peer reviews
    • Real-time doubt resolution

    What Makes Imarticus the Best?

    Key Reasons to Choose Imarticus to Become a Data Scientist

    • Best Education Provider in Finance (Elets World Education Summit 2024)
    • 1000+ Placement Partners – top MNCs
    • 60%+ Top-Tier College Students
    • Best Placement History in 1200+ Batches

    While choosing a course in data science, choose the one with placement figures, industry acceptance, and student success stories.

    What Our Alumni Say?

    Some of the new data science graduates have secured jobs as senior analysts or BI experts in mere 6 months. All thanks to Imarticus’ career counseling, networking, and technology-driven training.

    This is what one of them has to say:

    “The game-changer was career mentoring and live projects. I got placed within weeks of graduation!!”

    Key Benefits Recap

    • 6-Month Intensive Program
    • Live Online & Classroom Training
    • 25+ Projects & Hackathons
    • 10+ Tools Covered
    • 10 Interview Job Guarantees
    • 100% Job Guarantee

    You will learn how to be a master in data science from the ground up and how to ensure you apply that skill for placement in a best-fit job.

    FAQs

    1. Is this course suitable for beginners?

    Yes. Syllabus begins from the beginning and is best for technical background or analytical type of person.

    2. Do I need coding experience?

    No experience in coding is required, but that is always welcome. Python and SQL are taught from the very beginning in the course.

    3. Will I receive job placement assistance?

    Yes. The course promises me 100% job placement guarantee and 10 guaranteed interviews.

    4. What tools will I learn?

    You will be learning Python, SQL, Power BI, Tableau, etc.

    5. How long is the course?

    Course duration is 6 months with live classes, projects, and exams.

    6. Can I join if I’m working full-time?
    Yes. Time slots of weekday batches are also convenient for professionals.

    7. What kind of roles will I be eligible for?

    Data Scientist, Analyst, BI Specialist, ML Engineer, and more analytics jobs.

    Conclusion: Take the First Step Today

    Selecting a data science course is a career-defining decision. From learning the new tools to job guarantee, this is one decision that will change your life. Imarticus Learning’s course is not learning—It’s doing, showing, and expanding. Join the over 15,000 students who already changed their lives. Your data science journey starts.

    Understanding Investment Banking Course Duration & Career Tips

    The best course length to be able to do investment banking can be the make-or-break for your finance career. You may be either a new graduate or an already established professional seeking to transition into a high-growth career, and the perfect course—at a perfect length—can give you the perfect skills and certifications. Since investment banking is the most rewarding and highest-growth finance career, you must have the blueprint. From technical skills that are the learning prerequisite for projects and global banking experience, it begins with choosing the best program duration.

    Why Choose a Career in Investment Banking?

    Investment banking is not only about glory but also about unmatched learning and reward. From leading mergers and acquisitions to purchasing and selling financial securities and advisory services, the choices are unlimited.

    Reasons why one should be an investment banker:

    • Good pay and bonuses
    • Steep learning curve with rapid progression
    • Interaction with high-profile client and deal
    • International career possibilities
    • With proper training

    Via suitable finance courses with placement, experts can set robust foundations and accelerate rapidly up the ranks.

    Understanding Investment Banking Course Duration

    So, what is the optimal investment banking course duration then? Courses depend on your career and experience level, ranging from fast 3-month courses to long 6-month courses.

    Short courses comprise of:

    • Introduction to financial markets
    • Operations in investment banking
    • Life cycle and regulation of trade

    Extended versions include:

    • Module details of wealth & asset management
    • Case studies in risk management
    • Practice sessions on KYC, AML, and moral banking

    Your choice depending on how fast you want to get into the corporate sector and how much learning you need.

    Career Impact of Completing the Right-Length Program

    Choosing a course with the ideal course duration in investment banking keeps you from either overtraining or undertraining. Students of optimal-duration courses enjoy:

    • Fewer job search rounds
    • Higher placement rates
    • Enhanced job readiness
    • Early contribution as associate/analyzer

    A flawless planned curriculum—like Imarticus Learning’s CIBOP—uses the course duration and harmonizes it with the needs of the industry, bringing you to the finance industry without waves.

    Skills You Gain Through a Certified Course

    Skills are the pillars of any investment banking career. The right course, short-duration or long-duration, needs to accommodate instruction for:

    • Excel & Financial Modelling skills
    • Settlement trade procedures
    • Risk and regulatory definitions
    • Securities, derivatives, and fixed-income information

    Technical and soft skills in combination release the investment banking career prospects and make you confident to attend interviews.

    Placement Opportunities That Follow

    If you opt for a placement program in finance, not only will you be studying, but you will also be offered assured job placements. Finance courses like CIBOP provide:

    • 7 guaranteed-to-get-an-interview chances
    • 1000+ placement partners
    • 4 LPA average CTCs; industry-best packages at 9 LPA
    • KYC, trade surveillance, risk management jobs

    Course duration directly correlates with how quickly you can get placed—quicker certification = quicker placement and career development.

    Choosing the Best Investment Banking Certification

    All certifications are not created equal. The best investment banking certification is one that:

    • Offers theory combined with exposure
    • Offers real-world projects and simulations
    • Offers placement and industry recognition
    • Offers mentorship and resume/interview coaching

    Imarticus Learning’s Certified Investment Banking Operations Professional (CIBOP) has it all. Both the 3 and 6-month duration option ensure that it accommodates your schedule and learning pace.

    Real-life Projects That Shape Your Career

    Practical skills are downright essential to landing investment banking job prospects. High-quality courses include:

    • Compliance & Anti-Money Laundering case studies
    • Mock trade settlement exercises
    • Ethical banking and risk assessments projects

    These modules allow you to develop a project portfolio, which really puts some oomph in your resume to try and attract employers.

    Job Roles You Can Pursue After Completion

    After graduating from a certified program, career opportunities in investment banking become more accessible to you. You can target:

    • Investment Banking Associate
    • Risk Management Consultant
    • Regulatory Reporting Analyst
    • Wealth Management Associate
    • KYC Analyst
    • Trade Surveillance Executive
    • Settlement/Collateral Analyst

    These are positions where global banks, financial institutions, and fintech firms converge, so you have the option of heading your investment banking career in any direction in the world.

    How CIBOP Gives You an Edge?

    India’s top investment banking opportunity is Imarticus’ CIBOP program, with a 85% placement rate and educated more than 50,000 students till date.

    Program Highlights:

    • 100% Job Guarantee
    • 7 Guaranteed Interviews
    • 3 and 6-Month Course Options
    • 60% Average Salary Increase
    • AML, Trade Lifecycle, and Compliance Projects
    • Industry expert certified course

    Looking to change companies or get into finance? This is the placement-backed investment banking course you’ve been looking for.

    FAQs

    1. How long should the ideal investment banking course last?

    3 months of course will be best for freshers to get early placement. If you want more exposure, go for a 6-month course.

    2. Will I be placed after enrolling in an investment banking course?

    If you go for a placement course in finance such as CIBOP, you’ll get guaranteed interviews and a 1000+ hiring partner network.

    3. What are the investment banking hottest job roles?

    Positions such as KYC Analyst, Regulatory Reporting Associate, and Wealth Management Executive are the cool jobs.

    4. What are the important skills needed for investment banking?

    Excel skills, trade lifecycle, risk management, and compliance are the cool skills in investment banking.

    5. Can I switch to investment banking without a finance background?

    Yes. The certification courses are specifically designed to bridge the knowledge gap and get you trained from scratch.

    6. Is CIBOP a better investment banking certification?

    With live projects, high placement ratio, and industry-focused syllabus, it is one of India’s most rated certifications.

    7. How much is average salary upon completion of the course?

    Graduates of CIBOP earn around 4 LPA on average on average with best offers up to 9 LPA.

    Conclusion

    The choice of best course length to spend on investment banking isn’t just about time—deliverables matter. The perfect course can give you the finest skills, industry exposure, and placements guaranteed to propel your finance career forward. With courses such as the CIBOP program of Imarticus Learning, you aren’t learning investment banking; you’re living it. If you’re able to cover the gap between aspiration and hard work, begin here—via the right certification, at the right moment.

    How Certifications Fast-track Investment Banking Careers?

    In today’s competitive finance environment, investment banking certification is not only a plus—it is essential to your career. With the markets of the world becoming more complicated and linked together, companies expect professionals not only to be theory-savvy but work-ready as well. From graduate to experienced finance professional who seeks career growth, the certification can be your ticket to opportunities and turbo-charged career development in the investment banking field.

    The right investment banking certification fills the gap between class and off-class experience, puts you in a better position in placement rounds, and makes you more likely to attain high-earning careers.

    investment banking certification

    Why Choose a Career in Investment Banking?

    Investment banking is the most lucrative of all the career choices available in the financial sector. With investment banking, there is high pay, access to global markets, and an opportunity to deal with high-weight clients for mergers, acquisitions, and capital raising transactions.

    As there is a larger need for professionals who possess knowledge of complex financial products and processes, never has the moment been better to seek finance career prospects.

    How Certification Impacts Investment Banking Job Prospects?

    A certification in investment banking ensures that you possess working specialist knowledge and functional knowledge. Placement agencies also shortlist certified candidates first before others during campus recruitments. The right course also helps you:

    • Receive respect from overseas employers
    • Gain knowledge about banking firm’s techniques and tools
    • Increase your chances of clearing interview stages

    A finance course with placement also assures employment, giving you a safe path on course completion.

    Top Skills Needed for Investment Banking

    Today, recruiters ask for more than the usual degrees. They would want the candidates to come along with technical as well as soft skills like:

    • Risk management
    • Trade settlement & compliance
    • Wealth & asset management
    • Anti-money laundering
    • Ethical banking practices

    Investment banking certification properly structured like CIBOP enables all of these to be developed.

    Exploring the Best Investment Banking Certification

    Certified Investment Banking Operations Professional (CIBOP) by Imarticus Learning is the most sought-after 0–3 years experience certification.

    Why CIBOP stands out:

    • 100% job guarantee
    • 7 interview guarantees
    • 1200+ batches completed
    • Avg. salary of ₹4 LPA
    • Highest paying salaries of ₹9 LPA and more
    • 1000+ placement partners

    It is the number one investment banking placement-ready certification.

    Placement Benefits of CIBOP by Imarticus

    One of the best things to keep in mind when choosing investment banking placement is that there is no other program that can replace a program that provides genuine placement. CIBOP assures:

    • Interview preparation & CV writing
    • Soft skills & domain knowledge
    • Career advice
    • Access to more than 1000 hiring partners 

    Since Imarticus wins Best Education Provider in Finance at 30th Elets World Education Summit 2024, you are being taught by the best.

    Career Roles You Can Target

    You can become a candidate for the following jobs through an investment banking certification:

    • Investment Banking Associate
    • Wealth Management Associate
    • Risk Management Consultant
    • Regulatory Reporting Analyst
    • Hedge Fund Associate
    • KYC Analyst
    • Client Onboarding Associate
    • Trade Surveillance Analyst

    These jobs are most likely to be targeted in Indian and international markets and give faster career growth.

    Real Industry Projects That Build Practical Skills

    Practice makes perfect. CIBOP uses a project-based method in which students tackle real cases like:

    • Trade-based money laundering
    • Compliance violations
    • Ethical banking conundrums
    • Real investment banking transactions

    These real projects hone skills and confidence—precisely what recruiters are seeking.

    Why Employers Priorities Certified Candidates

    Recruiters frequently use certifications to shortlist candidates with speed. A known investment banking certification indicates that:

    • You grasp intricate monetary systems
    • You’re trained in global standards
    • You are ready to contribute from Day 1

    Moreover, it also increases your visibility to employers who are actively hiring for critical roles in finance.

    Is Investment Banking Right for You?

    If analytical thinking, acuteness to details, and interest in financial matters are your forte, this profession is your sure-shot ticket. This job is not the sole preserve of crème de la crème IIT/IIM passouts. Even freshers with proper certification can start this profession.

    Whether you wish to specialise in finance career positions in India or go abroad from India to the international market, CIBOP equips you with the knowledge and the skill set to do so.

    FAQs

    1. What is the average salary after completing CIBOP?

    Average salary is ₹4 LPA, and the highest salary is around ₹9 LPA depending on experience and performance.

    2. Is the certification recognised by employers?

    Yes. Imarticus Learning is a 1000+ hiring partner finance education brand with high credibility.

    3. Do I need finance experience before enrolling?

    No, the course is for freshers as well as early professionals with 0–3 years of experience.

    4. What kind of roles can I apply for after this certification?

    Job roles are KYC Analyst, Investment Banking Associate, Client Onboarding Analyst, etc.

    5. What is the duration of the course?

    You have 3-month or 6-month plans, as required.

    6. Are the interviews guaranteed?
    Yes. You will be guaranteed 7 interviews on course completion.

    7. How does the CIBOP course compare to an MBA?

    CIBOP is niche, to-the-point, up-to-date, and industry-specific—best suited for faster placement than a generic MBA.

    Conclusion

    Your investment banking career can be made easier with proper certification. Imarticus’s CIBOP program is not merely an investment banking certification, but a career platform offering placement assistance, live projects, and interaction with best-in-class employers.

    In a saturated job market, make sure that you are the one who gets attention—either because of the right certification, skills, or platform.

    Tableau for Beginners: Important Features You Should Know

    Table of Contents

    • Introduction to Tableau Software
    • Key Features of Tableau
    • Tableau Beginner Guide: Getting Started
    • Tableau Data Visualisation Tools Described
    • Tableau Dashboard Elements for Beginners
    • Tableau Training for Beginners: How to Study Effectively
    • Key Takeaways
    • Conclusion
    • FAQs

    Begin your journey through Tableau for Beginners with a sense of overwhelm, and I promise you, you’re not on your own. If you’ve played around with spreadsheets or have no experience at all with data, learning Tableau can lead you into a whole new world of data visualisation and analytics possibilities. It’s made to simplify complex data so that it appears simple, actionable, and, I know I’m being cheeky here, even beautiful.

    In the data-driven world we live in today, organisations are hungry for people who are not just able to interpret data but to effectively communicate it as well. That’s where Tableau for Beginners comes in—equipping you to take raw numbers and turn them into visual stories that lead to action. In this blog, we’ll demystify everything you want to know, including must-know features, tools, dashboards, and training advice so you can use Tableau with confidence.

    Tableau for Beginners

    Introduction to Tableau Software

    If you are starting out, it is important to know about the Introduction to Tableau Software. Tableau is a top data visualisation platform that allows individuals and companies to analyse, visualise, and share insights from their data without the need for extensive technical knowledge. It converts bulky datasets into interactive dashboards, charts, and graphs.

    Tableau was established in 2003 & has become a world leader in data visualisation. Its user-friendly interface and robust analytics features ensure that both – beginners and experts use it. Even users with little coding expertise can develop professional-grade dashboards using Tableau for Beginners.

    Here’s a brief comparison of Tableau with other well-known tools:

    FeatureTableauExcelPower BI
    User-FriendlyHighly intuitiveModerateBeginner-friendly
    Data VisualisationAdvancedBasicGood
    Real-time AnalyticsYesLimitedYes
    IntegrationExtensiveModerateStrong

    If you are wondering where Tableau stands in the world, take a look at Gartner’s latest BI Magic Quadrant where Tableau still remains a leader. 

    Tableau’s Key Features

    Before jumping into building dashboards, it’s important to understand the Key Features of Tableau. Tableau has established itself as a platform that focuses on making data accessible and clearer for all users from business users through to data scientist. 

    For many, one of the coolest features is the ability to connect to virtually any data source. Whether its Excel, SQL databases, cloud platforms, or even data from the web, Tableau has made the connections as easy as they can be. This means that as a beginner, you’re not limited by your data format or storage location.

    Key Features of Tableau include:

    • Drag-and-Drop Interface: Build visualisations quickly without coding.
    • Real-Time Data Analysis: Dashboards based on the flow of live data.
    • Data Blending: Mix data from different sources to combine analyses.
    • Collaboration: Share interactive dashboards with others.
    • Mobile Accessibility: Access your dashboards anywhere, anytime.
    • Extensive Integration: Can integrate with cloud platforms such as AWS, Google Cloud, and Microsoft Azure.
    • Interactive Visuals: Engage stakeholders by using interactive charts and dashboards.
    • Strong Security Controls: Comes with solid, enterprise-level security features for protecting your data.

    Want to dive deeper into the increasing need for data visualisation? Read this Forbes article on data storytelling.

    Tableau Beginner Guide: Getting Started

    Starting your Tableau adventure? This Tableau Beginner Guide chapter is for you. Tableau is a data visualization tool that is very rewarding but also very daunting to learn. It is visual and user-friendly. Hence, should not be considered a direct technical tool.

    Needless to say, the next stop for anything Trending The Tableau Way for Beginners comes with installing either Tableau Public or Desktop. Tableau Public is free & hence the best tool for getting a hold of practicing, while Tableau Desktop comes with more advanced capabilities aimed at professionals.

    Here’s a quick step by step for beginners:

    • Download and install Tableau Public or Tableau Desktop.
    • Connect to your data source (Excel, CSV, Google Sheets, etc.).
    • Get to know the interface (sheets, dashboards, and workbooks).
    • Use drag-and-drop to create basic charts.
    • Try out various visualisation options.
    • Publish and share your dashboards.
    • Practice regularly using sample datasets.
    • For real-world use cases and inspiration, check out the Tableau Public Gallery.

    Tableau Data Visualisation Tools Explained

    Knowledge of Tableau Data Visualisation Tools is essential to telling stories using data. Tableau provides a wide range of tools aimed at facilitating users to create informative and interactive visualizations of data.

    The best aspect of these tools is that they are easy to use and flexible. Be it making a basic bar chart or an interactive map, Tableau for Beginners provides you with the tools to convert raw data into useful interpretations.

    Popular Tableau visualization tools are:

    • Bar and Column Charts: Ideal for making comparisons between categories.
    • Line Graphs: Best used to monitor trends over time.
    • Pie Charts and Donut Charts: Ideal for displaying proportions.
    • Maps: Visualize geographic data easily.
    • Heat Maps: Show areas of high data density or performance.
    • Scatter Plots: Determine variable relationships.
    • Treemaps: Best for hierarchical data representation.

    The versatility of these tools allows Tableau to suit both beginners and advanced users.

    Tableau Dashboard Features for Beginners

    If you’re a beginner working with Tableau.. getting acquainted with the Tableau Dashboard Features will be an essential part of developing interactive & informative reports. Dashboards contain a combination of -visualizations and filters in one view—an entire view of your data.

    Beginner Tableau Dashboard Features mean that even if you’re new to data, you can build dashboards just as fantastic as anyone in a professional role to obtain useful insights.

    Basic dashboard features are:

    • Interactive Filters: Enable users to drill down into certain data.
    • Dynamic Tooltips: Provide extra information on hover.
    • Parameter Controls: Add interactivity for advanced analysis.
    • Device Preview: Ensure dashboards are mobile-friendly.
    • Custom Layouts: Arrange visualisations to fit business needs.
    • Actions: Enable navigation between dashboards or external links.
    • Highlighting: Emphasise key data points.

    Mastering these dashboard features enhances your ability to communicate data effectively.

    Tableau Training for Beginners: How to Learn Effectively

    In learning Tableau for Beginners, guided learning is essential. Fortunately, there are no leanings in finding resources to enable you to learn Tableau effectively, be it your background.

    Beginner Tableau Training can be anything from self-directed tutorials to instructor-training courses. Choosing the perfect training method guarantees a seamless, incremental learning curve.

    Learning methods recommended are:

    • Official Tableau Learning Materials: Try out Tableau’s own tutorials and guides.
    • Webinars: Sign up for comprehensive courses on platforms like the Postgraduate Program in Data Science & Analytics by Imarticus Learning for a publicly available Tableau course. 
    • YouTube Tutorials: Great for short tips and experiences.
    • Online Communities: Reach out to fellow students for course lockdown.
    • Practice using publicly available data sets: Get your hands dirty with real data sets. 

    Tableau for Beginners aint so daunting with a little practice and a little organization!

    Key Takeaways

    • Tableau for Beginners makes data visualisation easy for all.
    • Introduction to Tableau Software emphasizes its intuitive, robust design. 
    • Learning the Key Features of Tableau is required for utilizing it with confidence. 
    • Tableau Beginner Guide offers a clear beginning point.
    • Discover various Tableau Data Visualisation Tools to make vivid visuals. 
    • Tableau Dashboard Features for Beginners open up interactive insights. 
    • Explore Tableau Training for Beginners to speed up your learning process. 

    Conclusion

    To be a Master of Tableau for Beginners is not about possessing sophisticated technical expertise—it’s being curious and practicing. With its easy-to-use interface, multiform visualisation tools, and heavy-duty dashboard capabilities, Tableau gives anyone the ability to transform raw data into compelling narratives.

    If you are looking to advance your skills, join the Postgraduate Program in Data Science & Analytics by Imarticus Learning. With industry-expert guided training, project work, and placement support, it’s your key to job-readiness in data analytics and Tableau.

    FAQs

    1. What is Tableau used for?

     It is a robust data visualisation tool that -transforms raw data into interactive and visually engaging dashboards and reports to enable organisations in making informed decisions. 

    2. Is Tableau good for beginners?

    Sure it is! Tableau for Beginners is designed to have user-friendly interfaces along with intuitive drag-and-drop features.. so even someone without any technical background can use it. 

    3. Do I need coding skills to use Tableau?

    No, you don’t require any coding skills. Tableau’s interface works on visuals or drag-and-drop actions where anyone can simply drag and drop to create charts and dashboards. 

    4. What are the main features of Tableau?

     Key Features of Tableau include: real-time analytics, interactive dashboards, data blending from different sources, mobile access & security.

    5. How long to become proficient in Tableau?

    Mastering Tableau fundamentals may take a few weeks of consistent use, particularly with organised material such as Tableau Training for Beginners.

    6. Is Tableau free?

     Yes, there is a Tableau Public version that allows practice and publishing your work online and is great for individuals using the Tableau Beginner Guide.

    7. What visualisations can Tableau do?

    Tableau Data Visualisation Tools enable users to -design bar charts, line graphs, maps, heatmaps, scatter plots, treemaps & more.

    8. How do Tableau dashboards function?

     Tableau Dashboard Features for Beginners make it possible to – merge several charts, filters, and interactive elements into a single cohesive, easy-to-use view.

    9. Is Tableau popular?

     Yes – Tableau skills are highly demanded, as data visualisation and analytics are indispensable in today’s business decision-making.

    10. How can I learn Tableau effectively?

    Look at structured learning opportunities such as the Postgraduate Program in Data Science & Analytics by Imarticus Learning to get complete, industry-suitable Tableau training.

    Power BI vs Excel: Which Should You Choose?

    Excel was the standard default spreadsheet, financial reporting, and analysis for years. Small businesses and multibillion-dollar enterprises used Excel to take a look at the numbers, create pivot tables, and drill down. But as real-time visibility, automation, and intelligent visualisation become more and more sought after, companies will be asking themselves this: Is Excel enough, or do you use Power BI?

    That is when the battle of Excel and Power BI starts. Excel is office software and handy tool but, prior to Power BI becoming the top business intelligence software to deliver affordable data analysis program. Excel vs Power BI data proves helpful to businesses, analysts, and accounting professionals looking for informed decisions.

    In this blog, we’ll break down the Power BI advantages, the Excel limitations, and how both tools can complement each other. By the end, you’ll know exactly when Excel is sufficient, and when it’s time to adopt Power BI for your reporting and analysis needs.

    What is Excel?

    Excel is a spreadsheet application developed by Microsoft that allows users to organise, analyse, and visualise data. It is widely used for:

    • Data entry and basic arithmetic.
    • Accounting modeling and forecasting.
    • Conditional formatting and pivot tables.
    • Basic charting and visualisation.
    • VBA automation and formula specificity.

    Even being really old many decades ago, Excel remains a data analysis computer program standard, finance and accounting especially.

    What is Power BI?

    Power BI is a business application, making use of artificial intelligence to create interactive dashboards, real-time reports, and high-level data visualisation. Power BI is not Excel—Power BI is able to connect to an enormous amount of data sources, sift through and get the data organised, and has one location to report from.

    The top things about Power BI are:

    • High-level interactive dashboard and data visualisation.
    • Integration of database, cloud, and APIs in an integrated way.
    • Automatic refresh and update in real time.
    • Natural language query (Ask a question about your data).
    • Collaboration and sharing with Power BI Service.

    Excel vs Power BI: The Key Differences

    For instance, when comparing Excel to Power BI, it is easy to compare them head to head on large features:

    FeatureExcelPower BI
    Data CapacityHandles up to ~1M rows efficientlyHandles millions of rows, optimised for big data
    VisualizationLimited charts and graphsRich, interactive dashboards and visuals
    AutomationFormulas, macros, VBAAutomatic refresh, real-time updates
    CollaborationFile-sharing, version issuesCentralised dashboards, easy collaboration
    Data SourcesPrimarily spreadsheets and CSVs100+ sources (databases, APIs, cloud)
    Learning CurveFamiliar for most professionalsRequires learning new BI concepts
    CostOne-time license or Office 365Subscription-based model

    Excel Limitations

    Even still a mass-market tool, Excel has some limitations that restrict its use for broad-scale or modern analytics:

    • Data Volume Issues – Excel struggles with big data (more than a few hundred thousand rows).
    • Reporting Issues – The reports are snapshots of updates that aren’t automatically logged.
    • Collaboration Issues – Version control issues occur where many users are modifying a file.
    • Visualisation Weaknesses – The charts are two-dimensional and less interactive than Power BI.
    • Incorrect – Human error and handwriting during formulas provide space for an astronomic number of errors.

    Solutions to such Excel problems are the imperative for most companies to utilize business intelligence tools like Power BI.

    You can grab insightful information about trading and financial modeling from this video- Trading to Financial Modeling Pro: Ramit’s PGFAP Story | Postgraduate Financial Analysis Program

    Power BI Advantages

    With Power BI comes a combination of benefits:

    1. Scaling – Plays along fine with millions of rows.
    2. Real-Time Dashboards – Can refresh automatically from multiple sources.
    3. Data Connectivity – Boasts SQL, Azure, Google Analytics, APIs, and so much more.
    4. Collaboration – Several teams can collaborate and draw off of a live dashboard from a source of truth.
    5. Advanced Analytics – AI-driven insights, natural language search, and predictive modeling.
    6. Professional Vizuals – Business-confronting dashboards with large visualisations to drive decision making.

    These are the Power BI benefits that make Power BI the business application of today for data-driven solutions.

    Power BI vs Excel: When to Use Each

    When to Use Excel:

    • Small datasets.
    • Ad-hoc reporting and quick calculations.
    • Formula-driven financial modeling.
    • Offline, single-person reporting.

    When to Use Power BI:

    • Large, complex datasets.
    • Requirements for real-time reporting.
    • Company-level and sharing dashboards.
    • Consolidated reporting across multiple datasets.

    They use both applications horizontally: Excel to perform the computation and modeling and Power BI to share and visualise.

    Power BI vs Excel in Finance

    Accounting experts are curious about the Excel vs Power BI issue. Excel takes the win in modeling and financial forecasting, while Power BI takes the win in visualisation and publication. For example:

    • Excel: Create a discounted cash flow model.
    • Power BI: Creating a dashboard that gives the company stakeholders real-time performance.

    Financial experts who are familiar with both software thus enjoy a mammoth competitive edge.

    The Future of Data Analysis Tools

    With business online, data analysis software improves. Excel shall forever be cool, but it’s inevitable the trend for business intelligence software like Power BI sets in. Businesses need software that:

    • Manages huge volumes of data.
    • Auto-mates routine operations.
    • Provide real-time insights.
    • Make it easier to collaborate.

    And lets Excel struggle to stay hip in a sloppy way, though Power BI and others shall be the greatest genius on the newest analytics fad.

    Building Your Career with Power BI and Excel

    Power BI and Excel form a part of the toolkit for analysts and finance alumni. The job candidates possessing specialist experiential expertise in tools of business intelligence coupled with general know-how with Excel are bound to be the blue-eyed boy or blue-eyed girl of the recruiters.

    And here is where approved courses of study come into the picture.

    Postgraduate Financial Analysis Program: Gain Data & Finance Expertise

    Imarticus Learning’s Postgraduate Financial Analysis Program educates finance graduates with traditional as well as modern skills.

    Why Join This Program?

    • 100% Job Guarantee with 7 guaranteed interviews.
    • 56,000+ placements and 500+ hirers. 
    • Awards & Recognition: Recipient of Best Education Provider in Finance at the 30th Elets World Education Summit 2024.
    • 60% average salary increment for career changers.

    Skills You’ll Learn:

    • Advanced Excel for financial modelling.
    • Power BI and other business intelligence tools.
    • Financial analysis, valuation, and equity analysis.
    • Transactional skill, corporate finance.

    Learning Approach:

    • Live case class simulations and case studies.
    • Data analytics tool-based hands-on projects.
    • Personal branding and LinkedIn optimization.
    • Guidance by industry experts.

    These are the skills that can be utilized in order to secure a job in a position like FP&A Analyst, Investment Banking Analyst, Equity Research Analyst, Treasury Analyst, Corporate Development Analyst, and Private Equity Analyst.

    FAQs on Power BI vs Excel

    Q1. Why isn’t Power BI Excel?

    Power BI is an interactive business intelligence data visualization and Excel is a calculation and modeling spreadsheet.

    Q2. Is Power BI replacing Excel?

    No, Excel is the low-level king of reporting and modeling but Power BI is the new king of new dashboards and real-time analytics.

    Q3. Will Power BI replace Excel?

    Not really. Offline calculation, intricate equations, modeling – there can be no replacement for Excel. Power BI is built on top of Excel and not a replacement.

    Q4. Where are the areas where Excel falls behind Power BI?

    Excel lacks big data, collaboration, and where live updates are concerned, Power BI does it very conveniently.

    Q5. What are the advantages of Power BI over Excel?

    More scalable, collaborative, interlinked data, automation, and improved visualization.

    Q6. Difficult to learn?

    No, particularly for users of Excel. Business users can be trained such that transition becomes less painful with training.

    Q7. Finance professionals: Power BI or Excel preferred?

    Both. Modelling in Excel and reporting/visualisation in Power BI.

    Q8. More costly than Excel?

    Power BI is subscription-paid but Excel is included as part of Microsoft Office subscriptions. Business requirement decides the difference.

    Q9. Too much to use Excel and Power BI?

    Yes, Power BI can import Excel data with the aim to deliver visualization and dashboards.

    Q10. Professional upskilling in Power BI and Excel?

    With formal education such as Postgraduate Financial Analysis Program, with placement assurance and Excel and Power BI training.

    Conclusion

    The argument wasn’t Excel vs Power BI is better but who does it better. Excel is preferable to do it when there is a need for model building, quick analysis, and off-line calculation. When there is a need for real-time reporting, collaboration, and advanced data visualization, Power BI is better.

    For the finance professional, it’s better to be proficient in both tools. Excel is core competency, and Power BI skills are future analytics skills. With programs like the Postgraduate Financial Analysis Program, you learn-by-doing with both data analysis packages and get ready for high-growth finance and analytics careers.