


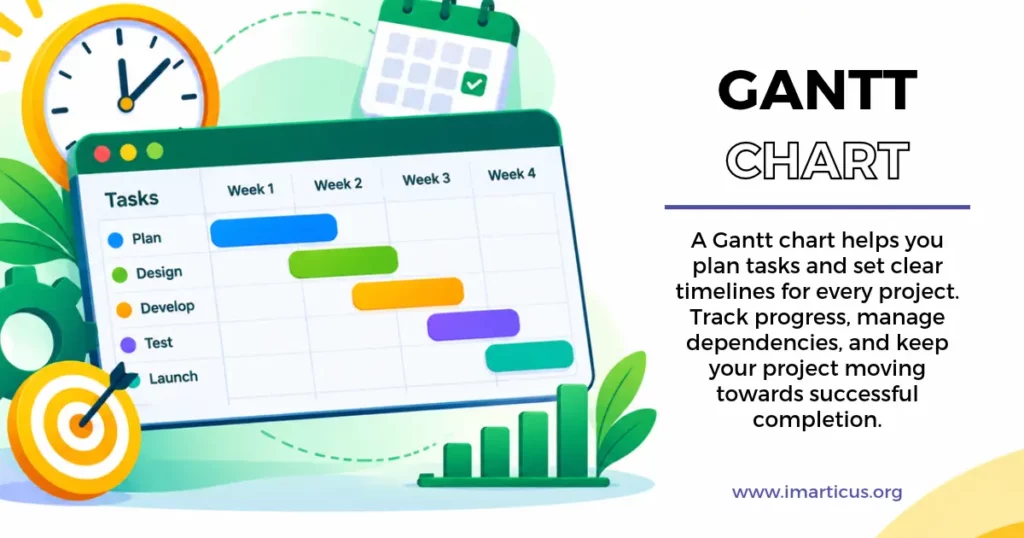
A Gantt chart is a horizontal bar chart that shows a project schedule on a timeline. Each task appears as a bar, and the length and position of the bar show when the task starts, how long it runs and when it finishes. In project management, a Gantt chart is used for planning work, assigning owners, tracking progress, showing task dependencies and sharing the plan with stakeholders in one clear view. You can build a Gantt chart in Excel, start from a ready Gantt chart template, or use a Gantt chart maker such as Microsoft Project, Jira, Trello or Asana. The key elements are tasks, dates, duration, milestones, dependencies, progress and owners, and together they turn a long task list into a visual roadmap.
I have planned projects with sticky notes, long email threads and plain task lists, and the one thing that made everything click was a Gantt chart. The first time I put my tasks on a timeline, I could see the whole project on one page: who was doing what, which work could run side by side and where the next deadline was waiting. That clarity is the reason project managers, engineers, marketers and event teams all keep a Gantt chart close at hand.
In this blog, I will take you through the Gantt chart meaning, how it works in project management, the key elements of a Gantt chart diagram and a practical Gantt chart example. I will also show you how to make one in Excel, where to find a Gantt chart template and which Gantt chart maker suits different teams. If you want to learn these planning skills with mentors and a real project, the Project Management Prodegree Course from Imarticus Learning is a great place to start.
Gantt Chart Meaning
A project plan is easier to follow when you can see it. The Gantt chart meaning comes down to exactly that idea: a visual schedule where time runs from left to right and every task gets its own bar. Let me break it down in simple steps.
Don’t Let Our Best Advice Get Buried
Add Imarticus as a Preferred Source — see more of what we publish, every time you search.

Gantt Chart Definition
If you have ever typed what is a Gantt chart into a search bar, the answer is short and friendly. A Gantt chart is a horizontal bar chart used to plan and track tasks over time. The task names sit on the left, the calendar runs across the top, and each bar stretches from the planned start date to the planned finish date.
Because the bars sit on one shared timeline, you can spot overlaps, gaps and hand-offs at a glance. Many people also search “what is gantt chart” when they join a new team, since project managers mention it in almost every planning meeting. Once you see one, the idea stays with you.
Origin of the Gantt Chart
The chart is named after Henry Gantt, an American mechanical engineer and management consultant who popularised it in the early 1900s. Factories and large construction projects were among the first to use it, because it made long schedules easy to read. Today the same bar layout lives inside Excel sheets, project software and online planning boards.
Knowing the meaning and the background gives you a solid base. From here, we can look at how a Gantt chart in project management works day to day.
Did You Know?
Henry Gantt’s bar-style schedule is more than a century old, yet it still sits at the heart of modern planning software. (Source)
Gantt Chart in Project Management
In my experience, a project feels lighter the moment its schedule is visible to everyone. A Gantt chart in project management gives the team, the sponsor and the client one shared picture of the plan, so conversations become short and clear. Here is how the chart supports each stage of a project.
| Project stage | How the Gantt chart helps |
| Initiation | Shows the overall timeline and major milestones for approval |
| Planning | Breaks the scope into tasks, durations and dependencies |
| Execution | Helps managers assign owners and balance workloads across the weeks |
| Monitoring | Compares planned bars with actual progress to keep the schedule on course |
| Closure | Records what was delivered and when, which supports reviews and lessons learned |
Across all five stages, the chart works as a single source of truth for the schedule. Everyone looks at the same bars, so updates travel faster and decisions come sooner.
Gantt Chart and Work Breakdown Structure
A Gantt chart pairs naturally with a work breakdown structure, often called a WBS. The WBS divides the project into smaller deliverables, and the Gantt chart places each of them on the calendar. When you add dependencies, you can also see the critical path, which is the chain of tasks that sets the earliest finish date.
Project managers use that view to decide where their attention is needed first. That is why a Gantt chart sits at the centre of planning in construction, software, marketing and many other fields.
Best Gantt Chart
Maker Tools
A Gantt chart maker turns your task list into a chart in a few clicks and updates it as plans change. The right tool depends on the size of your team and the type of work you manage.
📅 Project Timeline
Key Elements
of a Gantt Chart
These elements turn a long task list into a clear visual roadmap.
Best Gantt Chart Maker Tools
The right tool depends on the size of your team and the type of work you manage.
Excel or Google Sheets
Best for: Individuals and small projects.
Free layouts, simple formulas and easy sharing.
Microsoft Project
Best for: Detailed scheduling.
Dedicated Gantt view, dependencies and resource planning.
Jira
Best for: Software teams.
Timeline and planning views for epics, releases and dependencies.
Trello
Best for: Visual task boards.
Timeline view that places cards on a calendar.
Asana
Best for: Cross-team projects.
Timeline view that links tasks and owners.
ClickUp
Best for: All-in-one workspaces.
Gantt view with dependencies and progress tracking.
AI Assistants
Best for: First drafts.
Task lists, durations and schedule tables you can paste into a chart.
Plan Smarter. Work Better.
Use the right Gantt chart tool and keep your projects on track — from planning to launch.
Gantt Chart Diagram and Its Elements
A Gantt chart diagram may look simple, yet every part of it has a clear job. Knowing the seven key elements helps you read any chart quickly and build your own with confidence.
| Element | What it shows | Example |
| Task list | Every activity in the project, listed down the left side | Design the homepage |
| Timeline | The calendar scale across the top, in days, weeks or months | Week 1 to Week 8 |
| Task bars | Start date, duration and finish date for each task | A bar that spans two weeks |
| Milestones | Key checkpoints, usually shown as small diamonds | Client approval |
| Dependencies | Links that show which task must start or finish before another | Testing begins after development |
| Progress indicator | A shaded part of the bar that shows how much is complete | 60 per cent done |
| Resources or owners | The person or team responsible for the task | Design team |
When these seven elements work together, your Gantt chart diagram answers three questions straight away: what needs doing, when it needs doing and who is doing it. Many charts also add a vertical line for today’s date, which makes progress easy to read in a review meeting.
Uses of Gantt Chart
A Gantt chart is used for much more than drawing neat bars. It is a planning, tracking and communication tool that adapts to almost any kind of work, from a college project to a large construction programme. Here are the most common reasons teams reach for it:
- Planning the schedule of a project from start to finish
- Allocating people and equipment across the weeks
- Tracking progress against the original plan
- Sharing a clear timeline with clients, managers and team members
Different industries use the chart in their own way, and the table below shows a few popular ones.
| Industry | Typical use of a Gantt chart |
| Construction | Sequencing site work, material deliveries and inspections |
| Software development | Planning releases, testing windows and feature rollouts |
| Marketing | Scheduling campaign stages, content calendars and launches |
| Event planning | Lining up vendors, bookings and rehearsals before the event day |
| Manufacturing | Coordinating production runs and equipment availability |
| Education and research | Mapping study plans, lab work and submission dates |
Whatever the field, the idea stays the same: put the work on a timeline and let everyone see it. That simple habit keeps teams aligned from the first day to the last.
Also Read: Essential Skills Required to Become a Successful Project Manager
Gantt Chart Example
Nothing explains a Gantt chart better than a worked example. Let me use a website launch plan that runs for eight weeks with a small team of five people.
| Task | Owner | W1 | W2 | W3 | W4 | W5 | W6 | W7 | W8 |
| Requirements | Project manager | ■ | |||||||
| Design | Designer | ■ | ■ | ||||||
| Content writing | Content writer | ■ | ■ | ■ | |||||
| Development | Developer | ■ | ■ | ■ | |||||
| Testing | QA analyst | ■ | ■ | ||||||
| Launch | Project manager | ■ |
Here is how to read this Gantt chart example:
- Design and content writing run together in weeks two and three, which saves a full week.
- Development begins in week four, right after design is complete, so that dependency is easy to see.
- Testing overlaps with the last week of development, which gives the team early feedback.
- The launch in week eight acts as the final milestone for the whole plan.
With a chart like this, the project manager can answer a client’s question about timing in a few seconds. The same layout works for a product release, a marketing campaign or a college event.
How to Create a Gantt Chart
Building a Gantt chart is easier than it looks. I follow the same seven steps for almost every project, and they work whether you use paper, Excel or a Gantt chart maker.
- List all the tasks. Write down every activity needed to deliver the project, ideally from a work breakdown structure.
- Estimate the duration. Give each task a realistic number of days or weeks, using past projects as a guide.
- Set the start dates. Decide when each task can begin, keeping your team’s availability in mind.
- Link the dependencies. Mark which tasks must finish before others can start, so the order of work is clear.
- Assign owners. Name one person or team for every task so that responsibility is visible.
- Add milestones. Place checkpoints such as design approval, testing sign-off and launch day.
- Review and update. Compare the bars with real progress every week and adjust the plan as the project moves.
Once these steps are done, you have a living plan that guides the team from day one. A weekly review keeps the chart accurate and keeps everyone confident about the next deadline.
Gantt Chart in Excel
Excel is the first place most people build a schedule, and it works well for a first Gantt chart in Excel. You need only a table of tasks and dates, and Excel does the rest. Let me walk you through the two popular methods and a ready-made option.
Gantt Chart Excel Method with a Stacked Bar Chart
This method gives you a clean chart that is perfect for presentations.
- Create a table with three columns: Task, Start Date and Duration in days.
- Select the Task and Start Date columns, go to Insert and choose a Stacked Bar chart.
- Right-click the chart, choose Select Data and add Duration as a second series.
- Click the Start Date bars and set the fill to No Fill, so only the duration bars remain visible.
- Select the vertical axis and tick Categories in Reverse Order, so the first task sits at the top.
- Set the horizontal axis minimum to your project start date, then adjust colours and add data labels.
Gantt Chart Excel Method with Conditional Formatting
This method is great when you want the bars to move automatically as dates change. Place the task names in column A, the start date in column B and the end date in column C. Then write the calendar dates across row 1, starting from column D.
Select the grid under the dates, open Conditional Formatting and create a new rule using a formula. For the first row of tasks, you can use this formula: =AND(D1>=B2,D1<=C2). Pick a fill colour, and every cell that falls between the start and end dates turns into a bar.
Ready-Made Gantt Template in Excel
Excel also includes a Gantt project planner in its template gallery. Open File, choose New and search for Gantt. You can type your tasks and dates, and the bars appear on their own.
| Method | Best for | Effort |
| Stacked bar chart | Clean charts for presentations | Medium |
| Conditional formatting | Day-by-day schedules that update with the dates | Medium |
| Built-in template | A quick start with a ready layout | Low |
All three methods are a good way to learn how a Gantt chart Excel setup works. Once you are comfortable, you can move to a dedicated tool for larger projects.
Also Read: Top Tools for Effective Project Management
Gantt Chart Template
A good template saves hours. Instead of designing columns and colours from scratch, you fill in your tasks and the plan takes shape. I keep a few Gantt chart template files ready for the type of projects I handle most often. Here is what a strong template usually includes:
| Template column | Purpose |
| Task name | Describes the activity clearly |
| Owner | Shows who is responsible |
| Start date and end date | Sets the schedule window |
| Duration | Calculates the working days |
| Predecessor | Links the task to the one before it |
| Progress per cent | Tracks how much is complete |
| Notes | Holds comments and links |
You can find a Gantt chart template in several places. Excel and Google Sheets both offer free layouts, and project tools such as Microsoft Project, Asana and ClickUp include their own. You will also find versions for campaigns, product launches and events. Pick the one that matches your work and adjust the columns to suit your team, so the chart stays easy to read and easy to share.
Best Gantt Chart Maker Tools
A Gantt chart maker turns your task list into a chart in a few clicks and updates it as plans change. The right tool depends on the size of your team and the type of work you manage.
| Tool | Best for | What it offers |
| Excel or Google Sheets | Individuals and small projects | Free layouts, simple formulas and easy sharing |
| Microsoft Project | Detailed scheduling | A dedicated Gantt view with dependencies and resource planning |
| Jira | Software teams | Timeline and planning views for epics, releases and dependencies |
| Trello | Visual task boards | Timeline view that places cards on a calendar |
| Asana | Cross-team projects | Timeline view that links tasks and owners |
| ClickUp | All-in-one workspaces | A Gantt view with dependencies and progress tracking |
| AI assistants | First drafts | Task lists, durations and schedule tables you can paste into a chart |
When choosing a Gantt chart maker, think about how many people will update the chart, whether you need dependencies, and how often you share it with clients. Many professionals use a mix, starting in Excel and moving to a dedicated tool as projects grow.
Benefits of Gantt Chart
Teams keep coming back to this chart because it makes planning feel simple and rewarding. Here are the benefits I have seen most often:
- Clear visibility. The whole project fits on one page, so everyone knows what is happening and when.
- Better time management. Durations and deadlines sit side by side, which makes it easy to plan realistic schedules.
- Smarter resource planning. Managers can see who is busy in which week and share the workload evenly.
- Confident reporting. Progress shading gives stakeholders a quick update without a long meeting.
- Faster decisions. When priorities change, you can move a bar and see the effect on the finish date straight away.
These benefits add up quickly across a project, and an easy-to-read chart encourages the team to keep it updated.
Gantt Chart and Agile Teams
Many learners ask me whether a Gantt chart fits with agile work. It does, and it is a lovely way to combine structure with flexibility. The chart began in traditional planning, and agile teams now use its timeline view in creative ways.
- Product teams build release roadmaps that show major features across quarters.
- Scrum teams place sprint dates and milestones on a timeline for stakeholders.
- Hybrid teams plan hardware or compliance work with a Gantt chart and run software work in sprints.
This blend gives leaders a long-range view while teams keep their sprint rhythm. If you would like to understand how agile frameworks work, you can read our guide to Scrum methodology as a companion to this blog.
Future of Gantt Chart with AI
The Gantt chart is growing along with new technology. AI features in project tools can now suggest task lists, estimate durations from past projects and highlight dependencies that deserve attention. Teams can generate a first schedule in minutes and spend their time on decisions and people.
Professionals who understand the logic behind the chart are best placed to get the most from these tools, which makes learning the fundamentals a smart investment.
Also Read: A Beginner’s Handbook to Agile Project Management
Why Choose Imarticus Learning for Project Management
If you enjoy planning and want to turn it into a career, the right learning path makes a big difference. The Project Management Prodegree Course from Imarticus Learning, in knowledge partnership with PwC India, is built around real project skills, including the scheduling methods behind every Gantt chart.
| What you get | How it helps you |
| PwC Academy advantage | Interactive masterclasses with real-world case studies |
| Industry tools | Hands-on practice with Jira, Confluence, Trello, Asana, Microsoft Project and ClickUp |
| AI in project management | Learn to forecast timelines, plan resources and automate reports with AI tools |
| Complete curriculum | Agile, Waterfall, Hybrid and Lean Six Sigma, including work breakdown structures, scheduling and schedule baselines |
| PMP preparation | 35 PDUs for the PMP certification application |
| Your project, our mentorship | Build a project from your own life or work with expert guidance |
| Certificate | A project management certificate jointly awarded by Imarticus Learning and PwC Academy |
| Flexible format | 4 months of learning with 100 hours of online live classes |
| Career visibility | A 6-month pro membership to iimjobs for premium job openings |
The programme suits aspiring project managers, working professionals, career switchers and recent graduates. Whether you want to lead a team or manage your own projects with more confidence, this course gives you the skills and the practice to begin.
FAQs About Gantt Chart
Here are quick, clear answers to the frequently asked questions learners ask me most often about this planning tool. Each answer is short, so you can pick up the idea fast and move on to building your own chart with confidence.
What is a Gantt chart used for?
A Gantt chart is used for planning project schedules, tracking progress and showing task dependencies on one timeline. Teams also use it to share deadlines, balance workloads and keep stakeholders updated.
Can I do Gantt charts in Excel?
Yes, you can. A stacked bar chart, conditional formatting or the built-in Gantt template in Excel all work well. Once your tasks and dates are listed, a chart takes only a few minutes.
What are the 7 important elements of a Gantt chart?
The seven elements are the task list, timeline, task bars, milestones, dependencies, progress indicators and resource owners. Together they show what needs doing, when it happens and who is responsible.
Can ChatGPT create a Gantt chart?
Yes, it can help a lot. ChatGPT can draft your task list, estimate durations and produce a schedule table, which you can paste into Excel or a Gantt chart maker to create the bars. Review the dates so they fit your project.
Can Jira create Gantt charts?
Yes. Jira offers Timeline and planning views that work like a Gantt chart, and Marketplace apps add classic Gantt views. Teams use them to map epics, releases and dependencies.
How can I prepare a Gantt chart?
List your tasks, estimate durations, set start dates, link dependencies, assign owners and add milestones. Then plot everything in Excel or a Gantt chart maker and review it every week.
Is the Gantt chart agile?
A Gantt chart began in traditional planning, and agile teams now use its timeline view for roadmaps, releases and sprint milestones. Hybrid teams combine both styles, so the chart fits well with agile work.
Plan Smarter and Deliver with Confidence Using a Gantt Chart
A Gantt chart takes a busy project and turns it into a picture everyone can follow. We started with the Gantt chart meaning, saw how it works in project management, explored its seven elements and walked through an example. Along the way, you learned how to build one in Excel, where to find a template and how to choose a maker that suits your team.
What I love most about this chart is how friendly it is. You can begin with a simple table today, share it with your team tomorrow and watch conversations about deadlines become easier. If you are ready to turn this skill into a career, the Project Management Prodegree Course from Imarticus Learning gives you the methods, the tools and the mentorship to lead projects with confidence. Start planning your next project with a Gantt chart, and enjoy the clarity it brings.
Liked This? Follow Us Where You Already Search.
Preferred Sources is Google’s built-in follow button — no app, no login, just more Imarticus in your results.