Visualisation of Multivariate Data

Multivariate data visualisation is an invaluable instrument for illuminating convoluted relationships and patterns within datasets.

Researchers and analysts need to get insights, make educated decisions, and effectively convey findings.

In essence, multivariate data consists of several variables or qualities, each with its own set of values, creating a multi-dimensional puzzle.

Data scientists use a variety of visual tools, such as scatter plots, heatmaps, and parallel coordinate graphs, among others, to uncover hidden gems.

These visualisations give a complete picture of data relationships, allowing the detection of correlations, trends, and outliers, much like experienced cartographers charting unidentified territories.

This blog will delve into methodologies, best practices, and real-world applications that examine various elements of multivariate data visualisation.

If you want to have a booming career in data science or take up a data science course, keep reading to learn in detail about multivariate data visualisation.

What is Multivariate Data Visualisation?

The graphical depiction of data sets that include several variables or characteristics is multivariate data visualisation.

It is a critical tool for data analysis and exploration, allowing analysts and researchers to acquire a better grasp of complex relationships within multidimensional data.

In a nutshell, multivariate data visualisation extends data beyond numbers and tables, transforming it into accessible and informative visual representations. It enables for the simultaneous evaluation of numerous variables using charts, graphs, scatter plots, heatmaps, and other visual approaches, revealing patterns, trends, and correlations that would otherwise be buried in raw data.

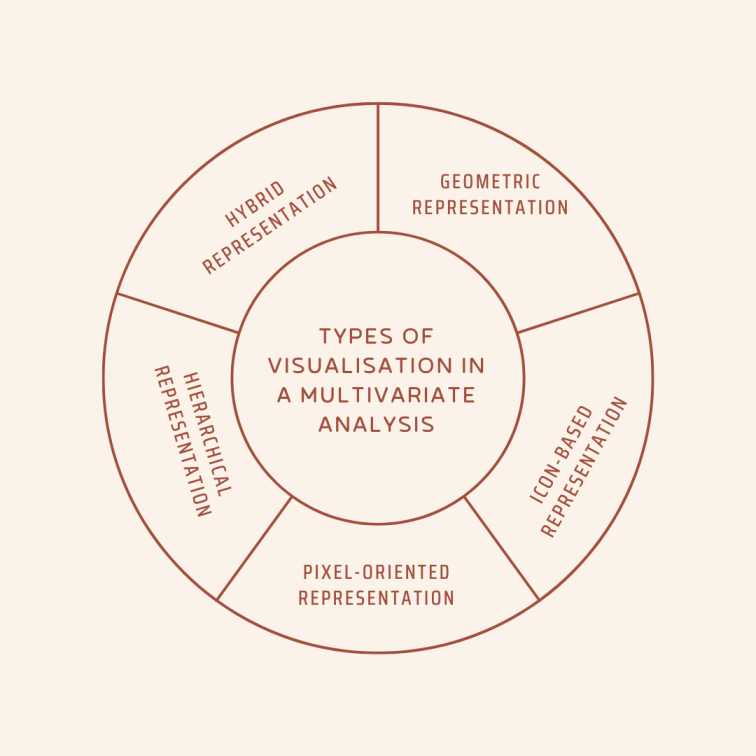
Types of Visualisation in a Multivariate Analysis

Types of Visualisation in a Multivariate Analysis

Data visualisation with multivariate analysis has its classifications. While making a career in data science and analytics, this knowledge will be useful.

1. Geometric Representation

Geometric representation is an important type of visualisation in multivariate analysis. Techniques like scatter plots, parallel coordinate plots, and multidimensional scaling are utilised for transforming complicated data into geometric forms and patterns.

These visualisations enable analysts to get useful insights and make well-informed choices by allowing them to explore links, clusters, and sequences within multidimensional data.

2. Icon-Based Representation

In multivariate analysis, icon-based representation is a visual approach that uses symbols or icons to convey information about data points.

Each icon’s characteristics, such as size, colour, or structure, indicate specific characteristics entitling rapid and intuitive comprehension of complicated data links.

This form of visualisation simplifies understanding data and is suitable for expressing multivariate ideas simply.

3. Pixel-Oriented Representation

Pixel-oriented representation is a type of visualisation used in a multivariate analysis that uses individual pixels organised in a grid to represent data points.

The colour or intensity of each pixel indicates distinct features or values, allowing analysts to see patterns and variances in the collection.

This method provides a particular visual perspective, which is beneficial for studying vast and complicated datasets, where pixel-level details can reveal deep linkages and nuances.

4. Hierarchical Representation

Hierarchical representation, in multivariate analysis, organises data in a hierarchical, layered format. It uses tree diagrams or layered structures to illustrate changeable relationships.

This visual technique facilitates recognising hierarchical patterns within datasets, allowing the discovery of connections and subgroups among variables, and increasing the depth of analysis and comprehension in complicated multivariate data.

5. Hybrid Representation

Hybrid representation in multivariate analysis combines numerous kinds of visualisation methods, such as scatter plots, bar charts, and heatmaps, to offer a complete picture of complicated data sets.

This strategy improves comprehension of multiple variable interactions by harnessing the capabilities of numerous visual tools, allowing analysts to extract key insights and patterns more effectively.

Why Conduct Multivariate Data Visualisation?

While getting a data analytics course or a data science course, one might wonder what is the need for conducting multivariate data visualisation.

One might often have this as a part of their data science training. Read to know about it in a simplified manner.

  • Comprehensive representation: Multivariate data visualisation gives an extensive overview of complicated datasets, allowing analysts to comprehend subtle relationships and patterns among various variables.
  • Pattern Recognition: It facilitates the detection of hidden patterns, correlations, and trends that would otherwise be missed by numerical analysis alone.
  • Outlier Detection: Visualisation aids in the rapid identification of outliers or abnormalities in data, which is critical for quality control or anomaly detection activities.
  • Effective transmission: Visual representations make complicated data more accessible and clear to varied stakeholders by simplifying the transmission of results.
  • Decision Support: By providing facts in a simple and usable style, it enables decision-makers to make educated choices.

Steps to Apply Multivariate Analysis for Data Visualisation

While doing a data analytics certification course, the learner often comes across the methodology to apply multivariate analysis for data visualisation. They are:

Step 1: Data Preparation
Begin by collecting and cleaning the data, resolving missing values and outliers, and ensuring that it is in an analysis-ready shape.

Step 2: Variable Selection
Select the variables or qualities that are significant to the study, taking into account their influence on the research question or aims.

Step 3: Data Reduction
When working with high-dimensional data, use techniques such as Principal Component Analysis (PCA) or Factor Analysis to decrease dimensionality while keeping crucial information.

Step 4: Visualisation Methods
Based on the data and objectives, choose appropriate multivariate visualisation approaches. Scatter plots, heat maps, and parallel coordinate graphs are all popular possibilities.

Step 5: Encoding Variables
To effectively depict their relationships in the chosen visualisation, map the selected variables to visual qualities like colour, size, or location.

Step 6: Interactive Tools
Implement interactive components in the visualisations to allow viewers to dynamically explore the data and gain deeper insights.

Step 7: Pattern Recognition
Examine the visualisations for patterns, trends, clusters, or outliers in the data.

Step 8: Interpretation and Communication
Interpret the insights acquired by visualisations and successfully communicate findings to stakeholders via reports or presentations.

Step 9: Refinement
Iteratively improve the visualisations and analyses in response to feedback and new research questions, ensuring that they remain aligned with the shifting objectives.

Step 10: Documentation
To ensure transparency and repeatability, document the whole multivariate analysis process, including data sources, techniques, and outcomes.

Conclusion
Multivariate data visualisation is an essential tool for unravelling complex and significant data. It allows the researchers to extract useful insights and make informed decisions. It connects data and knowledge enabling an effective communication system in different domains. This kind of visualisation plays a significant role in exploratory data analysis and research.

Check out Imarticus Learning’s Postgraduate Programme in Data Science and Analytics to become a data analyst.

This programme will give you 100% job assurance with chances to upskill yourself. It is both for fresh graduates and early career professionals, so anyone can join this data analytics course in india with placements. Get in touch via chat support on our Contact Us page. Alternatively, visit one of our training centers in Mumbai, Thane, Chennai, Pune, Bengaluru, Delhi, Gurgaon, or Ahmedabad.

Related Posts:

Why is Data Cleaning Essential

Businesses rely largely on relevant data to make effective decisions and forecasts. Poor data hygiene maintenance is a reoccurring issue for organisations all around the world. It can not only stymie productivity but also lead to increased maintenance costs and system breakdowns. According to a recent market analysis conducted by IBM, poor data hygiene costs the US economy $3.1 trillion every year. 

This is where the role of data cleansing comes in. Data cleansing helps eliminate “dirty data” and guarantees that the outcomes of data analysis are accurate, dependable, and trustworthy. In this article, you will learn more about the importance of data cleaning, the numerous tools involved in the process, and why taking up a data science and machine learning course can be a beneficial career choice. 

What is Data Cleansing?

Data Science Course

Data cleaning, also known as data cleansing or data scrubbing, is the process of identifying and correcting or removing errors, inconsistencies, inaccuracies, and duplications in datasets.

It is an essential step in the data preparation process and plays a crucial role in ensuring the accuracy, reliability, and integrity of data. 

Data cleansing is often conducted using data cleaning tools, software, or computer languages that automate the process, but depending on the complexity and sensitivity of the data, it may also entail manual inspection and validation.

Effective data cleansing ensures that data is precise, credible, and consistent, which is essential for facilitating reliable insights, making educated decisions, and driving business growth. 

Benefits of Data Cleansing

Having clean data ultimately increases overall productivity and allows for the highest quality information to streamline decision-making. Here are some of the other reasons why data cleaning is essential in facilitating business growth:-

  • Accurate and Reliable Data: Clean data is required for facilitating accurate and dependable analysis, reporting, and data-driven decision-making. Flaws, inconsistencies, and inaccuracies in data can result in wrong insights, inaccurate conclusions, and poor decision-making, all of which can have serious implications for businesses and organisations.
  • Data Consistency: Data cleansing helps to assure data consistency across multiple sources, systems, and formats. Inconsistent data can cause confusion, misalignment, and misunderstanding of data making it difficult to efficiently compare, integrate, and analyse data.
  • Data Integrity: Clean data is devoid of duplications, missing numbers, and other data quality concerns, so it retains its integrity. Data integrity is critical for ensuring data dependability which is vital in regulated areas like banking, compliance, and healthcare.
  • Enhanced Data Quality: Data cleaning helps to enhance the overall quality of data  by identifying and resolving mistakes, discrepancies, and errors. High-quality data is critical for creating credible insights and driving crucial business decisions.
  • Reducing Unnecessary Costs: Data inaccuracies, replication, and discrepancies can cause firms to incur needless expenditures. Data cleansing helps prevent errors like making inaccurate pricing decisions, sending duplicate emails to clients, or spending resources on ineffective data analysis.
  • Enhanced Data Analysis: Clean data provides a firm foundation for data analysis, allowing professionals and company owners to conduct meaningful and trustworthy research. Data cleaning aids in the detection and correction of data-related problems that may interfere with analysis findings, ensuring that the insights acquired are valid and relevant.

The Most Efficient Data Cleansing Methods

Implementing improved data-cleansing procedures can aid in extracting usable information from datasets and removing numerous problems. There are several data cleansing methods available for quickly cleaning and improving data quality. Among the most regularly utilised approaches are:-

  • Standardisation method: This method of data cleansing constitutes the standardising of data to assure uniformity in units, format, and representations. This might include standardising dates, normalising addresses, or transforming data to a common measurement unit. Data standardisation can aid in the elimination of unreliable data, making it more comparable and accessible for analysis.
  • Data imputation: Filling up missing data with appropriate values based on statistical methods or domain expertise is known as data imputation. This can include approaches like mean, median, or mode imputation, as well as applying machine learning algorithms to estimate missing values based on data trends. Data imputation ensures that data is full and can be analysed without gaps.
  • Deduplication method: This method constitutes locating and deleting duplicate data records to minimise duplication and maintain data integrity. This might include finding and merging duplicate items based on specified rules, such as name, phone number, or address. Deduplication ensures that data is unique and prevents repetitive analysis and reporting.
  • Data verification: Data verification is another highly reliable data cleansing method that involves detecting and correcting discrepancies or inaccuracies in data by comparing it to trusted sources or reference data. It primarily involves cross-referencing data with other sources (databases, APIs, or reference data) to check their accuracy and dependability.
  • Automated data cleaning tools: Employing data cleaning tools or software that automates the data cleansing process is a fool-proof data cleansing method that makes the job a hundred times easier. These solutions may have built-in rules, algorithms, and validation tests that may be modified to rapidly and effectively clean and enhance data quality.
  • Data profiling: Profiling data to detect concerns in data quality, such as missing numbers, inaccurate values, or anomalies is another highly efficient data cleaning method. Data profiling approaches can give insights into data quality and assist in identifying areas that require cleaning or enhancement.

Conclusion

Data cleaning is one of the most effective ways to reduce inconsistencies that can lead to added costs. It is the most straightforward way to save expenses, minimise potential risks, as well as safeguard the company’s reputation. Finally, data cleaning is vital for guaranteeing the accuracy, consistency, and integrity of data, which is vital to making educated decisions, promoting corporate success, and ensuring compliance in various sectors. 

A career in data science and machine learning may be rewarding for people who enjoy working with data, solving complicated issues, and making a difference. But, before embarking on any job route, it is critical to conduct an extensive study and carefully assess your interests, talents, and career objectives. If you are passionate about pursuing this field, you can consider joining a data science and machine learning course offered by Imarticus Learning. 

How to prepare yourself before appearing for data structures and algorithms interview

The method of organising data using a virtual system is called a data structure. The tables of data, or sequences of numbers, are all well-defined structures. An algorithm is basically a series of steps that are carried out by a computer, which takes input and then transforms that into target outputs.

The combination of data structures and algorithms helps programmers to build the computer programs of their choice. A highly optimised and efficient code can be ensured only by having deep knowledge of data structures and algorithms. If one wants to learn data structures and algorithms, there are solid courses available online.

Preparations for a Data Structure and Algorithms Interview

Full Stack Developer Course

For developing the skills that are required for acing a data structure and algorithms interview, it is very important to explore all the directions, ask the right kind of questions, and understand the most suitable practices along with common pitfalls of the modern software symptoms.

The main purpose of a data structure and algorithms interview is to exhibit one’s ability in order to become an appropriate engineering teammate by identifying strong coding, problem-solving and communication skills. Some of the things that one should focus on throughout the interview are:

  • Preparing Before the Interview

It is very important to have deep knowledge and talk about different kinds of data structures and all their weaknesses, strengths and how they can be compared to each other. It is better to execute data structures from scratch because that makes one more prepared for these interviews, compared to studying those data structures like an abstract concept. It is extremely important to be familiar with all the major algorithms. 

  • Understanding a Problem

Generally, the interview starts by briefly discussing a problem that the interviewee needs to solve. Many applicants start to code when they see the questions, but later on, that may often lead to errors. Instead, it is much more important to read the question thoroughly and understand the constraints. It is very important for the interviewer to get a good insight into the way the applicant thinks through a problem or an issue. It is very important to make the interviewer understand that the applicant is spending time on implementing the solution. It is also important to have enough time for coding the solution as well.

  • Conversing Through the Brute Force Solution

It is very important to talk through the brute force solution that the applicant can think of with the interviewer. Quite often, applicants skip conversing through the brute force solution because they think that the brute force solution is very obvious. This is actually a mistake. Even if it takes a lot of time, it is very important to come up with a solution to the stated problem. After talking through the brute force solution, it is important to ask the interviewer if they would like the applicant to implement that solution, or come up with a better solution.

  • Optimising the Solution

After talking through the brute force solution, the interviewer might ask for a better solution. If something like this happens, then it is very important to discuss the applicant’s approach with the interviewer and then understand what to optimise, space, time, or both. Some initial assumptions can change too while optimising. For that reason, it is important to check with the interviewer. Once the interviewer and the applicant agree on a specific solution, the coding starts. 

  • Coding the Solution

It is very important to make the interviewer understand what the applicant is doing. While coding, it is important to converse on the section of the code that the applicant is going to implement on a higher level and why it was written. The interviewer should understand the applicant’s code and whether that code would return the expected results and be a solution to the problem. There is a high chance of missing out on a bug or having a syntax error, and for that reason, it is necessary to go through the code thoroughly.

  • Testing the Solution

Debugging is an extremely important skill. If the code has any bug, the applicant can showcase his or her ability to analyse why the code failed and then fix it. Good programmers are more likely to solve bugs as they code, rather than writing a perfect code on their first attempt. It is very important to do some manual testing to make sure it performs the way the applicant expected it to work. 

  • Practising and Learning New Tactics

Practicing questions on data structures and algorithms is one of the most important ways of improving an applicant’s performance. Mostly, data structures and algorithms interviews are very similar and for that reason, practicing more means having a higher chance of facing problems that the applicant is already familiar with. One of the best ways to prepare for these interviews is by doing mock interviews. 

Conclusion

The full stack web development course from Imarticus helps the applicant to have a deep knowledge of web development technologies as well as data structures and algorithms. The full stack developer certification can help the applicants to acquire the knowledge needed to crack data structures and algorithms interviews.

I learned these 7 skills from my data science and machine learning course

I learned these 7 skills from my data science and machine learning course 

Data Science is concerned with programming in which the raw data is transformed into actionable insights. A substantial amount of data is analyzed to prepare a final report. At the same time, machine learning is the branch of Artificial Intelligence closely related to data science. Machine learning predicts outcomes and enhances performance by using historical data as input. You can gain certification and develop your skills by learning Data Science and Machine learning.

Suppose you believe that learning data science and machine learning will merely lead to a certification. However, you might think that programming is the only aspect of data science that is true! It undoubtedly provides vital abilities that enable you to transform unprocessed info into extraordinary results. The course will teach you various skills that will help you advance your profession.

Programming Skills

You may learn a variety of programs through data science. These include Python, SQL, Java, R, and MATLAB, which can be used to develop a career across many industries. You can master the

Data Wrangling

Data Wrangling is an essential skill you can master and excel in your career. If you are currently working on a project and are unaware of untangling the data, then data wrangling will surely help you. Data wrangling is a crucial skill that aids in getting the data ready for transformation and mapping for future use. You will have completed the first level of the course once you have mastered this talent. 

Data Visualization

It is pretty simple to create graphs, pie charts, and other pictorial presentations of data. However, the ability to communicate facts effectively before concluding is aided by data visualization skills. Your data presentation skills will improve after taking a data science course. This skill helps you in turning simple data into creative insights. Once the data has been displayed, you may create a narrative and comprehend the challenging datasets.

Cloud Computing

Understanding the idea of cloud computing is essential for managing massive amounts of data. Since Data Science Course requires the compilation of hast amount of data, you need to be familiar with cloud computing. You would require the essential skill of managing the data and processing it. This includes analyzing and visualizing the data to store it in the cloud. Since data Science and Cloud computing are mutual concepts, cloud computing enables you to use Google Cloud and Azure to store the data. Once you’ve completed this phase successfully, you can easily handle the database, operational tools, and programming languages.

 ML Libraries & Algorithms

Since the job of a machine learning executive involves using algorithms and libraries which the original developers have already developed, this includes the Microsoft CNPK and Apache Spark’s MLlib. Once you have learned different concepts, you can use other concepts and integrate them into various systems.

Applied Mathematics

Since the Data Science course requires you to stay quick and perform efficiently, it also improves your math skills. The Data Science course improves your mathematical skills and polishes the concepts learned in school. Math plays a prominent role in learning machine learning. This skill equips you to use the correct ML algorithm and set appropriate confidence levels. Here, you can understand simple statistical models easily, such as distributions like Poisson, Normal, Binomial and probability, and statistics.

Domain knowledge

A thorough understanding of the topic is crucial because machine learning depends entirely on software and solutions optimization. The course provided insight into the domains that required specific design and information. The study also provided knowledge on different parts available for working.

 Therefore, doing a Data Science Certificate Course would give you a variety of abilities and boost your effectiveness at work. Additionally, it improves your capacity for excellence in your tasks and clever work. You can contact us through our program’s webpage for more information about the Data Science Certificate Course. Even better, you can browse our centers and chat with support. Additionally, you can get in touch with us using the 24/7 chat assistance. Mumbai, Thane, Pune, Chennai, Bengaluru, Delhi, Gurgaon, and Ahmedabad are the locations of our training facilities.

How They Got There: Transitioning To Data Science

How They Got There: Transitioning To Data Science

The emergence of big data has prompted businesses to rely on data to make informed decisions. But how do you make sense of all that data?  That’s where the data scientist enters the scene.

A data scientist collects, analyses, and interprets data to make business recommendations. They do this by using AI, Statistics, and Computer science. They can apply these skills to a wide range of industries such as healthcare, finance, and retail.

The Data science career is an excellent choice for those interested in working with data. And it’s pretty rewarding with the right skills. Whether you want to advance in your career in data science or start, many options are available. One of the most effective ways is through data science courses.

These courses enable students with the right skills and knowledge to succeed. Let’s explore how you can transition with the help of proper data science online training.

Transitioning to Data Science via Applied Learning Courses 

The easiest way to transition to the data science space is to learn the fundamentals of the subject. Consider enrolling in a data science online training program that incorporates applied learning.

This learning method is convenient since students are not restricted to physical classrooms. Also, it offers students the flexibility to learn at their own pace, anywhere, and at any time. 

The learning model in an online environment is flexible and includes various resources. These include videos, lectures, articles, books, and one-on-one interactions with the instructor. Next, let’s talk about what you’ll need to learn in your data science course.

Data Science Online Training Curriculum

To transition into data science, you’ll need to learn the fundamental concepts, including:

  • Statistics
  • Probability Theory
  • Probability Distributions
  • Hypothesis Testing
  • Statistical Tests

These topics form the core of any data science course. Moreover, an understanding of Machine learning and Predictive Modelling is also required. Apart from these topics, you’ll also learn about some essential tools and languages. These include:

  • Python
  • Tableau
  • SQL
  • NumPy
  • Pandas

Combining these tools with fundamental concepts will help you in your data role.

What Makes a Good Data Science Online Training?

So, we’ve considered the curriculum requisites for transitioning into a data science career. Now, let’s examine what makes a great data science course based on applied learning: Faculty from top institutes such as IIT/IIM and other industry experts.

  • Live instructor-led online sessions with access to the session recordings and notes.
  • Online discussion with course faculty and peers to clear doubts and brainstorm.
  • Real-world case studies and live projects to provide insight. These concepts can predict property value, heart disease, taxi fare, etc.
  • Regular assignment assessments to track progress.
  • A Capstone project to collate and present the course learnings.
  • Career support activities, including resume-building workshops and mock interviews for job placements.
  • Startup mentorship and funding for those looking to start their ventures.
  • Certification of completion.
  • Access to an alumni network and a chance for an on-campus immersion program.

A course providing these things will ensure that you learn data science skills and make data-driven decisions. One such data science online training based on the concept of applied learning is offered by Imaticus Learning.

About Imaticus Learning

Imarticus Learning, in collaboration with iHUB DivyaSampark @ IIT Roorkee and the Department of Science & Technology (DST), offers one of the best certification programs in Data Science and Machine Learning

Since the program is made especially for early and mid-level professionals, you’ll understand the various aspects of data science and learn how to implement and apply these concepts to real-world problems. 

Imaticus Learning covers all the points that make for excellent data science online training program, as mentioned earlier. Check out the success stories of those who transitioned into the data science field. Some alumni work with big brands such as Accenture, Capgemini, KPMG, etc.

You can visit the Imarticus Learning website for live chat support. You can also drive to one of their training centers in Mumbai, Thane, Pune, Chennai, Bengaluru, Delhi, Gurgaon, or Ahmedabad.

Conclusion

As data becomes central to decision-making in organizations, those with the skills to analyze and interpret it will be in high demand. Starting or transitioning to a data science career requires a strong foundation. And to help you with that, you can look for result-oriented data science courses.

Attending these courses helps you develop the skills needed to become a top Data scientist, Data Analyst, Business analyst, Data manager, Business Intelligence expert, etc.

This blog discussed what constitutes a top data science online training program and explored one such institute in Imaticus Learning. Feel free to check it out. Also, let us know your opinion on the necessary things for transitioning into the data science career.

An Introduction To The Certificate Program In Data Science And Machine Learning In Association With Ihub Divyasampark @ IIT Roorkee Course

An Introduction To The Certificate Program In Data Science And Machine Learning In Association With Ihub Divyasampark @ IIT Roorkee Course

Introduction 

In today’s world of innovation, data science is a wonderful opportunity. It makes great use of technologies like artificial intelligence, machine learning, analytics, and more. The recent technological revolution in the industry has significantly increased the demand for these elite technological talents.

Data science trends

Data science is currently emerging as a very demanding trend in the industry. The size of the Data Science Platform market is projected to increase from USD 95.3 billion in 2021 to 322.9 USD billion in 2026, with a compounded annual growth rate of 27.7% over the forecast period (CAGR).

As business modernization and digitization double, data continues to grow. By 2025, the global data sphere will have 175 zettabytes of data, according to Seagate UK. And the data crafter is in high demand.

The US Bureau of Labor Statistics estimates that the growing importance of data science will create approximately 11.5 million jobs by 2026.

Data science vs. machine learning – which one is a promising career? 

Machine learning engineer and data scientist are two of the most popular jobs in the industry. Writing code and distributing ML solutions is the primary responsibility of an ML expert. Data experts, on the other hand, examine raw data and extract useful information from it. Over time, the line between machine learning engineers and data scientists is narrowing as technology integrates their work into a single solution. Professionals who can organize this vast data to provide business solutions will be in high demand.

If you get a chance to learn both subjects in the same program, you will be lucky. Right?

Why train yourself in data science and machine learning?

According to a 2021 India Talent Trends report published by recruitment firm Michael Page, data science professionals with 3-10 years of experience earn an annual salary within the range of Rs 25-65 lakh, while those with more experience can offer a salary package of more than a crore.

If you are a beginner in the IT industry or a mid-level developer aspiring to become a data scientist or machine learning engineer, you can confirm your career with a certificate token in the data science/machine learning programs available online. Many data sciences online training providers conduct short dredging courses in data science and machine learning. You can choose one of the best data science courses available.

Of course, those who want to pursue a career in data science, machine learning, data analytics, or even business analysts need to recharge their skills in the data science domain. Certification programs in data science and machine learning will help them align their qualifications. Go to the course and visualize yourself on the path to your dream role as a data analyst, data scientist, data manager, BI expert, business analyst, data analysis consultant, or similar. 

Data science certification

The certification program in the Data Science and Machine Learning program at Imarticus Learning is an ideal opportunity for new graduates and those in transition to a career change in data science and machine learning. This is a 5-month live online training program designed by the top faculty members of IIT and industry experts.

Program outcome

You will learn the basics and aspects of data science and machine learning. Students can build a strong foundation in data science. Using Python, you can specialize in machine learning with core algorithms and data-driven decision-making. When you exercise with the right knowledge, the use of learning in live projects helps solve real-world problems.

The guidance and mentoring of industry experts with extensive experience working in the data science and machine learning domains in many organizations certainly help students to excel in project work. The great thing about project work is that you get to work in various industry domains, adapting to your current work domain or your subject specialization.

Some interesting examples of projects are:

  • Developing a predictive model for property valuations in real-estate companies
  • Fare prediction of online taxi service in transportation/logistics sector companies
  • Vaccine prediction using patient medical attributes analysis in the healthcare industry 

The resources behind this program

This course is thoughtfully designed to create the entrepreneurs of tomorrow under the scheme of Digital India Support, tagged iHUB DivyaSampark @ IIT Roorkee. The program also provides an excellent platform for those young learners who are enthusiastic and startup-minded. Such entrepreneurs can develop innovative ideas to implement and gain funding support.

You will receive a certificate issued jointly by iHUB DivyaSampark @ IIT Roorkee, Department of Science and Technology (DST), and Imarticus Learning.

Please contact us via live chat and/or message to get more information about the courses or visit one of our training centers in Mumbai, Thane, Pune, Delhi, Gurgaon, Chennai, and Bangalore. 

Why Does Everyone Want To Do A Data Science Course? And Why It’s The Best Decision

Why Does Everyone Want To Do A Data Science Course? And Why It’s The Best Decision

Data-driven decision-making (DDD) has transformed our society. We make decisions using insights derived from analyzing large quantities of data: hiring managers interview candidates based on their resumes; doctors diagnose patients based on test results; marketing agencies design campaigns around consumer insights gleaned from monitoring buying behavior, and companies develop new products by conducting market research. The most successful organizations use DDD to find opportunities and improve processes. 

This means that people with experience in data analysis are highly sought after by companies across all industries – they are the future leaders of today’s business world! 

A data scientist is a person who uses statistics, programming knowledge, and domain expertise (collectively known as skills) to extract meaning from information contained within datasets for various purposes, including business applications or research projects.

What is a data science course?

Data science is a field of science that deals with the collection, storage, analysis, and distribution of data. Data science uses data to find patterns and trends. Data scientists use statistics, mathematics, and computer programming to analyze large quantities of data from many sources.

Data Science combines statistical analysis with computer programming skills to solve real-world problems such as forecasting future sales or understanding consumer behaviour.

Here are a few reasons why everyone wants to do a data science course

The rise of data science is a huge game-changer. The world is shifting from paper to digital, and as a result, there are more opportunities than ever before. Data science is an exciting field that has attracted many people. People want to learn how they can apply their knowledge in the real world and get a job.  

A data science course will help you become an expert in data science. It will also help you get a job in data science, and it can even help you make money as a data scientist!

Here are four main reasons people are interested in pursuing a career in this field:

  • It’s lucrative.
  • It helps you develop valuable skills.
  • There’s high demand for professionals trained in data science.
  • The work can be creatively stimulating.

The Data Science course is one of the best courses available today for beginners who want to launch their careers or get better at their current job. 

Discover a data science career with Imarticus Learning

This certificate program in data science and machine learning helps students get started in data science and machine learning. This curriculum, created in collaboration with iHUB DivyaSampark @IIT Roorkee, will teach students the principles and elements of data science and machine learning and arm them with the necessary skills to apply these ideas to real-world issues. 

Course Benefits For Learners:

  • This 5-month curriculum, created by renowned IIT faculty members, will teach students how to utilize Python to understand data mining and machine learning techniques.
  • Learners will be able to acquire a strong foundation in data science and specialize in machine learning using Python for data-driven decision-making with this data science curriculum. 
  • The data science online training will be live via online sessions with India’s best teachers.

Contact us through chat support, or drive to our training centres in Mumbai, Thane, Pune, Chennai, Bengaluru, Delhi, and Gurgaon

5 SQL Tricks Every Data Scientist Must Know

5 SQL Tricks Every Data Scientist Must Know

The world of data science is changing the way we work, communicate, and live. Data scientists are at the forefront of this change, helping unlock new insights and improve our lives. But in order to do so, they need to understand SQL—the standard language for managing data in relational databases. 

Data science courses offered by Imarticus learning include SQL, Data Visualization with Power BI, Python, and many others. Let us look at the tips and tricks to get you to speed up.

  1. Use wildcard characters for ranges of values

If you want to find all the numbers between 1 and 10—for example—you can just type “1-10” into your query and get results instantly. You can also use “*” as a wildcard character for any value (e.g., “*a?” would return results with aaaa or aaa).

  1. Use LIKE and WITH to find specific patterns in strings

If you’re looking for a particular pattern within a string—like if someone’s name is “John Smith”—you can use LIKE to find those exact characters in your query: WHERE FIRST_NAME = ‘John’ AND LAST_NAME = ‘Smith’.

Use the LIKE operator to find all rows that match a pattern of characters or numbers. For example, if you want to find all the customers whose names start with “J,” use “Name” LIKE ‘J%’.

WITH statement. The WITH statement allows you to define a temporary table for your query so that you can use the results without repeating yourself.

For example, imagine you have data on all the colleges in the US that’s stored in one table called “college,” and they’re all represented by their state abbreviation (e.g., “WA” is Washington). Let’s say you want to know what percentage of incoming freshmen at each college paid full tuition (the answer will probably be 100%). You could try writing this query:

SELECT CAST(cnty AS FLOAT) AS percent_full_tuition FROM college

But you’ll get an error because CAST() only works with numbers. Instead, you can wrap up our query in a WITH statement like:

WITH college_data AS ( SELECT CAST(cnty AS FLOAT) AS percent_full_tuition FROM college )

  1. Sorting data

Data sorting is a key process in the data analysis process. It allows you to put your data into a specific order to easily find and analyze the information you need. One of the most basic ways to sort data is using an ORDER BY clause.

In SQL, you can use the ORDER BY clause to sort your query results according to any column or columns present in your query. To do this, simply add an ORDER BY clause that specifies how you want your query results sorted:

SELECT * FROM tbl_name ORDER BY col1 ASC;

This will sort your results by column col1 in ascending order (A-Z). If we wanted it sorted in descending order (Z-A), we would use DESC instead:

SELECT * FROM tbl_name ORDER BY col1 DESC;

The above query would return all records from table tbl_name with col1 values first, then col2 values, etc., until all records have been returned and displayed on the screen.

  1. Using Arrays

Each value within an array has its own unique index number that determines its position with other values within the array.

For example, if we had an array containing three values: John Doe, Jane Smith, and Joe Brown—and each value had its own index number (1, 2, 3), then our array would look like this: [John Doe] [Jane Smith] [Joe Brown].

The advantage of using arrays over traditional data structures, such as strings or objects, is that arrays allow you to store multiple values together without worrying about their order or relationship with one another. 

Arrays are a common data structure in SQL. An array is a collection of items with the same type and share the same name but may have different values. Arrays are useful because they allow you to store related information together without having to create separate tables for each item or value.

You can manipulate arrays in many ways using SQL syntax, including accessing elements within an array using subscripts or using functions that operate on an entire array (like SUM()).

  1. Derived table

A derived table lets you pull out just the parts of your query that are interesting to you, without worrying about what else might be in there. For example, say you have a bunch of users’ names and their favorite colors:

SELECT name FROM users_table WHERE age > 18;

This query would give us a whole list of users’ names, but we don’t really care about the rest—we just want to know what people like as their favorite color! We could do this with another query:

SELECT name FROM users_table WHERE age > 18;

SELECT favorite_color FROM users_table WHERE age > 18;

This would give us back just one column instead of two (which is why it’s called a “derived” table).

Looking to get a deep and better understanding of SQL, then get in touch with us at Imarticus Learning by visiting our offline centers in major cities throughout India or through chat support. If you are a fresh graduate or have just started your career, Imarticus can offer an extensive data science certification program that ventures through each aspect necessary for data scientists.

Here’s Why Data Science Courses Are Gaining Momentum In 2022

Here’s Why Data Science Courses Are Gaining Momentum In 2022

As we progress through the year, we can see that the job of data scientists has become a new most significant trend throughout the world, and data-driven decision-making is becoming more popular. No matter how small or large, every firm strives for qualified and skilled personnel who can grasp and effectively analyze data, making it the hottest profession and most desired vocation in any industry.

Data are essential for digital agencies since the ultimate goal is to extract brilliant and relevant insights from data to help companies use the power of data. This blog post will explain data science and give you some reasons why the data science course is gaining momentum in 2022.

What is Data Science, and how does it work?

Data is like the raw diamond in today’s technology-driven society, and Data Science is the mining infrastructure setup that makes the data valuable for reshaping the world. Self-regulating systems are impossible to construct without a massive amount of data. So, in 2022, Data Science would entail analyzing vast volumes of data for Business Analytics.

Data Science is a broad study of data acquired by diverse businesses for various commercial goals. It entails using numerous data analysis techniques to analyze data via the Internet.

Here are some reasons why data science courses are gaining momentum in 2022.

In healthcare, data science is critical for keeping track of patients’ health and assisting doctors in understanding illness trends and preventing sickness. Data Engineers are needed in the healthcare business to aid in developing automated systems for the analysis of complex data in clinical applications. 

The data mining engineer evaluates not just their own company’s data but also data obtained from external sources. A data mining engineer will design complex algorithms to help further examine the data and analyze it. 

Data scientists start by converting a business case into an analytics agenda, formulating hypotheses, comprehending data, and investigating trends to see how they affect organizations. They also research and select algorithms to aid in data analysis. 

Data scientists may utilize business analytics to explain how data will involve a company and help create solutions to assist the organization deal with these consequences in the future.

Software development is the most prevalent use of Data Science. Industries use Data Science and Machine Learning to create automated software development solutions. As a result, this business has a high demand for Data Science applicants. Customer data gets used by the e-commerce business to improve customer service and deliver a better user experience. 

Discover a data science career with Imarticus Learning

This certificate program in data science and machine learning helps students get started in data science and machine learning. This curriculum, created in collaboration with iHUB DivyaSampark @IIT Roorkee, will teach students the principles and elements of data science and machine learning and arm them with the necessary skills to apply these ideas to real-world issues. 

Course Benefits For Learners:

  • This 5-month curriculum, created by renowned IIT faculty members, will teach students how to utilize Python to understand data mining and machine learning techniques.
  • Learners will be able to acquire a strong foundation in data science and specialize in machine learning using Python for data-driven decision-making with this data science curriculum. 
  • The data science online training will be live via online sessions with India’s best teachers.

Contact us through chat support, or drive to our training centers in Mumbai, Thane, Pune, Chennai, Bengaluru, Delhi, and Gurgaon

Why Python for Data Science is Easy to Learn for Beginners?

Why Python for Data Science is Easy to Learn for Beginners?

Python is one of the most popular programming languages for data science. Python offers many advantages that make it easy for beginners, including its user-friendly syntax and powerful libraries. In this blog post, we’ll explore why Python is an excellent choice if you’re new to data science and want a language that’s both fun and effective for getting started.

Why is it easy to learn Python?

  1. Python’s Simple, Clear Syntax

If you’re new to programming or coming from a different language, learning how to code in Python can be straightforward. It has a clear syntax that is often more readable than other programming languages, making it easy to understand. Moreover, Python does not have any mandatory declarations or keywords, which means it doesn’t require a lot of boilerplate.

  1. Python’s Powerful Libraries for Data Science

Python has several libraries for data science, including NumPy, Pandas, and Scikit-Learn. These libraries make it easy to work with datasets, do scientific calculations, and build machine learning models. In addition to these libraries, Python has an extensive collection of modules for specific purposes. Many data science projects are built with libraries included in the standard distribution of Python, making it even easier to work with them.

  1. Community Support for Data Science in Python

The vast majority of courses on data science use Python as the teaching language. It means that if you’re new to data science, there are more resources available for learning python than for other languages.

Though many beginners find it easy to learn Python programming basics, data science often requires a deeper understanding of Python’s application in practice. For example, you need to know which algorithm will work best for the problem at hand with machine learning projects. Python has an active community of users who continually contribute to its success by contributing to open source projects and data science-related blog posts.

Is it possible to learn python training for beginners?

Absolutely! While working in Python requires more effort than in other languages, many online resources help you get started with data science in Python.

There are also plenty of books, courses, and tutorials available that will guide you through topics such as machine learning algorithms, visualization tools, and statistical concepts. As you can see, there are lots of reasons why Python is an excellent choice for beginners.

Learn Data Science with Imarticus Learning

A postgraduate program is for corporate experts to help students master real-world Data Science applications from the ground up and construct strong models to provide business insights and forecasts. The program is for graduates and early-career professionals (0-5 years) who want to grow their careers in Data Science, the most in-demand job skill. With this program’s job assurance guarantee, students may take a significant step forward in their careers.

Some course USP:

  • This Data science courses with placement assurance aid the students to learn job-relevant skills that prepare them for an exciting career.
  • Impress employers & showcase skills with a certification endorsed by India’s most prestigious academic collaborations.
  • World-Class Academic Professors to learn from through live online sessions and discussions. It will help students understand the 360-degree practical learning implementation with assignments.

Contact us through the live chat support system or schedule a visit to training centers in Mumbai, Thane, Pune, Chennai, Bengaluru, Delhi, and Gurgaon.