Have you ever felt stuck in finance roles that don’t lead anywhere?
You’ve delivered reports, budgets, and forecasts, but struggle to break into the executive tier. You yearn for strategic impact, but lack that leadership edge that no school taught. It equips you with CFO leadership training, strategic finance skills, and a real network.
Let’s uncover why this path can elevate your career, with purpose, credibility, and results.
Understanding Why the CFO Programme Matters in India’s Finance Landscape
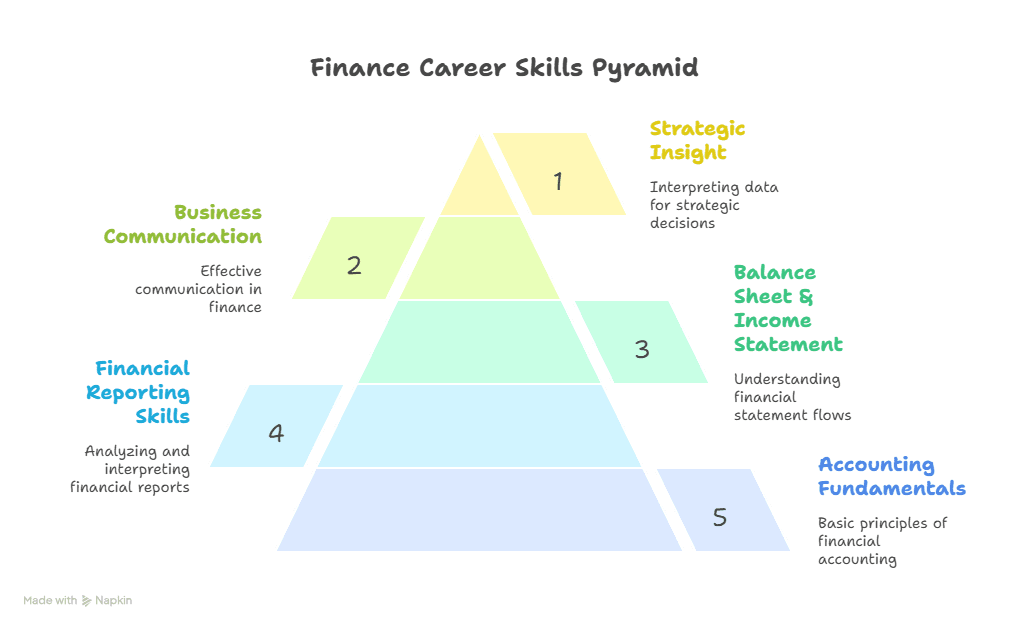
You know the finance world has changed. India’s corporate environment demands more than technical finance knowledge. Now leaders need strategy, communication skills, team building, and purpose. A CFO programme gives that depth. It teaches how to lead growth, manage teams, and think ethically.
A chief financial officer (CFO) is responsible for making key decisions related to a company’s projects and finances. They addressed challenges like team alignment, transformational strategy, and stakeholder management. Thus, career advancement in finance flows from mastering those strategic demands.
How the CFO Leadership Training Shapes Strategic Finance Skills
ISB’s Chief Financial Officer Programme centres on strategic CFO skills. It spans blended learning and sessions with seasoned CXOs. You engage in experiential exercises covering business strategy, financial decision‑making, and integrity‑led leadership.
The programme builds capable finance leaders, able to guide enterprises through uncertainty. Faculty members bring real case studies from policy and corporate sectors. They teach you decisions rather than just accounting. You refine your finance mindset toward transformation. This CFO leadership training also helps transition to the C‑Suite with authority.
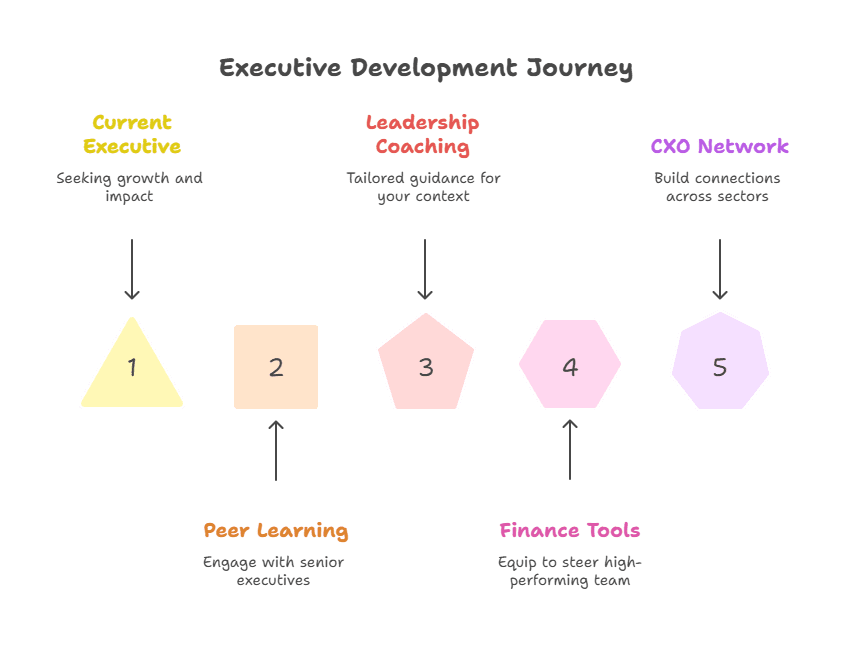
You might wonder what actual benefits arrive from such an executive finance programme:
- Learn from a cohort of senior executives that raises discourse and peer learning.
- Gain leadership coaching that is for your professional context.
- Receive tools to steer a high‑performing finance team.
- Network with CXOs across sectors, building your social net worth.
- You emerge with a globally recognised certificate, boosting credibility.
Above all, you immerse in strategy, change management and ethical leadership. That propels finance career advancement through both visibility and capability.
Course Features and Outcomes at a Glance
This programme blends multiple features to deliver results. In India, CFO compensation rise steadily, reaching an average of ₹2.3 crore in 2025, a 1.7 times increase since 2015, according to Business Standard.
Here is a table that captures its structure and potential outcomes.
| Feature | Description | Impact on Career |
| Blended Learning | Self‑paced videos, masterclasses, office hours | Flexible yet rigorous learning pace |
| Leadership Coaching | Personalised coaching from experts | Helps transition into C‑Suite roles confidently |
| Experiential Strategy Training | Case work guided by CXOs | Builds strategic decision-making ability |
| Network with Senior Executives | Peers from various sectors and geographies | Expands leadership circle and opportunities |
| ISB Brand Recognition | Global recognition and executive education ranking | Adds credibility and trust in the finance domain |
That lack creates friction, especially when your peers rise and move into the C‑Suite. You ask: Why is strategic thinking reserved for others?
That gap raises the question of what separates finance experts from CFOs. This CFO programme empathises with that struggle and gives you tools to understand it so your skills match your ambition.
How Strategic CFO Skills Influence Business Growth
Leaders who think strategically unlock revenue opportunities. They guide finance teams to drive performance, not just report numbers. They collaborate with operations, marketing, and sales to align finance strategy with business direction.
The programme teaches how to evaluate enterprise value and lead transformations. With that training, you shift from reactive finance duties into proactive business stewardship. It reshapes your mindset. Employers don’t just see technical ability, they see strategic leadership potential. That makes you stand out.
How the ISB Chief Financial Officer Programme Transforms You into a Strategic CFO
ISB holds leadership in Indian executive education. Their alumni shape policy and business across sectors. Imarticus Learning delivers this programme using ISB faculty and industry mentors.
We backed training with a rigorous structure, 8‑month blended learning, leadership coaching, and real‑world strategy application. This solid background ensures you get polished, career‑fit learning. You don’t just absorb theory. You embody practical, strategic decision‑making that executives expect.
Joining this CFO programme gives clear advantages.
- Lead with confidence in board meetings and investor discussions.
- Shape a finance function that supports growth rather than just controlling costs.
- Boost your strategic reputation among peers and companies alike.
- Uplift your finance career advancement by signalling readiness for CFO roles. You earn a certificate that people recognise.
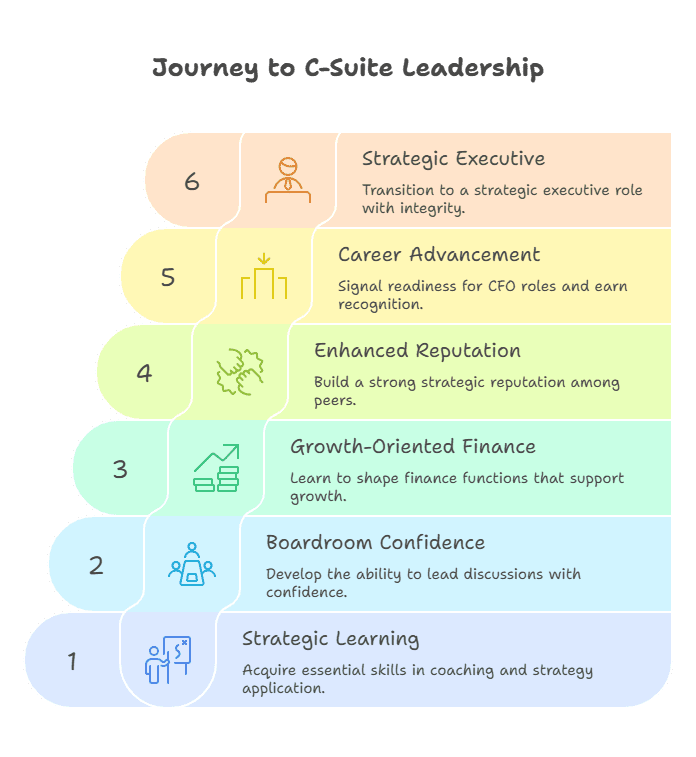
Additionally, structured coaching offers a mirror to refine weaknesses and affirm strengths together that helps you transition from functional leader to strategic executive voice.
Above all, use this learning to lead in your organisation with integrity and purpose. Then your path to becoming a CFO is clear.
You’ve learned how this CFO programme can accelerate your strategic leadership, prepare you for the C‑Suite, and lift your finance career advancement. Enrol today. Start your journey to become a confident, strategic CFO. Take charge of your financial future now!
Know Chetan Purohit’s review on the ISB CFO Program from Imarticus Learning in this video and how it transformed his career journey.
FAQ
1. What is a CFO Programme and how does it relate to strategic CFO skills?
A CFO programme offers leadership training and strategic finance skills. You will learn more than accounting. You learn how to guide growth, manage teams, and act with integrity.
2. Can CFO leadership training really boost finance career advancement?
Yes. This executive finance programme teaches how to transition into C‑Suite positions. You will also get credibility, a network of peers, and better strategic thinking skills.
3. What outcomes can I expect from participating in the programme?
You acquire the skills of being a strategic CFO, you work with the experienced executives, you have a leadership coaching and get recognition all over the globe.
4. Who should consider enrolling in this Chief Financial Officer Programme?
Mid- to senior‑level finance professionals aiming for C‑Suite roles. Particularly those seeking executive finance programmes to develop leadership and strategic impact.
5. How does Imarticus Learning support this path to becoming a CFO?
They partner with ISB faculty and offer blended learning, leadership coaching, peer networks, and structured strategy training to help you transition effectively.
6. What is so good about this as one of the best executive finance programmes in India?
It integrates knowledge-enriched learning, leadership coaching, and practice of strategy in an actual circumstance and provides you with the network and skills to move into a C-level position.
7. Does this programme hold such promise of strategic CFO skills?
In fact, yes, the curriculum is set up to assist you to be a leader to drive improvement, develop top performing teams, and find your way through the challenges of financial scenarios with self-esteem and honesty.
The Final Words
You now understand why the CFO Programme from Imarticus Learning and ISB stands out. It focuses on strategic CFO skills, experiential learning, leadership coaching, and finance career advancement.
It addresses the challenge of moving beyond tactical finance into leadership. With real peer learning and expert faculty, you grow your social net worth and strategic strength. If you’ve felt stalled, this is the path to purposeful leadership.