


Last updated on May 15th, 2026 at 03:01 pm
Linear regression is a crucial technique in many essential types of business analytics, serving as a powerful method for modelling the relationship between variables. In simpler terms, it allows us to quantify the influence of one factor (independent variable) on another (dependent variable). This understanding is crucial for informed decision-making across various business functions.
For instance, a marketing team can leverage linear regression to analyse the impact of advertising spend on sales figures. By establishing a statistical relationship, they can predict future sales trends and optimise marketing budgets for maximum return on investment. It is tasks such as these that make the linear regression model extremely useful in many different types of business analytics.
In this article, I will discuss the core principles of linear regression and then we will explore its practical applications in the business world. We will cover the model-building process and understand its benefits for strategic decision-making. I will also address its limitations so that you can gain a well-rounded understanding of this fundamental analytical tool.
Building Your Linear Regression Model
Constructing a robust linear regression model for different types of business analytics requires a systematic approach. Here is a breakdown of the key stages involved:
- Data Collection: The foundation of any successful model is high-quality data. Ensure your data is relevant to the question you are trying to answer and captures the variables of interest. Remember, “garbage in, garbage out” applies to data quality as well.
- Data Cleaning and Preparation: Real-world data often contains inconsistencies or missing values. This stage involves meticulously cleaning your data by addressing missing entries, identifying and handling outliers, and ensuring data consistency across variables. In essence, you’re preparing your data for a clean analysis.
- Model Fitting: Here, we fit a line (the regression line) to your data using the method of least squares. This method minimises the sum of the squared residuals (the difference between predicted values and actual values). The resulting line represents the statistical relationship between the independent and dependent variables.
- Model Evaluation: Just because we have a line does not mean the model is perfect. Evaluating the model’s performance is crucial. Common metrics used here include R-squared and adjusted R-squared. These metrics tell you how well the model explains the variation in your data, helping you assess its accuracy and generalisability.
Overfitting and Underfitting
Let us take two extremes as examples. A line that perfectly fits every single data point (overfitting) and a line with almost no slope (underfitting). While an overfitted line captures every detail of the data, it might not generalise well to unseen data. Conversely, an underfitted line fails to capture the underlying relationship between variables.
A model that captures the essential trend without overfitting the data is the key to striking the right balance. Techniques like cross-validation can help identify and address overfitting or underfitting, ensuring your model achieves a good balance between accuracy and generalisability. If you wish to learn different types of business analytics concepts, techniques and methodologies you can enrol in the comprehensive business analytics course by XLRI and Imarticus. This postgraduate business analytics course will teach you everything you need to know about techniques such as logistic regression.
The Different Types of Analytics in Business Analytics That Leverage Linear Regression
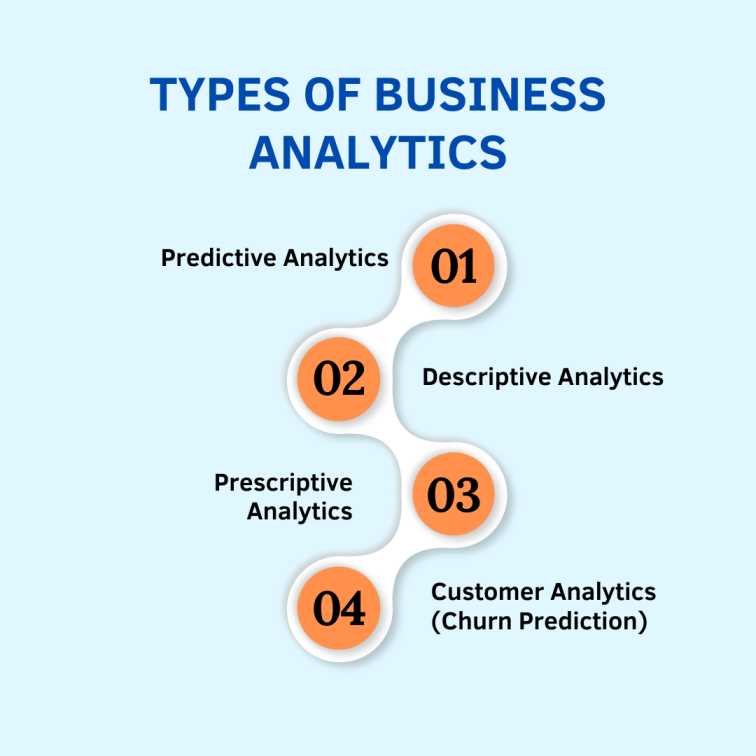
Linear regression serves as a versatile tool across various business analytics domains. Here are some prominent types of analytics with examples:
1. Predictive Analytics
Example: Forecasting Sales
Linear regression models can analyse historical sales data alongside factors like marketing spend, seasonality, and economic indicators. By identifying trends and relationships, the model predicts future sales figures, enabling informed inventory management and production planning in these types of business analytics methods.
2. Descriptive Analytics
Example: Understanding Customer Behaviour
Linear regression can analyse customer purchase history data and demographics and thus it is used in these types of business analytics processes. The model can reveal relationships between purchase patterns and customer characteristics, helping businesses identify target segments and personalise marketing campaigns.
3. Prescriptive Analytics
Example: Optimising Pricing Strategies
Linear regression models can analyse historical pricing data, customer demand, and competitor pricing. By identifying the impact of price changes on sales volume, the model can suggest optimal pricing strategies to maximise revenue while considering customer price sensitivity for these types of business analytics methods.
4. Customer Analytics (Churn Prediction)
Example: Identifying Customers at Risk of Churn
Linear regression models can analyse customer behaviour data (purchase frequency, support interactions, etc.). This is why the linear regression model is used for these types of these types of business analytics techniques. By identifying patterns associated with churn (customers leaving a service), the model predicts which customers are at risk, allowing businesses to develop targeted retention campaigns and minimise churn rates.
Business Applications in Action: The Linear Regression Model for Strategic Decisions
Linear regression transcends theory and empowers data-driven decision-making across various business functions. Let us explore how it translates into actionable insights in real-world scenarios:
Marketing Mix Optimisation
Think of a company running social media and email marketing campaigns. Linear regression can analyse the impact of each campaign on customer acquisition costs. By identifying the most effective channel, they can optimise marketing spend and maximise customer acquisition for their budget.
Customer Churn Prediction
Predicting customer churn (customers leaving a service) is critical for subscription-based businesses. Linear regression models can analyse customer behaviour data (purchase history, support interactions) to identify patterns associated with churn. This allows businesses to proactively target at-risk customers with retention campaigns and minimise churn rates.
Inventory Management
Retailers face the constant challenge of balancing stock availability with storage costs. Linear regression models can analyse historical sales data and seasonal trends to forecast future demand. This empowers businesses in optimising the inventory level, making sure that they have the right amount of stock for meeting customer requirements without incurring additional storage costs.
A/B Testing
The power of linear regression lies in its predictive capabilities. However, real-world business decisions often involve complex relationships beyond those captured in the model. Here is where A/B testing comes in.
Beyond the Line: Understanding the Boundaries of Linear Regression
Linear regression, while a powerful tool, has limitations to consider. Here, we explore these boundaries to ensure you leverage the linear regression model effectively for making informed business decisions:
Assumes Linearity
The core assumption is that the relationship between variables can be represented by a straight line. This might not always hold true in real-world scenarios where data exhibits a curved or more complex pattern. In such cases, exploring alternative models like decision trees that can capture non-linear relationships might be necessary.
Data Quality Matters
“Garbage in, garbage out” applies to linear regression. Inaccurate or incomplete data can lead to misleading predictions. Emphasise the importance of data cleaning and quality checks before model building. Outliers and missing values require careful handling to ensure the model reflects the underlying trends in your data.
Categorical Variable Hurdle
Linear regression is designed for continuous variables (numbers). It cannot directly handle categorical variables (e.g., customer type: high-value, medium-value, low-value). Techniques like dummy coding, which converts categorical variables into multiple binary variables, can be employed to incorporate them into the model.
Multicollinearity: The Entangled Variables Conundrum
Assume that two independent variables in your model are highly correlated (e.g., household income and spending on groceries). This is multicollinearity, and it can cause problems in linear regression. When variables are highly correlated, it becomes difficult to isolate the individual effect of each on the dependent variable. Techniques like correlation analysis can help identify multicollinearity. Dropping one of the highly correlated variables or using dimensionality reduction techniques can help address this issue and ensure your model accurately captures the relationships between variables.
Wrapping Up
By mastering these aspects, you can transform linear regression from a theoretical concept into a practical tool for driving strategic decision-making and achieving long-term business success. Remember, this is just the first step in your data analytics journey. Explore further avenues like model selection for non-linear relationships and delve deeper into data visualisation techniques to create compelling data stories for stakeholders.
The world of business analytics awaits. Enrol in a solid postgraduate business analytics course such as the Postgraduate Certificate in Business Analytics by XLRI and Imarticus Learning. This holistic business analytics course will teach you everything you need to become an expert business analyst.
Frequently Asked Questions
What is the difference between correlation and causation with linear regression?
Linear regression shows correlation, a connection between variables. It does not necessarily prove causation (one causing the other). Just because marketing spends and sales are correlated, does not mean spending more always directly causes more sales. Consider other factors that might influence sales as well.
Can linear regression handle very large datasets?
Yes, linear regression can work with large datasets. However, computational power and processing time might increase as the data volume grows. There are efficient algorithms optimised for large datasets, but for extremely large datasets, alternative techniques like sampling might be considered.
Is there a linear regression model readily available in software?
Many data analysis and spreadsheet software packages offer linear regression functionality. These tools can simplify the process of building and analysing linear regression models, making it accessible to users with varying levels of technical expertise.
What are some ethical considerations when using linear regression for business decisions?
Bias in the data can lead to biased predictions from the model. Be mindful of potential biases in data collection and ensure your model is representative of the target population. Use the model’s insights responsibly and avoid making discriminatory decisions based solely on model predictions.